Documentation Revision Date: 2025-02-03
Dataset Version: 1
Summary
Collected data span from before and during the COMEX airborne campaign which occurred in two windows, May 30 - June 20, and Aug. 20 - Sept. 4 2014, with additional post-campaign data collected through 2015. Post campaign data includes additional instruments that were not available during the airborne campaign. All instruments are listed in Figure 2, surveys are segregated by day, and each survey file includes all instrument and platform details. There are 58 data files in HDF format (.h5) with this dataset.

Figure 1. A) AVIRIS-NG (Airborne Visible InfraRed Imaging Spectrometer-Next Generation) retrieved methane (CH4) detection for the Kern Front oil field (plumes - blue arrows) by matched cluster filter. Also shown are contemporaneous surface AMOG CH4 concentrations and wind, u, vectors. B) Gaussian plume inversion model contours for a plume shown by red arrow in panel A. AVIRIS-NG plume indicated by green arrow. Inset shows expansion of source area (green arrow), dark object likely is a well pump jack. Data key is on panel A.
Citation
Leifer, I., H. Bovensmann, M. Fladeland, R. Kolyer, L. Iraci, B. Luna, D.R. Thompson, M. Eastwood, R.O. Green, C. Melton, H. Jonsson, S. Vigil, and D.M. Tratt. 2025. COMEX: AMOG Surface Mobile in situ Data Surveyor, USA, 2014-2015. ORNL DAAC, Oak Ridge, Tennessee, USA. https://doi.org/10.3334/ORNLDAAC/2387
Table of Contents
- Dataset Overview
- Data Characteristics
- Application and Derivation
- Quality Assessment
- Data Acquisition, Materials, and Methods
- Data Access
- References
Dataset Overview
This dataset provides AutoMObile trace Gas Surveyor (AMOG) in situ relevant datasets collected during the CO2 and Methane EXperiment (COMEX) field campaign and afterwards. COMEX was conducted in the summer and fall 2014 to study strong methane, CH4, sources in S. California including animal husbandry, fossil fuel industrial (FFI) production, petroleum refining, landfills, and natural geological formations. The AMOG Surveyor is a mobile air quality laboratory built into a passenger car. AMOG Surveyor uses an asynchronous logging system based on a NMEA tagging protocol, termed a tagstream. Analyzers provide data at rates from 5 Hz to 0.016 Hz. Tagstream data are timestamped based on the time of the analyzer measurement, which does not take into account the air sample travel time in sample tubes and analyzers, termed layback time. This dataset contains Level 0 (L0) and Level 1 (L1) data. L0 data were analyzed and sensor data interpolated to a uniform timebase of 5 Hz, correcting for the layback time, the time of flight for air samples in the sample tube and analyzers. L1 data include true winds (corrected for vehicle velocity), with filtering of outliers, non-physical data, and gap filling. The data files are in HDF-5 (.h5) format.
This dataset covers AMOG Surveyor relevant data during the COMEX field campaign and afterwards to understand the observations collected during the field campaign. This system provides robust data collection, even in cases where some signals are lost periodically (e.g., GPS) or data from the instrument are mis-formatted.
Project: COMEX
The CO2 and MEthane eXperiment (COMEX) campaign, funded bilaterally by NASA and ESA, supported the mission definition of CarbonSat and HyspIRI by providing representative airborne remote sensing data as well as ground-based and airborne in situ data. The objectives were addressed by a unique combination of VIS/NIR/SWIR hyperspectral remote sensing airborne instrumentation (AVIRIS-C, AVIRIS-NG), TIR hyperspectral remote sensing airborne instrumentation (Mako), NIR/SWIR spectroscopic remote sensing airborne instrumentation (MAMAP) as well as in situ airborne (Picarro GHG sensor/analyzer and CIRPAS atmospheric measurements suite) and ground based (AMOG - AutoMObile greenhouse Gas surveyor) measurements for validation and interpretation support. COMEX demonstrated that methane emissions associated with fossil fuel production activities in the Los Angeles area were of sufficient magnitude and size for space-based observations. COMEX was executed between May and September 2014 around the Southern California, USA, area.
Related Publications
Krautwurst, S., K. Gerilowski, T. Krings, J. Borchard, and H. Bovensmann. 2016. COMEX - Final Report. University of Bremen; Germany. https://airbornescience.nasa.gov/sites/default/files/documents/COMEX_FR_v2.0_final_.pdf
Leifer, I., C. Melton, D.M. Tratt, and K.N. Buckland. 2022. Airborne trace gas remote sensing and surface mobile in situ: a novel tool for the study of structural geological controls from a producing oil field. SPE Production & Operations 37:654–663. https://doi.org/10.2118/209799-PA
Leifer, I., and C. Melton. 2021. Using mobile surface in situ and remote sensing and airborne remote sensing to derive emissions from a producing central California oil field in complex terrain. Atmospheric Pollution Research 12:101145. https://doi.org/10.1016/j.apr.2021.101145
Leifer, I., C. Melton, D.M. Tratt, K.N. Buckland, C.S. Chang, J. Frash, J.L. Hall, A. Kuze, B. Leen, L. Clarisse, T. Lundquist, M. Van Damme, S. Vigil, S. Whitburn, and L. Yurganov. 2018. Validation of mobile in situ measurements of dairy husbandry emissions by fusion of airborne/surface remote sensing with seasonal context from the Chino Dairy Complex. Environmental Pollution 242:2111–2134. https://doi.org/10.1016/j.envpol.2018.03.078
Acknowledgements
This study was funded by the NASA Earth Science Division, Research and Analysis, grant NNX13AM21G, the NASA Earth Science Division, Research and Analysis, grant NNX12AQ16G, and Bubbleology Research International, Internal Research and Development (IRAD).
Data Characteristics
Spatial Coverage: California, US
Spatial Resolution: 0.04 to 24 m, dependent on platform velocity
Temporal Coverage: 2014-06-07 to 2015-08-19
Temporal Resolution: Time resolutions vary from 0.2 s to 120 s depending on the analyzer during a field day; field days are irregular.
Site Boundaries: Latitude and longitude are given in decimal degrees.
| Site | Westernmost Longitude | Easternmost Longitude | Northernmost Latitude | Southernmost Latitude |
|---|---|---|---|---|
| California, US | -120.716 | -115.564 | 36.211 | 32.969 |
Data File Information
There are 58 data files in HDF format (.hf5) with this dataset. The files are named for the processing date and time.
The files are named SIS_YYYYMMDD_YYYYMMDDhhmm_LX_v0.8.h5, where
- SIS = Standard Instrumentation Suite
- YYYYYMMDD = date of data collection
- YYYYMMDDhhmm = data processing date and time
- LX = data level "L0" or "L1".
Example file names:SIS_20140607_202409271757_L0_v0.8.h5 and SIS_20140607_202409271807_L1_v0.8.h5
Figure 2 provides a summary of the variables in the survey data files. Surveys are segregated by day, and each survey file includes site (Dairy, etc), GPS, latitude, longitude, all instruments, and platform details. Note that all variables are not in all files. Missing data are represented by NaN without any filtering.
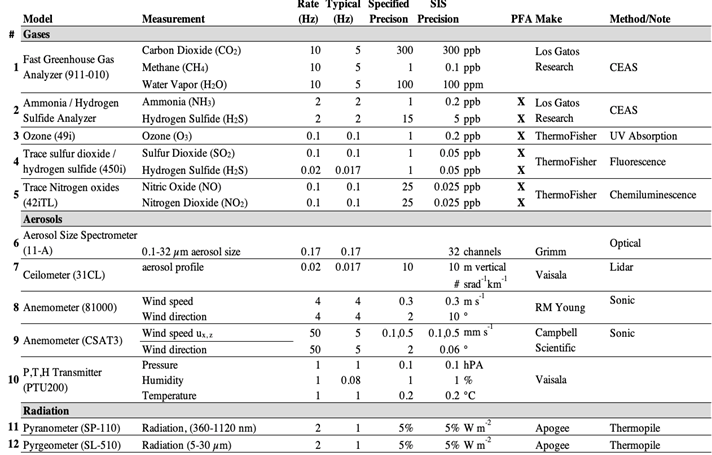
Figure 2. Survey data file details.
The spatial resolution depends on the platform velocity and temporal sampling frequency. Platform velocity can be as slow as 0.2 m s-1 and as fast as 35 m s-1. For 0.2 s to 120 s temporal resolution, spatial resolution is 0.04 to 24 m . For platform velocity of 35 m s-1, spatial resolution is 7 to 5250 m.
Application and Derivation
Some of the datasets in the COMEX data archive were collected contemporaneously between mobile in situ data and remote sensing data, and thus can be used for remote sensing retrieval validation. Such combined datasets are rare.
Additionally, data can be used to derive methane and carbon dioxide and other trace gas emissions from a range of sources including landfills, natural seepage, and oil and gas fields, as well as establishing baseline data during transits.
Quality Assessment
Uncertainty in the measurements are addressed in each of the published manuscripts. Specifically, uncertainty is driven by natural variability and representativeness of the data rather than instrumentation error, which is in all cases, smaller. Uncertainty is addressed at the emissions level through Monte Carlo Simulations using observed variability.
In the data files, quality flags indicate analyzer problems and missing data.
Data Acquisition, Materials, and Methods
The AMOG Surveyor is a mobile air quality laboratory built into a passenger automobile and uses an asynchronous logging system based on a NMEA tagging protocol, termed a tagstream. This system provides robust data collection, even in cases where some signals are lost periodically (e.g., GPS) or data from the instrument are mis-formatted. Analyzers provide data at rates from 5 Hz to 0.016 Hz. Moreover, tagstream data are timestamped based on the time of the analyzer measurement, which does not take into account the air sample travel time in sample tubes and analyzers – termed layback time. Level 0 data were analyzer and sensor data interpolated to a uniform timebase of 5 Hz, correcting for the layback time. Level 1 data include true winds (corrected for vehicle velocity), with filtering of outliers, non-physical data, and gap filling.
Data collection occurred before the airborne campaign (30 May to 20 June 2014) and during the airborne campaign (20 August to 04 September 2014), with additional post-campaign data collected through 2015. Post campaign data include additional instruments that were not available during the airborne campaign.
Data Access
These data are available through the Oak Ridge National Laboratory (ORNL) Distributed Active Archive Center (DAAC).
COMEX: AMOG Surface Mobile in situ Data Surveyor, USA, 2014-2015
Contact for Data Center Access Information:
- E-mail: uso@daac.ornl.gov
- Telephone: +1 (865) 241-3952
References
Krautwurst, S., K. Gerilowski, T. Krings, J. Borchard, and H. Bovensmann. 2016. COMEX - Final Report. University of Bremen; Germany. https://airbornescience.nasa.gov/sites/default/files/documents/COMEX_FR_v2.0_final_.pdf
Leifer, I., C. Melton, D.M. Tratt, and K.N. Buckland. 2022. Airborne trace gas remote sensing and surface mobile in situ: a novel tool for the study of structural geological controls from a producing oil field. SPE Production & Operations 37:654-663. https://doi.org/10.2118/209799-PA
Leifer, I., and C. Melton. 2021. Using mobile surface in situ and remote sensing and airborne remote sensing to derive emissions from a producing central California oil field in complex terrain. Atmospheric Pollution Research 12:101145. https://doi.org/10.1016/j.apr.2021.101145
Leifer, I., C. Melton, D.M. Tratt, K.N. Buckland, C.S. Chang, J. Frash, J.L. Hall, A. Kuze, B. Leen, L. Clarisse, T. Lundquist, M. Van Damme, S. Vigil, S. Whitburn, and L. Yurganov. 2018. Validation of mobile in situ measurements of dairy husbandry emissions by fusion of airborne/surface remote sensing with seasonal context from the Chino Dairy Complex. Environmental Pollution 242:2111-2134. https://doi.org/10.1016/j.envpol.2018.03.078