Documentation Revision Date: 2024-04-24
Dataset Version: 1
Summary
This dataset contains seven data files; six in Cloud-Optimized GeoTIFF (*.tif) format and one in comma separated (.csv) format.
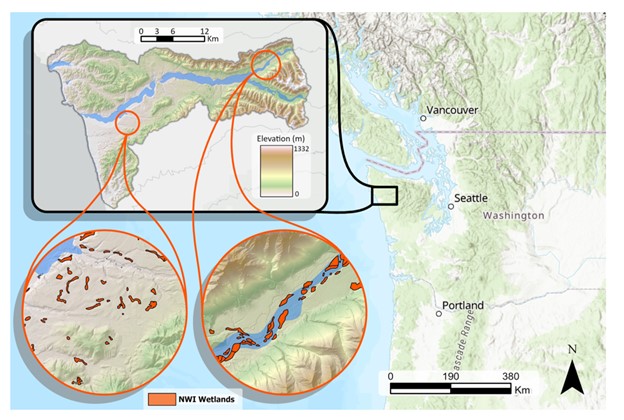
Figure 1. Location of the Hoh River Watershed (HRW) study area. This map also shows National Wetlands Inventory polygons which represent currently mapped wetlands.
Citation
Stewart, A., M. Halabisky, C. Babcock, D. Butman, D.V. D'amore, and L.M. Moskal. 2024. Soil Organic Carbon and Wetland Intrinsic Potential, Hoh River Watershed, WA, 2012-13. ORNL DAAC, Oak Ridge, Tennessee, USA. https://doi.org/10.3334/ORNLDAAC/2249
Table of Contents
- Dataset Overview
- Data Characteristics
- Application and Derivation
- Quality Assessment
- Data Acquisition, Materials, and Methods
- Data Access
- References
Dataset Overview
This dataset contains estimates of SOC and WIP across the Hoh River Watershed in the Olympic Peninsula, WA, USA in 2012-2013. Estimates were derived from an equation based on wetland intrinsic potential and geology type (Stewart et al., 2023). WIP estimates the likelihood that that an area is a wetland using a random forest model built on vegetation, hydrology, and soil data (Halabisky et al., 2022). Refer to Section 5 of this document for additional information.
Project: Carbon Monitoring System (CMS)
The NASA Carbon Monitoring System (CMS) program is designed to make significant contributions in characterizing, quantifying, understanding, and predicting the evolution of global carbon sources and sinks through improved monitoring of carbon stocks and fluxes. The System uses NASA satellite observations and modeling/analysis capabilities to establish the accuracy, quantitative uncertainties, and utility of products for supporting national and international policy, regulatory, and management activities. CMS data products are designed to inform near-term policy development and planning.
Related Publications:
Halabisky, M, D Miller, AJ Stewart, D Lorigan, T Brasel, and LM Moskal. 2022. The Wetland Intrinsic Potential tool: Mapping wetland intrinsic potential through machine learning of multi-scale remote sensing proxies of wetland indicators, EGUsphere [preprint], https://doi.org/10.5194/egusphere-2022-665.
Stewart, Anthony J., Meghan Halabisky, Chad Babcock, David E. Butman, David V. D’Amore, and L. Monika Moskal. “Revealing the Hidden Carbon in Forested Wetland Soils.” Nature Communications 15, no. 1 (January 25, 2024): 726. https://doi.org/10.1038/s41467-024-44888-x
Acknowledgements:
This work was supported by NASA Grant Number 80NSSC20K0427 P00003 and USDA Forest Service Joint Venture Agreement 20-JV-11261933-058 AM003.
Data Characteristics
Spatial Coverage: Hoh River Watershed, Olympic Peninsula, WA, USA
Spatial Resolution: 4 m
Temporal Coverage: Lidar acquisition used for the models: 2012-01-01 to 2013-12-31
Field observations: 2020-08-01 to 2022-06-29
Temporal Resolution: One-time estimate
Study Areas: Latitude and longitude are given in decimal degrees.
| Site | Westernmost Longitude | Easternmost Longitude | Northernmost Latitude | Southernmost Latitude |
|---|---|---|---|---|
| Hoh River Watershed, WA | -124.54 | -123.83 | 47.90 | 47.57 |
Data File Information
This dataset contains seven data files; six in Cloud-Optimized GeoTIFF (*.tif) format and one in comma separated (.csv) format:
- HRW_GEOLOGY.tif: Contains mapped surficial geology from the Washington State Department of Natural Resources mapped at 4-m horizontal resolution. A value of 0 = MioEo or Miocene/Eocene, 1=alluvium_marine_water, 2=glac_drift or glacial drift, and 3=till_outwash or glacial till/outwash.
- HRW_SOC_1M.tif: Contains estimates of soil organic carbon (SOC) stock at 1 m depth at 4-m horizontal resolution. Estimates are made in Mg ha-1.
- HRW_SOC_1M_stdev.tif: Contains standard deviations of the 1 m SOC estimates. Estimates are made in Mg ha-1.
- HRW_SOC_30CM.tif: Contains estimates of soil organic carbon (SOC) stock at 30 cm depth at 4-m horizontal resolution. Estimates are made in Mg ha-1.
- HRW_SOC_30CM_stdev.tif: Contains standard deviations of the 30 cm SOC estimates. Estimates are made in Mg ha-1.
- HRW_WIP.tif: Contains wetland intrinsic probability (WIP) at 4-m horizontal resolution. WIP was derived from Halabisky et al (2022) to identify the probabily that an area is a wetland using a remote sensing approach. WIP was used along with the surficial geology layer to predict the 1 m and 30 cm SOC stocks across the study area
- HRW_pedon_field_observations.csv: Contains field measurements of SOC from eight wetland and 28 upland locations within the study area during the summer months between 2020-08-01 of 2021-08-31. Pedon sampling consisted of extracting soil samples for each horizon down to 1 m or more depending on restricting layers.
Missing data are indicated by a value of -9999
Table 1. Data dictionary for HRW_pedon_field_observations.csv
| Variable | Units | Description |
|---|---|---|
| Sample_ID | The unique sample identification name | |
| Date_collected | YYYY-MM-DD | Date of sample collection |
| Lat | Decimal degrees | The latitude measured with a JAVAD Triumph 2 in EPSG:4326 coordinate reference system |
| Lon | Decimal degrees | The longitude measured with a JAVAD Triumph 2 in EPSG:4326 coordinate reference system |
| SOC_stock_30cm | Mg ha-1 | The 30 cm depth soil organic carbon (SOC) stock in the pedon |
| SOC_stock_60cm | Mg ha-1 | The 60 cm depth SOC stock in the pedon |
| SOC_stock_100cm | Mg ha-1 | The 1 meter depth SOC stock in the pedon |
| SOC_stock_120cm | Mg ha-1 | The 120 cm depth SOC stock in the pedon |
| SOC_stock_total | Mg ha-1 | The total SOC stock in the pedon |
| Max_depth | cm | The maximum depth of the pedon |
| n_horizons | The number of horizons within the pedon | |
| WIP | The wetland intrinsic potential probability at the sample location | |
| Geology | The surficial geology at the pedon site from the Washington Department of Natural Resources. The different categories include: MioEo for Miocene/Eocene geology, alluvium_marine_water for water deposited material, glac_drift for glacial drift material, and till_outwash for glacial till and outwash material | |
| Land_type | Land type where sample was collected: Upland, Palustrine Wetland, or Riverine Wetland |
Application and Derivation
These data show the enhanced maps of soil organic carbon (SOC) stocks revealing carbon storage in wetlands that have not been mapped before. Comparing these maps to currently available SOC maps reveals new patterns of SOC across a landscape associated with wetlands. This dataset provides insight for making further mapping improvements in mapping the distribution of soil carbon and for land management decision making.
Quality Assessment
The authors report the standard deviation of 1 m and 30 cm SOC estimates in HRW_SOC_1M_stdev.tif and HRW_SOC_30CM_stdev.tif, respectively.
Uncertainty analysis was based on bootstrapped observations from the field collected SOC dataset used to model SOC stocks across the study area. A bootstrapped dataset was built and used in the SOC prediction model. This process was repeated 300 times and the range of the uncertainty is the standard deviation of the subsequent model results. This model may be limited by the number of observations in the field collected dataset (36), all of which were used in the prediction.
Data Acquisition, Materials, and Methods
The methods used to measure, calculate, and produce maps of the soil carbon stocks in these datasets are described by Stewart et al (2023) and Halabisky et al. (2022). Stewart et al. (2023) describes the soil carbon data and calculations. The wetland intrinsic potential tool (Halabisky et al., 2022) was used in Stewart et al., 2023 to calculate and map the soil carbon stocks. Please see these publications for in depth methodology. Overviews of the methodology are below.
The wetland intrinsic potential values were derived from the Wetland Intrinsic Potential tool presented in Halabisky et al. (2022). The tool uses a random forest model with inputs from 4-band aerial imagery acquired by the National Aerial Imagery Program (NAIP), a lidar-derived digital elevation model and digital surface model, and SSURGO soils data.
Estimates of SOC in the Hoh River Watershed were modeled in Stewart et al. (2023). Using WIP estimates and surface geology type, SOC stocks were modeled using the equation below:
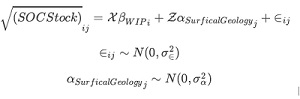
Figure 2: Equation used to derive SOC stocks. Where χ is the fixed effects design matrix for the βWIPi in pedon i, Ƶ is the random effects design matrix for the random effects αSurficalGeologyj for an geology type j, and ∈ij is our model error. The model error ∈ij follows a normal distribution with σ2∈ error. Pedons sampled from the random effect αSurficalGeologyj are considered a random sample from a separate normal distributions for each surficial geology type j.
Field sampling used a stratified random sampling approach across the HRW wetland probability distribution. 8 upland and 28 wetland sites were sampled. Carbon content of subsamples was measured using a Perkin Elmer Co. 2400 model Total Carbon, Hydrogen, and Nitrogen (CHN) Analyzer. SOC stock was calculated from samples using the total carbon percentage from the CHN analyzer multiplied by the bulk density and soil horizon thickness, then summed for an entire pedon to give the SOC stock at that location.
These geolocated SOC stocks were then used to extract geospatial metrics, one of which is a continuous wetland probability map and the other is a surficial geology map. Metrics extracted from these geospatial metrics were then used to model SOC stocks across the HRW study area extent. The results show wetland-inclusive SOC maps that can aid in land use decision making.
Data Access
These data are available through the Oak Ridge National Laboratory (ORNL) Distributed Active Archive Center (DAAC).
Soil Organic Carbon and Wetland Intrinsic Potential, Hoh River Watershed, WA, 2012-13
Contact for Data Center Access Information:
- E-mail: uso@daac.ornl.gov
- Telephone: +1 (865) 241-3952
References
Halabisky, M., D. Miller, A.J. Stewart, D. Lorigan, T. Brasel, and L.M. Moskal. 2022. The Wetland Intrinsic Potential tool: Mapping wetland intrinsic potential through machine learning of multi-scale remote sensing proxies of wetland indicators, EGUsphere [preprint], https://doi.org/10.5194/egusphere-2022-665.
Stewart, Anthony J., Meghan Halabisky, Chad Babcock, David E. Butman, David V. D’Amore, and L. Monika Moskal. “Revealing the Hidden Carbon in Forested Wetland Soils.” Nature Communications 15, no. 1 (January 25, 2024): 726. https://doi.org/10.1038/s41467-024-44888-x