Documentation Revision Date: 2022-09-22
Dataset Version: 1
Summary
This dataset includes one data file in Cloud-Optimized GeoTIFF (*.tif) format.
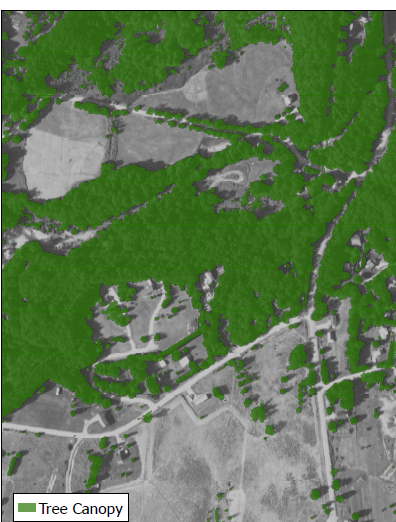
Figure 1: Vermont 2016 Tree Canopy dataset displayed in transparent green over a 2016 National Agriculture Imagery Program image (panchromatic).
Citation
O'Neil-Dunne, J., E. Buford, S. Macfaden, and A. Royar. 2022. CMS: Tree Canopy Cover at 0.5-meter resolution, Vermont, 2016. ORNL DAAC, Oak Ridge, Tennessee, USA. https://doi.org/10.3334/ORNLDAAC/2072
Table of Contents
- Dataset Overview
- Data Characteristics
- Application and Derivation
- Quality Assessment
- Data Acquisition, Materials, and Methods
- Data Access
- References
Dataset Overview
This dataset contains estimates of tree canopy cover presence at high resolution (0.5m) across the state of Vermont for 2016 in Cloud-Optimized GeoTIFF (*.tif) format. Tree canopy was derived from 2016 high-resolution remotely sensed data as part of the Vermont High-Resolution Land Cover mapping project. Object-based image analysis techniques (OBIA) were employed to extract potential tree canopy and trees using the best available remotely sensed and vector GIS datasets. OBIA systems work by grouping pixels into meaningful objects based on their spectral and spatial properties, while taking into account boundaries imposed by existing vector datasets. Within the OBIA environment a rule-based expert system was designed to effectively mimic the process of manual image analysis by incorporating the elements of image interpretation (color/tone, texture, pattern, location, size, and shape) into the classification process. A series of morphological procedures were employed to ensure that the end product is both accurate and cartographically pleasing. Following the automated OBIA mapping a detailed manual review of the dataset was carried out at a scale of 1:3000 and all observable errors were corrected. Tree canopy assessments have been conducted for numerous communities throughout the U.S. where the results have been instrumental in helping to establishing tree canopy goals.
Project: Carbon Monitoring System
The NASA Carbon Monitoring System (CMS) program is designed to make significant contributions in characterizing, quantifying, understanding, and predicting the evolution of global carbon sources and sinks through improved monitoring of carbon stocks and fluxes. The System uses NASA satellite observations and modeling/analysis capabilities to establish the accuracy, quantitative uncertainties, and utility of products for supporting national and international policy, regulatory, and management activities. CMS data products are designed to inform near-term policy development and planning.
Related Data:
O'Neil-Dunne, J. 2019. CMS: LiDAR-derived Tree Canopy Cover for States in the Northeast USA. ORNL DAAC, Oak Ridge, Tennessee, USA. https://doi.org/10.3334/ORNLDAAC/1334
- This data set provides high-resolution (1-m) tree canopy cover for states in the Northeast USA.
Acknowledgements:
This assessment and development of methods necessary for its conduct were completed by the University of Vermont's Spatial Analysis Laboratory with funding from the State of Vermont Clean Water Fund, Vermont Agency of Natural Resources, Vermont Agency of Transportation, Lake Champlain Basin Program, the Vermont Center for Geographic Information (VCGI), and NASA Carbon Monitoring System (NASA-CMS) projects NNX12AN07G, NNX14AP12G, and 80NSSC17K0710.
Data Characteristics
Spatial Coverage: Vermont, USA
Spatial Resolution: 0.5m
Temporal Coverage: 2016-07-27 to 2016-09-13
Temporal Resolution: One-time estimate
Study Areas: Latitude and longitude are given in decimal degrees.
| Site | Westernmost Longitude | Easternmost Longitude | Northernmost Latitude | Southernmost Latitude |
|---|---|---|---|---|
| Vermont, USA | -73.50 | -71.40 | 45.10 | 42.60 |
Data File Information
This dataset includes one file in Cloud-Optimized GeoTiff (*.tif) format: treecanopy_2016_vermont.tif. The file contains estimates of tree canopy cover presence across Vermont at 0.5m resolution. A value of 1 indicates the presence of tree canopy and 0 indicates the absence of tree canopy at a given pixel.
Missing data are indicated by a value of 3.
Projection: NAD 1983 State Plane Vermont (EPSG:32145)
Application and Derivation
Tree canopy assessments have been conducted for numerous communities throughout the U.S. where the results have been instrumental in helping to establishing tree canopy goals.
Quality Assessment
An accuracy assessment of the base 8-class land cover product used to extract this 2016 tree canopy dataset, was carried out through an independent assessment of 5000 points. A stratified sampling first placed 100 points randomly within each land cover class and then an additional random sampling paced 4200 points throughout the state. Each point was independently reviewed and assigned a reference class based on the 2016 National Agriculture Imagery Program (NAIP) imagery. After assigning a reference class for each point, the points were overlaid on the 8-class land cover to assign the mapped class. This dataset was then used to calculate the producer's, user's, and overall accuracy. Producer's and user's accuracy for the tree canopy class were 94% and 95%, respectively.
Data Acquisition, Materials, and Methods
Land cover features were extracted using a combination of automated feature extraction techniques and manual editing. An OBIA system was designed, developed, and deployed to handle the automated feature extraction. This system integrated the relevant source datasets into a data stack, then used a combination of segmentation, classification, and morphology algorithms to extract features. Source datasets for mapping land cover included leaf-on, 4-band NAIP imagery collected in Summer 2016 (0.6-meter resolution), leaf-off Vermont orthophotos (generally 0.5-meter resolution), point clouds and surface models (1-meter resolution) from LiDAR collects acquired in the period 2013-2017, Microsoft building polygons, and vector datasets acquired from Vermont Center for Geographic Information -- e911 building points and driveways, road centerlines, and the Vermont Hydrography Dataset water polygons and lines.
Feature extraction began by mapping buildings by first using the Microsoft buildings, and then carrying out refinements as required using the LiDAR point clouds and surface models. For buildings not captured by Microsoft the logic was: 1) near the E911 building points, 2) a high percentage of building classified points, 3) tall in the normalized digital surface model (nDSM, or difference between DSM and DEM), 4) little difference between the DSM and digital terrain model (DTM), and 5) low normalized difference vegetation index (NDVI) values in the imagery.
The system developed for extracting tree canopy was virtually identical to buildings, but with the logic reversed. Trees were tall in the nDSM, had a high percentage of tree classified points in the LiDAR point cloud, a more significant difference when the DTM was subtracted from the DSM, and high NDVI values.
Data Access
These data are available through the Oak Ridge National Laboratory (ORNL) Distributed Active Archive Center (DAAC).
CMS: Tree Canopy Cover at 0.5-meter resolution, Vermont, 2016
Contact for Data Center Access Information:
- E-mail: uso@daac.ornl.gov
- Telephone: +1 (865) 241-3952
References
O'Neil-Dunne, J. 2019. CMS: LiDAR-derived Tree Canopy Cover for States in the Northeast USA. ORNL DAAC, Oak Ridge, Tennessee, USA. https://doi.org/10.3334/ORNLDAAC/1334