Documentation Revision Date: 2019-12-17
Dataset Version: 1
Summary
This dataset includes 12 data files: 9 files in GeoTIFF (*.tif) format, one *.csv file, and 2 compressed files in Shapefile (*.zip) format. There are also five companion files that provide additional information.
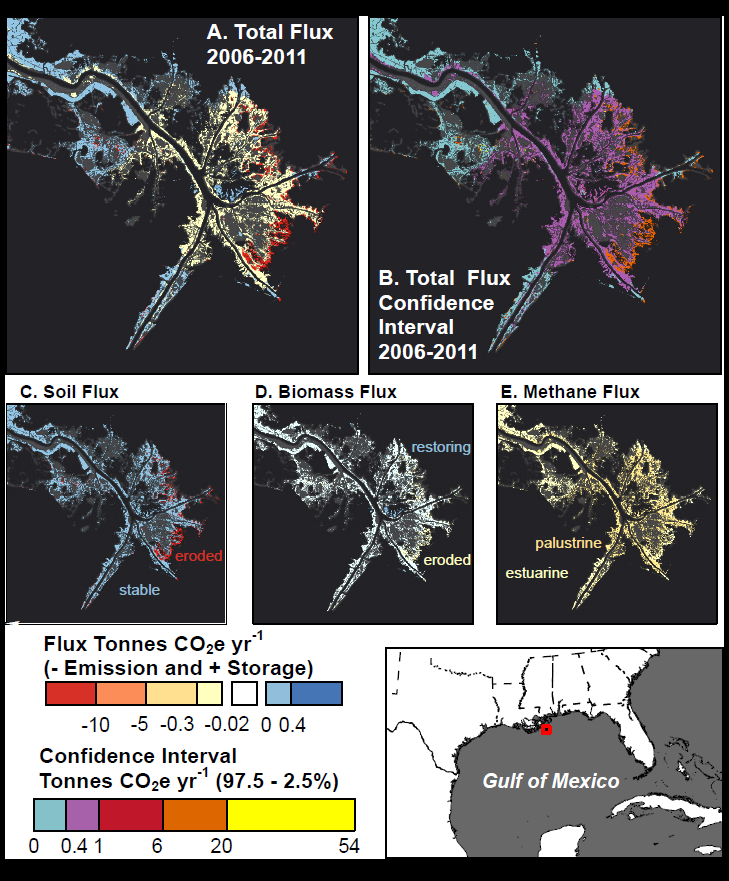
Figure 1. Estimated CO2e fluxes and confidence interval ranges for the Mississippi River outlet in Louisiana, United States. This area contains palustrine and estuarine wetlands, and includes stable wetlands, wetland gains and loss events from 2006 to 2011. A: Total flux from 2006 to 2011. B. Uncertainty, as represented by confidence interval range (0.975 - 0.025 quantile distributions of the results of the Monte Carlo Analysis). C-E. The relative contributions of soil, biomass, and methane to the total flux (A).
Citation
Holmquist, J.R., L. Windham-Myers, B. Bernal, K.B. Byrd, S. Crooks, M.E. Gonneea, N. Herold, S.H. Knox, K. Kroeger, J. Mccombs, P.J. Megonigal, L. Meng, J.T. Morris, A.E. Sutton-grier, T. Troxler, and D. Weller. 2019. Coastal Wetland Elevation and Carbon Flux Inventory with Uncertainty, USA, 2006-2011. ORNL DAAC, Oak Ridge, Tennessee, USA. https://doi.org/10.3334/ORNLDAAC/1650
Table of Contents
- Dataset Overview
- Data Characteristics
- Application and Derivation
- Quality Assessment
- Data Acquisition, Materials, and Methods
- Data Access
- References
Dataset Overview
This dataset provides maps of coastal wetland carbon and methane fluxes and coastal wetland surface elevation from 2006 to 2011 at 30 m resolution for coastal wetlands of the conterminous United States. Total coastal wetland carbon flux per year per pixel was calculated by combining maps of wetland type and change with soil, biomass, and methane flux data from a literature review. Uncertainty in carbon flux was estimated from 10,000 iterations of a Monte Carlo analysis. In addition to the uncertainty analysis, this data set also provides a probabilistic map of the extent of tidal elevation, as well as the geospatial files used to create that surface, and (2) a land cover and land cover change map of the coastal zone from 2006 to 2011 with accompanying estimated median soil, biomass, methane, and total CO2 equivalent annual fluxes, each with reported 95% confidence intervals, at 30 m resolution. Land cover was quantified using the Coastal Change Analysis Program (C-CAP), a Landsat-based land cover mapping product.
Project: Carbon Monitoring System (CMS)
The NASA Carbon Monitoring System (CMS) is designed to make significant contributions in characterizing, quantifying, understanding, and predicting the evolution of global carbon sources and sinks through improved monitoring of carbon stocks and fluxes. The System will use the full range of NASA satellite observations and modeling/analysis capabilities to establish the accuracy, quantitative uncertainties, and utility of products for supporting national and international policy, regulatory, and management activities. CMS will maintain a global emphasis while providing finer scale regional information, utilizing space-based and surface-based data and will rapidly initiate generation and distribution of products both for user evaluation and to inform near-term policy development and planning.
Related Publication
Holmquist, J.R., Windham-Myers, L., Bernal, B., Byrd, K.B., Crooks, S., Gonneea, M.E., Herold, N., Knox, S.H., Kroeger, K.D., McCombs, J. and Megonigal, J.P., 2018. Uncertainty in United States coastal wetland greenhouse gas inventorying. Environmental Research Letters, 13(11), p.115005. https://doi.org/10.1088/1748-9326/aae157
Acknowledgments
This work was funded by the Carbon Monitoring System (NNH14AY67I), Coastal Carbon Research Coordination Network (DEB-1655622), USGS Landcarbon, and the Smithsonian Institution.
Data Characteristics
Spatial Coverage: Oceanic coastal regions of the Continental United States
Spatial Resolution: 30 m (300 m for tide gauge datum transformation and uncertainty layers)
Temporal Coverage: 2006-01-01 to 2011-12-31
Temporal Resolution: annual
Study Area: (all latitudes and longitudes given in decimal degrees)
| Site | Westernmost Longitude | Easternmost Longitude | Northernmost Latitude | Southernmost Latitude |
|---|---|---|---|---|
| Continental USA | -135.0275111 | -56.66266111 | 48.9917 | 20.38312778 |
Data File Information
This dataset includes 12 data files: 9 files in GeoTIFF (*.tif) format, one *.csv file, and 2 compressed shapefiles (*.zip). Abbreviations in the filenames include:
MHHW = Mean Higher High Water
MHHWS = Mean Higher High Water Spring
NAVD88 = North American Vertical Datum 1988
For all files:
- The projection is EPSG:42303
- The no data value is -9999, except for coastal_wetland_downscaled_carbon_fluxes_2006_to_2011.tif, which uses 0 as the no data value.
- The resolution for all GeoTIFF files is 300 m except for probability_elevation_is_below_MHHWS.tif and coastal_wetland_downscaled_carbon_fluxes_2006_to_2011.tif, which have a resolution of 30 m.
Table 1. A summary of the 12 primary data files included in this dataset.
|
File Name |
Units |
Description |
|---|---|---|
|
coastal_wetland_downscaled_carbon_fluxes_2006_to_2011.tif |
|
Value corresponding to land cover class or change type; see Table 2 for land change classes. |
| coastal_wetland_downscaled_carbon_fluxes_2006_to_2011.csv |
|
A lookup table for each of the 'Value' fields in the data file above. Provides the same information as the companion file coastal_wetland_downscaled_carbon_fluxes_2006_to_2011.tif.vat.dbf as described in Table 3. |
| MHHW_NAVD88_gauges.zip | meters | Point data from tide gauges showing MHHW elevation relative to NAVD88 and station datum. |
| MHHW_NAVD88_interpolated.tif | meters | MHHW relative to NAVD88, interpolated between tide gauges |
|
MHHW_NAVD88_datum_error.tif |
meters |
Standard error of datum, interpolated between tide gauges |
|
MHHW_NAVD88_interpolation_error.tif |
meters |
Standard error resulting from empirical bayesian kriging between tide gauges |
|
MHHWS_MHHW_gauges.zip |
meters |
MHHWS relative to MHHW, point data from tide gauges |
|
MHHWS_MHHW_interpolated.tif |
meters |
MHHWS relative to MHHW, interpolated between tide gauges |
|
MHHWS_MHHW_datum_error.tif |
meters |
Standard error of datum, interpolated between tide gauges |
|
MHHWS_MHHW_interpolation_error.tif |
meters |
Standard error resulting from empirical bayesian kriging between tide gauges |
|
MHHWS_NAVD88_propagated_uncertainty.tif |
meters |
Propagated uncertainty in converting elevation relative to NAVD88 to elevation relative to MHHWS |
|
probability_elevation_is_below_MHHWS.tif |
|
Probability elevation is lower than MHHWS |
Data File Details
Table 2. Details for file coastal_wetland_downscaled_carbon_fluxes_2006_to_2011.tif. The column 'Value' corresponds to each class, which is described as the "Coastal Change Analysis Program (C-CAP) change class from 2006 to 2010/11." See Table 3 for additional information.
| Value | Cell Count | class |
|---|---|---|
| 39 | 3 | High Intensity Developed to Palustrine Scrub/Shrub Wetland |
| 40 | 19 | High Intensity Developed to Palustrine Emergent Wetland |
| 41 | 3 | High Intensity Developed to Estuarine Forested Wetland |
| 42 | 1 | High Intensity Developed to Estuarine Scrub/Shrub Wetland |
| 43 | 363 | High Intensity Developed to Estuarine Emergent Wetland |
| 63 | 5 | Medium Intensity Developed to Palustrine Forested Wetland |
| 64 | 22 | Medium Intensity Developed to Palustrine Scrub/Shrub Wetland |
| 65 | 72 | Medium Intensity Developed to Palustrine Emergent Wetland |
| 66 | 1 | Medium Intensity Developed to Estuarine Forested Wetland |
| 67 | 3 | Medium Intensity Developed to Estuarine Scrub/Shrub Wetland |
| 68 | 529 | Medium Intensity Developed to Estuarine Emergent Wetland |
| 88 | 100 | Low Intensity Developed to Palustrine Forested Wetland |
| 89 | 117 | Low Intensity Developed to Palustrine Scrub/Shrub Wetland |
| 90 | 274 | Low Intensity Developed to Palustrine Emergent Wetland |
| 91 | 5 | Low Intensity Developed to Estuarine Forested Wetland |
| 92 | 21 | Low Intensity Developed to Estuarine Scrub/Shrub Wetland |
| 93 | 979 | Low Intensity Developed to Estuarine Emergent Wetland |
| 113 | 161 | Developed Open Space to Palustrine Forested Wetland |
| 114 | 248 | Developed Open Space to Palustrine Scrub/Shrub Wetland |
| 115 | 246 | Developed Open Space to Palustrine Emergent Wetland |
| 116 | 5 | Developed Open Space to Estuarine Forested Wetland |
| 117 | 44 | Developed Open Space to Estuarine Scrub/Shrub Wetland |
| 118 | 447 | Developed Open Space to Estuarine Emergent Wetland |
| 138 | 888 | Cultivated to Palustrine Forested Wetland |
| 139 | 3336 | Cultivated to Palustrine Scrub/Shrub Wetland |
| 140 | 2244 | Cultivated to Palustrine Emergent Wetland |
| 141 | 1 | Cultivated to Estuarine Forested Wetland |
| 142 | 115 | Cultivated to Estuarine Scrub/Shrub Wetland |
| 143 | 2612 | Cultivated to Estuarine Emergent Wetland |
| 163 | 133 | Pasture/Hay to Palustrine Forested Wetland |
| 164 | 880 | Pasture/Hay to Palustrine Scrub/Shrub Wetland |
| 165 | 724 | Pasture/Hay to Palustrine Emergent Wetland |
| 167 | 299 | Pasture/Hay to Estuarine Scrub/Shrub Wetland |
| 168 | 3560 | Pasture/Hay to Estuarine Emergent Wetland |
| 188 | 304 | Grassland to Palustrine Forested Wetland |
| 189 | 324 | Grassland to Palustrine Scrub/Shrub Wetland |
| 190 | 304 | Grassland to Palustrine Emergent Wetland |
| 191 | 69 | Grassland to Estuarine Forested Wetland |
| 192 | 151 | Grassland to Estuarine Scrub/Shrub Wetland |
| 193 | 946 | Grassland to Estuarine Emergent Wetland |
| 213 | 304 | Deciduous Forest to Palustrine Forested Wetland |
| 214 | 184 | Deciduous Forest to Palustrine Scrub/Shrub Wetland |
| 215 | 137 | Deciduous Forest to Palustrine Emergent Wetland |
| 218 | 236 | Deciduous Forest to Estuarine Emergent Wetland |
| 238 | 453 | Evergreen Forest to Palustrine Forested Wetland |
| 239 | 256 | Evergreen Forest to Palustrine Scrub/Shrub Wetland |
| 240 | 179 | Evergreen Forest to Palustrine Emergent Wetland |
| 242 | 6 | Evergreen Forest to Estuarine Scrub/Shrub Wetland |
| 243 | 34 | Evergreen Forest to Estuarine Emergent Wetland |
| 263 | 122 | Mixed Forest to Palustrine Forested Wetland |
| 264 | 271 | Mixed Forest to Palustrine Scrub/Shrub Wetland |
| 265 | 141 | Mixed Forest to Palustrine Emergent Wetland |
| 267 | 11 | Mixed Forest to Estuarine Scrub/Shrub Wetland |
| 268 | 11 | Mixed Forest to Estuarine Emergent Wetland |
| 288 | 418 | Scrub/Shrub to Palustrine Forested Wetland |
| 289 | 229 | Scrub/Shrub to Palustrine Scrub/Shrub Wetland |
| 290 | 255 | Scrub/Shrub to Palustrine Emergent Wetland |
| 291 | 14 | Scrub/Shrub to Estuarine Forested Wetland |
| 292 | 139 | Scrub/Shrub to Estuarine Scrub/Shrub Wetland |
| 293 | 220 | Scrub/Shrub to Estuarine Emergent Wetland |
| 302 | 760 | Palustrine Forested Wetland to High Intensity Developed |
| 303 | 2507 | Palustrine Forested Wetland to Medium Intensity Developed |
| 304 | 3967 | Palustrine Forested Wetland to Low Intensity Developed |
| 305 | 3627 | Palustrine Forested Wetland to Developed Open Space |
| 306 | 554 | Palustrine Forested Wetland to Cultivated |
| 307 | 57 | Palustrine Forested Wetland to Pasture/Hay |
| 308 | 1561 | Palustrine Forested Wetland to Grassland |
| 309 | 1 | Palustrine Forested Wetland to Deciduous Forest |
| 310 | 19 | Palustrine Forested Wetland to Evergreen Forest |
| 311 | 6 | Palustrine Forested Wetland to Mixed Forest |
| 312 | 869 | Palustrine Forested Wetland to Scrub/Shrub |
| 313 | 13946313 | Palustrine Forested Wetland to Palustrine Forested Wetland |
| 314 | 136988 | Palustrine Forested Wetland to Palustrine Scrub/Shrub Wetland |
| 315 | 64948 | Palustrine Forested Wetland to Palustrine Emergent Wetland |
| 317 | 187 | Palustrine Forested Wetland to Estuarine Scrub/Shrub Wetland |
| 318 | 454 | Palustrine Forested Wetland to Estuarine Emergent Wetland |
| 319 | 180 | Palustrine Forested Wetland to Unconsolidated Shore |
| 320 | 7833 | Palustrine Forested Wetland to Bare Land |
| 321 | 6610 | Palustrine Forested Wetland to Water |
| 322 | 283 | Palustrine Forested Wetland to Palustrine Aquatic Bed |
| 323 | 1523 | Palustrine Forested Wetland to Estuarine Aquatic Bed |
| 327 | 209 | Palustrine Scrub/Shrub Wetland to High Intensity Developed |
| 328 | 634 | Palustrine Scrub/Shrub Wetland to Medium Intensity Developed |
| 329 | 1368 | Palustrine Scrub/Shrub Wetland to Low Intensity Developed |
| 330 | 1606 | Palustrine Scrub/Shrub Wetland to Developed Open Space |
| 331 | 174 | Palustrine Scrub/Shrub Wetland to Cultivated |
| 332 | 17 | Palustrine Scrub/Shrub Wetland to Pasture/Hay |
| 333 | 328 | Palustrine Scrub/Shrub Wetland to Grassland |
| 335 | 11 | Palustrine Scrub/Shrub Wetland to Evergreen Forest |
| 336 | 2 | Palustrine Scrub/Shrub Wetland to Mixed Forest |
| 337 | 6 | Palustrine Scrub/Shrub Wetland to Scrub/Shrub |
| 338 | 27239 | Palustrine Scrub/Shrub Wetland to Palustrine Forested Wetland |
| 339 | 2141166 | Palustrine Scrub/Shrub Wetland to Palustrine Scrub/Shrub Wetland |
| 340 | 30446 | Palustrine Scrub/Shrub Wetland to Palustrine Emergent Wetland |
| 342 | 30 | Palustrine Scrub/Shrub Wetland to Estuarine Scrub/Shrub Wetland |
| 343 | 87 | Palustrine Scrub/Shrub Wetland to Estuarine Emergent Wetland |
| 344 | 725 | Palustrine Scrub/Shrub Wetland to Unconsolidated Shore |
| 345 | 2101 | Palustrine Scrub/Shrub Wetland to Bare Land |
| 346 | 5915 | Palustrine Scrub/Shrub Wetland to Water |
| 347 | 68 | Palustrine Scrub/Shrub Wetland to Palustrine Aquatic Bed |
| 348 | 258 | Palustrine Scrub/Shrub Wetland to Estuarine Aquatic Bed |
| 352 | 809 | Palustrine Emergent Wetland to High Intensity Developed |
| 353 | 1857 | Palustrine Emergent Wetland to Medium Intensity Developed |
| 354 | 3181 | Palustrine Emergent Wetland to Low Intensity Developed |
| 355 | 3406 | Palustrine Emergent Wetland to Developed Open Space |
| 356 | 501 | Palustrine Emergent Wetland to Cultivated |
| 357 | 49 | Palustrine Emergent Wetland to Pasture/Hay |
| 358 | 87 | Palustrine Emergent Wetland to Grassland |
| 359 | 2 | Palustrine Emergent Wetland to Deciduous Forest |
| 360 | 16 | Palustrine Emergent Wetland to Evergreen Forest |
| 362 | 16 | Palustrine Emergent Wetland to Scrub/Shrub |
| 363 | 3898 | Palustrine Emergent Wetland to Palustrine Forested Wetland |
| 364 | 52675 | Palustrine Emergent Wetland to Palustrine Scrub/Shrub Wetland |
| 365 | 8220283 | Palustrine Emergent Wetland to Palustrine Emergent Wetland |
| 367 | 72 | Palustrine Emergent Wetland to Estuarine Scrub/Shrub Wetland |
| 368 | 573 | Palustrine Emergent Wetland to Estuarine Emergent Wetland |
| 369 | 5731 | Palustrine Emergent Wetland to Unconsolidated Shore |
| 370 | 10497 | Palustrine Emergent Wetland to Bare Land |
| 371 | 130138 | Palustrine Emergent Wetland to Water |
| 372 | 5231 | Palustrine Emergent Wetland to Palustrine Aquatic Bed |
| 373 | 339 | Palustrine Emergent Wetland to Estuarine Aquatic Bed |
| 377 | 119 | Estuarine Forested Wetland to High Intensity Developed |
| 378 | 371 | Estuarine Forested Wetland to Medium Intensity Developed |
| 379 | 676 | Estuarine Forested Wetland to Low Intensity Developed |
| 380 | 122 | Estuarine Forested Wetland to Developed Open Space |
| 383 | 107 | Estuarine Forested Wetland to Grassland |
| 385 | 12291 | Estuarine Forested Wetland to Evergreen Forest |
| 387 | 190 | Estuarine Forested Wetland to Scrub/Shrub |
| 389 | 1 | Estuarine Forested Wetland to Palustrine Scrub/Shrub Wetland |
| 390 | 2 | Estuarine Forested Wetland to Palustrine Emergent Wetland |
| 391 | 2201959 | Estuarine Forested Wetland to Estuarine Forested Wetland |
| 392 | 3736 | Estuarine Forested Wetland to Estuarine Scrub/Shrub Wetland |
| 393 | 14982 | Estuarine Forested Wetland to Estuarine Emergent Wetland |
| 394 | 6 | Estuarine Forested Wetland to Unconsolidated Shore |
| 395 | 322 | Estuarine Forested Wetland to Bare Land |
| 396 | 5888 | Estuarine Forested Wetland to Water |
| 398 | 8 | Estuarine Forested Wetland to Estuarine Aquatic Bed |
| 402 | 60 | Estuarine Scrub/Shrub Wetland to High Intensity Developed |
| 403 | 261 | Estuarine Scrub/Shrub Wetland to Medium Intensity Developed |
| 404 | 628 | Estuarine Scrub/Shrub Wetland to Low Intensity Developed |
| 405 | 517 | Estuarine Scrub/Shrub Wetland to Developed Open Space |
| 406 | 6 | Estuarine Scrub/Shrub Wetland to Cultivated |
| 407 | 1 | Estuarine Scrub/Shrub Wetland to Pasture/Hay |
| 408 | 46 | Estuarine Scrub/Shrub Wetland to Grassland |
| 410 | 139 | Estuarine Scrub/Shrub Wetland to Evergreen Forest |
| 412 | 23133 | Estuarine Scrub/Shrub Wetland to Scrub/Shrub |
| 413 | 16 | Estuarine Scrub/Shrub Wetland to Palustrine Forested Wetland |
| 414 | 7 | Estuarine Scrub/Shrub Wetland to Palustrine Scrub/Shrub Wetland |
| 415 | 6 | Estuarine Scrub/Shrub Wetland to Palustrine Emergent Wetland |
| 416 | 1852 | Estuarine Scrub/Shrub Wetland to Estuarine Forested Wetland |
| 417 | 1111724 | Estuarine Scrub/Shrub Wetland to Estuarine Scrub/Shrub Wetland |
| 418 | 7381 | Estuarine Scrub/Shrub Wetland to Estuarine Emergent Wetland |
| 419 | 310 | Estuarine Scrub/Shrub Wetland to Unconsolidated Shore |
| 420 | 726 | Estuarine Scrub/Shrub Wetland to Bare Land |
| 421 | 1624 | Estuarine Scrub/Shrub Wetland to Water |
| 423 | 62 | Estuarine Scrub/Shrub Wetland to Estuarine Aquatic Bed |
| 427 | 2006 | Estuarine Emergent Wetland to High Intensity Developed |
| 428 | 3893 | Estuarine Emergent Wetland to Medium Intensity Developed |
| 429 | 6362 | Estuarine Emergent Wetland to Low Intensity Developed |
| 430 | 6182 | Estuarine Emergent Wetland to Developed Open Space |
| 431 | 809 | Estuarine Emergent Wetland to Cultivated |
| 432 | 59 | Estuarine Emergent Wetland to Pasture/Hay |
| 433 | 1785 | Estuarine Emergent Wetland to Grassland |
| 434 | 19 | Estuarine Emergent Wetland to Deciduous Forest |
| 435 | 7298 | Estuarine Emergent Wetland to Evergreen Forest |
| 436 | 1 | Estuarine Emergent Wetland to Mixed Forest |
| 437 | 74 | Estuarine Emergent Wetland to Scrub/Shrub |
| 438 | 108 | Estuarine Emergent Wetland to Palustrine Forested Wetland |
| 439 | 161 | Estuarine Emergent Wetland to Palustrine Scrub/Shrub Wetland |
| 440 | 131 | Estuarine Emergent Wetland to Palustrine Emergent Wetland |
| 441 | 758 | Estuarine Emergent Wetland to Estuarine Forested Wetland |
| 442 | 4342 | Estuarine Emergent Wetland to Estuarine Scrub/Shrub Wetland |
| 443 | 21035881 | Estuarine Emergent Wetland to Estuarine Emergent Wetland |
| 444 | 31005 | Estuarine Emergent Wetland to Unconsolidated Shore |
| 445 | 13319 | Estuarine Emergent Wetland to Bare Land |
| 446 | 425773 | Estuarine Emergent Wetland to Water |
| 448 | 30082 | Estuarine Emergent Wetland to Estuarine Aquatic Bed |
| 463 | 705 | Unconsolidated Shore to Palustrine Forested Wetland |
| 464 | 773 | Unconsolidated Shore to Palustrine Scrub/Shrub Wetland |
| 465 | 18274 | Unconsolidated Shore to Palustrine Emergent Wetland |
| 466 | 4 | Unconsolidated Shore to Estuarine Forested Wetland |
| 467 | 93 | Unconsolidated Shore to Estuarine Scrub/Shrub Wetland |
| 468 | 20418 | Unconsolidated Shore to Estuarine Emergent Wetland |
| 488 | 187 | Bare Land to Palustrine Forested Wetland |
| 489 | 820 | Bare Land to Palustrine Scrub/Shrub Wetland |
| 490 | 2462 | Bare Land to Palustrine Emergent Wetland |
| 491 | 22 | Bare Land to Estuarine Forested Wetland |
| 492 | 745 | Bare Land to Estuarine Scrub/Shrub Wetland |
| 493 | 8574 | Bare Land to Estuarine Emergent Wetland |
| 513 | 1234 | Water to Palustrine Forested Wetland |
| 514 | 10407 | Water to Palustrine Scrub/Shrub Wetland |
| 515 | 104635 | Water to Palustrine Emergent Wetland |
| 517 | 622 | Water to Estuarine Scrub/Shrub Wetland |
| 518 | 81553 | Water to Estuarine Emergent Wetland |
| 538 | 1269 | Palustrine Aquatic Bed to Palustrine Forested Wetland |
| 539 | 1603 | Palustrine Aquatic Bed to Palustrine Scrub/Shrub Wetland |
| 540 | 8350 | Palustrine Aquatic Bed to Palustrine Emergent Wetland |
| 543 | 16 | Palustrine Aquatic Bed to Estuarine Emergent Wetland |
| 565 | 8 | Estuarine Aquatic Bed to Palustrine Emergent Wetland |
| 567 | 431 | Estuarine Aquatic Bed to Estuarine Scrub/Shrub Wetland |
| 568 | 5704 | Estuarine Aquatic Bed to Estuarine Emergent Wetland |
Table 3. Data fields in coastal_wetland_downscaled_carbon_fluxes_2006_to_2011.csv (and coastal_wetland_downscaled_carbon_fluxes_2006_to_2011.tif.vat.dbf). These files provide a lookup table for each of the 'Value' fields in coastal_wetland_downscaled_carbon_fluxes_2006_to_2011.tif. The first three columns are provided above in Table 2.
| Column name | Units | Description |
|---|---|---|
| Value | integer | value corresponding to land cover class or change type |
| Count | integer | pixel count for this product |
| class | character | Coastal Change Analysis Program (C-CAP) change class from 2006 to 2010/11 |
| class_2006 | character | C-CAP 2006 land cover class |
| class_2010 | character | C-CAP 2010/11 land cover class |
| mapped_med | pixel count | median mapped area |
| mapped_min | pixel count | 2.5% lower mapped area |
| mapped_max | pixel count | 97.5% upper mapped area |
| mapped_ci | pixel count | 2.5 to 97.5% mapped area confidence interval (CI) |
| estima_med | pixel count | median estimated area |
| estima_min | pixel count | 2.5% lower estimated area |
| estima_max | pixel count | 97.5% upper estimated area |
| estima_ci | pixel count | 2.5 to 97.5% estimated area CI |
| total_med | tonnes CO2e/year/pixel | median total flux |
| total_min | tonnes CO2e/year/pixel | 2.5% lower total flux |
| total_max | tonnes CO2e/year/pixel | 97.5% upper total flux |
| total_ci | tonnes CO2e/year/pixel | 2.5 to 97.5% total flux CI |
| soil_med | tonnes CO2e/year/pixel | median soil flux |
| soil_min | tonnes CO2e/year/pixel | 2.5% lower soil flux |
| soil_max | tonnes CO2e/year/pixel | 97.5% upper soil flux |
| soil_ci | tonnes CO2e/year/pixel | 2.5 to 97.5% soil flux CI |
| bmass_med | tonnes CO2e/year/pixel | median biomass flux |
| bmass_min | tonnes CO2e/year/pixel | 2.5% lower total flux |
| bmass_max | tonnes CO2e/year/pixel | 97.5% upper total flux |
| bmass_ci | tonnes CO2e/year/pixel | 2.5 to 97.5% biomass flux CI |
| ch4_med | tonnes CO2e/year/pixel | median methane flux |
| ch4_min | tonnes CO2e/year/pixel | 2.5% lower methane flux |
| ch4_max | tonnes CO2e/year/pixel | 97.5% upper methane flux |
| ch4_ci | tonnes CO2e/year/pixel | 2.5 to 97.5% methane flux CI |
Table 4. File attributes table for MHHW_NAVD88_gauges.zip.
|
Column name |
Units |
Description |
|---|---|---|
|
FID |
integer |
unique object identifier |
|
Shape |
character |
defines shape type |
|
Station_Na |
character |
station name |
|
STATION_ID |
integer |
station identifier |
|
Lat |
decimal degrees |
latitude |
|
Long |
decimal degrees |
longitude |
|
datum_peri |
MM/DD/YYYY |
date ranges of datum period |
|
navd88 |
meters |
NAVD88 relative to station datum |
|
mhhw |
meters |
MHHW relative to station datum |
|
mhhw_navd88 |
meters |
Mean Higher High Water Relative to North American Vertical Datum of 1988. |
|
error_in_m |
meters |
standard error of MHHW |
Table 5. File attributes table for MHHWS_MHHW_gauges.zip.
|
Column name |
Units |
Description |
|---|---|---|
|
FID |
integer |
unique object identifier |
|
Shape |
character |
defines shape type |
|
Station_Na |
character |
station name |
|
STATION_ID |
integer |
station identifier |
|
Lat |
decimal degrees |
latitude |
|
Long |
decimal degrees |
longitude |
|
datum_peri |
MM/DD/YYYY |
date ranges of datum period |
|
mhhws_offs |
meter |
MHHWS relative to MHHW |
|
mhhws_sd |
meter |
standard deviation of MHHWS observations |
|
mhhws_n |
integer |
count of MHHWS instances |
|
mhhws_se |
meter |
estimated standard error of MHHWS |
Companion Files
A1_Supplemental_Information.pdf provides methods for creating a probabilistic mean higher high water spring (MHHWS) elevation map and methods on mapping total and sector level fluxes.
A2_Supplemental_Table_1.csv provides source information for the NOAA sea-level rise digital elevation models (NOAA 2016) that were used to create a probabilistic coastal lands map.
coastal_wetland_downscaled_carbon_fluxes_2006_to_2011.tif.vat.dbf is an ESRI file format that will assign colors and labels to the values of coastal_wetland_downscaled_carbon_fluxes_2006_to_2011.tif when the Unique Values Symbology is activated in ArcMap. This file is intended to allow users to choose which of the columns described in Table 3 is displayed across the pixels.
MHHW_NAV88_gauges.kmz and MHHWS_MHHW_gauges.kmz provide the same data as the corresponding shapefiles, but in kmz format for visualization in Google Earth.
Application and Derivation
Coastal wetlands store carbon dioxide (CO2) and emit CO2 and methane making them an important part of greenhouse gas inventorying. It is important to assess uncertainty in this developing carbon monitoring system in order to both quantify confidence in the inventory process itself and to prioritize future research opportunities.This dataset improves uncertainty estimates for greenhouse gas inventories at the national scale.
Quality Assessment
These data are the result of a propagated uncertainty analysis in a version of the 2017 U.S. coastal wetland greenhouse gas inventory (EPA 2017). The tidal datum transformations contain associated datasets showing uncertainty in the datum extrapolated between tide gauges and uncertainty inherent in the extrapolation process. The tidal elevation map is a probabilistic representation of the likelihood of a pixel falling below the mean higher high water spring (MHHWS) tide line, given the uncertainty in elevation mapping, and multiple datum transformations. The flux map median and confidence intervals for mapped area, estimated area, soil, biomass, methane, and total CO2 equivalent were all estimated from 10,000 iterations of a Monte Carlo analysis.
Data Acquisition, Materials, and Methods
This data release is a supplement to a paper by Holmquist et al. (2018). In that paper the analysis merged tide gauge data and coastal digital elevation maps with the Coastal Change Analysis Program in order to map the extent of the coastal zone, as well as the area of wetland types and conversion events. Maps were merged with burial and emissions datasets, and uncertainty was estimated by simulating 10,000 Monte Carlo iterations of the inventory.
Code used in generating these analyses is available at https://github.com/Smithsonian/Coastal-Wetland-NGGI-Sensitivity-Analysis.
Coastal Wetland Carbon Fluxes
Total greenhouse gas emissions and removals (i.e., carbon flux) from coastal wetlands were quantified by mapping the estimated area of different classes of stable wetlands and land cover change events (while taking into account potential errors in change detection), then multiplying the estimated land areas by the summed fluxes of soil, biomass, and methane from 2006 to 2011.
Land area was quantified using the Coastal Change Analysis Program (C-CAP), which is a Landsat-based land cover mapping product with 23 land cover classes, including six types of intertidal wetlands defined by two types of salinity (palustrine and estuarine) and three types of vegetation (emergent, scrub/shrub, and forested). Two hundred-forty different land cover types were mapped from 2006 to 2011, including classes of stable wetlands and land cover change events.
Emissions factors for soils and methane were based on literature review and synthesis. When estimating soil flux over the estimated area, if the land cover type did not change or changed but did not result in soil loss, then soil carbon flux was estimated as the annual soil carbon burial rate multiplied by the number of years that wetlands were present. If the 2006 to 2011 class changed and represented a soil loss event, then emissions from soil flux were estimated to be the product of mean soil carbon density, depth lost, and the fraction of that returns to the atmosphere. Methane flux for a class was calculated from methane emissions associated with two salinity types measured in 2006 and 2011. Emissions factors for biomass came from a remote sensing calibration and validation effort and a literature review that is part of continued inventory development. Biomass flux was estimated from transitions between three vegetation types (forested, scrub/shrub, and emergent vegetation) or from vegetated to unvegetated surfaces between 2006 and 2011.
Tide Elevation
Coastal wetland surface elevation data were derived from digital elevation models (DEMs) created using Light Detection and Ranging (LiDAR) and aggregated for the Sea-Level Rise Viewer (NOAA 2016). All DEMs were relative to the NAVD88 datum. See the companion files for details on datum transformations. A map of Mean Higher High Water Spring (MHHWS) heights was created using empirical Bayesian kriging to interpolate between the NOAA tide gauges, and a corresponding uncertainty map was created by incorporating random error in LiDAR mapping, datum transformations, and distance between tide gauges. The DEMs, the MHHWS map, and the associated uncertainty surfaces were combined into a single spatial layer representing the probability of elevation being below MHHWS.
Data Center Processing
Submitted data files were restructured by staff at the ORNL DAAC and several were transformed from .img to .tif format for long-term archival. The data file coastal_wetland_downscaled_carbon_fluxes_2006_to_2011.csv was created by ORNL DAAC staff from the .dbf file.
Data Access
These data are available through the Oak Ridge National Laboratory (ORNL) Distributed Active Archive Center (DAAC).
Coastal Wetland Elevation and Carbon Flux Inventory with Uncertainty, USA, 2006-2011
Contact for Data Center Access Information:
- E-mail: uso@daac.ornl.gov
- Telephone: +1 (865) 241-3952
References
EPA 2017 Inventory of US Greenhouse Gas Emissions and Sinks 1990-2015. https://www.epa.gov/ghgemissions/inventory-us-greenhouse-gas-emissions-and-sinks
Holmquist, J.R., Windham-Myers, L., Bernal, B., Byrd, K.B., Crooks, S., Gonneea, M.E., Herold, N., Knox, S.H., Kroeger, K.D., McCombs, J. and Megonigal, J.P., 2018. Uncertainty in United States coastal wetland greenhouse gas inventorying. Environmental Research Letters, 13(11), p.115005. https://doi.org/10.1088/1748-9326/aae157
NOAA 2016 Sea-level rise data. Digital elevation model available online: https://coast.noaa.gov/slrdata/