Documentation Revision Date: 2025-09-08
Dataset Version: 2
Summary
There are 20 data files in GeoTIFF (.tif) format in this dataset that provide percent tree cover for Mexico at 30-m resolution for the years from 2000 to 2019.
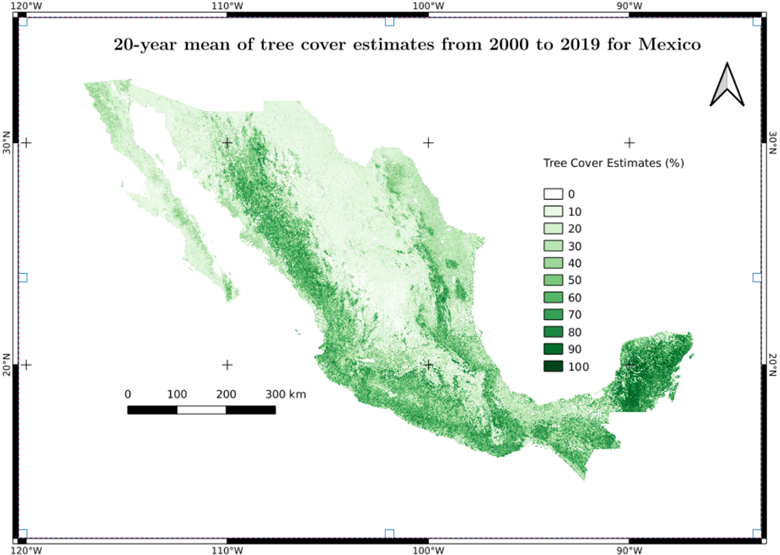
Figure 1. 20-year mean of percent tree cover for Mexico from 2000 to 2019.
Citation
Tran, K.H., M. Sarupria, R. Vargas, I.G. Brosnan, and T. Park. 2025. CMS: Tree Cover Estimates at 30 m Resolution for Mexico from 2000 to 2019. ORNL DAAC, Oak Ridge, Tennessee, USA. https://doi.org/10.3334/ORNLDAAC/2445
Table of Contents
- Dataset Overview
- Data Characteristics
- Application and Derivation
- Quality Assessment
- Data Acquisition, Materials, and Methods
- Data Access
- References
- Dataset Revisions
Dataset Overview
This dataset provides 20-year tree cover estimates at 30-m spatial resolution for Mexico from 2000 to 2019. The CMS-TC product was generated through the integration of machine learning and multi-scale remote sensing data. The Continuous Change Detection and Classification (CCDC) algorithm was first applied to create synthetic Landsat surface reflectance time series at 30-m spatial resolution (Zhu and Woodcock, 2014). High-resolution canopy height model data at 1-m spatial resolution from NASA’s Goddard LiDAR, Hyperspectral, and Thermal (G-LiHT) mission across Mexico in 2013 was spatially aligned with Landsat pixel grid to define sub-pixel TC labels using a threshold of 3-m height. The CCDC-derived Landsat time series and their corresponding G-LiHT-based tree cover labels were used to train a random forest regressor model. The model showed a robust predictive performance, achieving an overall coefficient of determination (R²) of 0.81 and an RMSE of 11.90%. The trained model with top important features was then used to predict CMS-TC across the entire Mexico for all the years from 2000 to 2019. The CMS-TC product supports not only tree cover change monitoring but also enhances carbon accounting, tracks deforestation and agricultural expansion, aids biodiversity conservation, and informs climate, hydrological, and land use policy development.
Project: Carbon Monitoring System
The NASA Carbon Monitoring System (CMS) program is designed to make significant contributions in characterizing, quantifying, understanding, and predicting the evolution of global carbon sources and sinks through improved monitoring of carbon stocks and fluxes. The System uses NASA satellite observations and modeling/analysis capabilities to establish the accuracy, quantitative uncertainties, and utility of products for supporting national and international policy, regulatory, and management activities. CMS data products are designed to inform near-term policy development and planning.
Related Dataset
Park, T., and R. Vargas. 2022. Tree Cover Estimates at 30 m Resolution for Mexico, 2016-2018. ORNL DAAC, Oak Ridge, Tennessee, USA. https://doi.org/10.3334/ORNLDAAC/2137
- Version 1 of this dataset
Related Publication
Tran, H.K., M. Sarupria, R. Vargas, I.G. Brosnan, and T. Park. 2025. Integrating airborne Lidar, Landsat time series, and machine learning for national-scale tree cover estimation across Mexico. In progress.
Data Characteristics
Spatial Coverage: Mexico
Spatial Resolution: 0.0002695 degrees (~30 m)
Temporal Coverage: 2000 to 2019
Temporal Resolution: Annual
Study Area: Latitude and longitude are given in decimal degrees.
| Site | Westernmost Longitude | Easternmost Longitude | Northernmost Latitude | Southernmost Latitude |
|---|---|---|---|---|
| Mexico | -119.226 | -84.625 | 33.797 | 13.406 |
Data File Information
There are 20 data files in GeoTIFF (.tif) format that provide percent tree cover for Mexico at 30-m resolution for the years from 2000 to 2019.
The file naming convention is CMS_TC_Mexico_30m_<YYYY>.tif, where
<YYYY> indicates the year of TC estimates from 2000 to 2019.
Example file name: CMS_TC_Mexico_30m_2000.tif
GeoTIFF characteristics:
- Coordinate system: Mexico ITRF2008 / LCC (EPSG:6372); GRS80 datum; units = m
- Pixel values: percent cover; valid Range: 0 - 100
- Bands: 1
- No data value: 255
- Data type: Byte
Application and Derivation
The CMS-TC has various applications, such as tracking tree cover changes, improving estimates of the global carbon budget, monitoring deforestation and afforestation, detecting agriculture expansion, biodiversity conservation, climate and hydrological modeling, and the development of sustainable land use and environmental policies.
Quality Assessment
The proposed model was evaluated using 8,000 independent percent tree cover samples across Mexico derived from the G-LiHT airborne LiDAR data. A grid search strategy was employed to optimize hyperparameters for the machine learning model, including the number of trees, maximum tree depth, minimum samples required to split a node, and minimum samples required at a leaf node. This systematic tuning aimed to reduce prediction error. A 5-fold cross-validation scheme was also used during the search, with negative mean squared error as the scoring metric, to identify the best parameter combination. Overall, the statistical evaluation confirmed that the machine learning model, driven by Landsat time series and G-LiHT LiDAR data, provided accurate predictions of percent tree cover for Mexico. The best model had a coefficient of determination (R²) of 0.81 and an RMSE of 11.90%. Note that biases can be present in the areas of very low and very high percent tree covers (Figure 2).
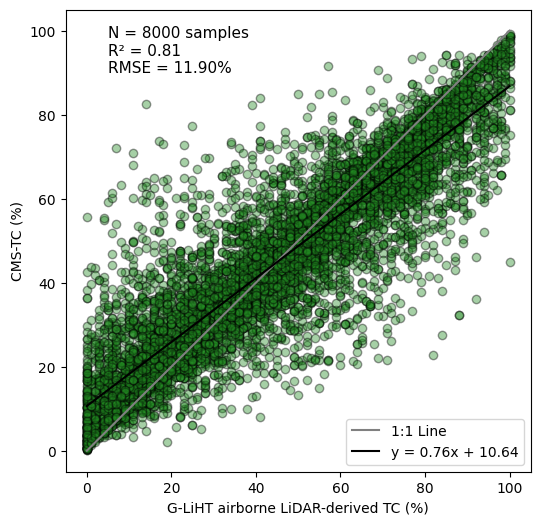
Figure 2. Overall accuracy of the CMS-TC product. The gray line indicates the 1:1 agreement.
Data Acquisition, Materials, and Methods
Data Acquisition
This study utilized three primary input datasets. First, all available Landsat Collection 2 Level-2 surface reflectance and thermal data from Landsat 4, 5, 7, and 8 (including bands for blue, green, red, near-infrared (NIR), shortwave infrared 1 and 2 (SWIR1, SWIR2), and thermal (TEMP) were accessed via Google Earth Engine (GEE), spanning the period from 1999 to 2020. These spectral and thermal bands were used as input features to capture vegetation structure, moisture content, and phenological dynamics relevant to tree cover. Second, NASA’s Shuttle Radar Topography Mission (SRTM) data were incorporated to account for environmental heterogeneity influencing vegetation distribution, particularly elevation and derived topographic features (e.g., slope, aspect) were included as predictors because they play a critical role in shaping local tree cover patterns. The third input dataset was canopy height model (CHM) data from NASA’s G-LiHT airborne imager, which provides high-resolution (∼1 m) measurements of vegetation structure. The CHM data from 2013 across Mexico served as the basis for deriving tree cover training labels in this study.
Data preparation
The Continuous Change Detection and Classification (CCDC) algorithm, developed by Zhu and Woodcock (2014), was applied to all available surface reflectance and thermal Landsat data in Google Earth Engine (GEE) to generate synthetic, consistent, and continuous time series at 30-m spatial resolution, with one composite per month. In addition to the original Landsat bands (blue, green, red, NIR, SWIR1, SWIR2, and thermal), seven vegetation and spectral indices were calculated from the synthetic time series: the Normalized Difference Vegetation Index (NDVI), Enhanced Vegetation Index (EVI), Enhanced Vegetation Index 2 (EVI2), Normalized Burn Ratio (NBR), and the Tasseled Cap indices of Brightness, Greenness, and Wetness. These indices were included to provide a comprehensive representation of land cover dynamics, vegetation health, and surface conditions for improved tree cover estimation (Yang et al. 2012). As a result, 14 Landsat-derived features were generated per month, totaling 168 features across 12 months. To further enhance model performance, three topographic variables derived from NASA’s SRTM (DEM, slope, and aspect; Yang et al. 2011) were included as static input features. This resulted in a total of 171 input features (14 features × 12 months + 3 SRTM features) used to train the tree cover prediction model.
To generate tree cover training labels, the G-LiHT canopy height model (CHM) data (Bruce, 2021) from 2013 were spatially aligned with the Landsat grid. For each 30-m Landsat pixel, the proportion of 1-m CHM pixels were computed exceeding 3 m in height, which was used to define percent tree cover. A total of 40,000 stratified samples from 2013, each associated with CCDC-derived Landsat time series, SRTM topographic variables, and G-LiHT-derived tree cover labels, were used to train a random forest regressor model (Segal, 2004).
Machine learning model development
A machine learning based model was developed that used the random forest regressor to predict the percent tree cover across Mexico. A grid search methodology for hyperparameter optimization was implemented to train the model. The parameter grid encompassed the number of trees (`n_estimators`: 100, 200, 300), maximum tree depth (`max_depth`: none, 10, 20, 30), minimum samples required to split a node (`min_samples_split`: 2, 5, 10), and minimum samples required at a leaf node (`min_samples_leaf`: 1, 2, 4). This systematic variation of hyperparameters aimed to minimize prediction error. A 5-fold cross-validation approach was also utilized during the grid search process, with the negative mean squared error (`neg_mean_squared_error`) serving as the scoring metric for optimal hyperparameter selection.
Following the identification of the best parameters, the model was trained on the 80% selected samples and independently tested on the remaining 20% selected samples. The best parameters are n_estimators = 300, max_depth = 30, min_samples_split = 2, min_samples_leaf = 2. This framework resulted in a well-calibrated and fine-tuned model, ready for accurate percent tree cover predictions. Further, the top 25 important features were identified after assessing variable importance for the best model, including Green_Sep, NDVI_Jan, DEM, NDVI_Feb, SWIR2_Aug, BRIGHTNESS_Apr, TEMP_Oct, GREENNESS_Jun, NBR_Apr, slope, aspect, TEMP_Apr, NBR_Jul, NBR_Aug, NDVI_Aug, NBR_Feb, TEMP_Aug, TEMP_Mar, NBR_Mar, NBR_Jun, TEMP_Sep,TEMP_Nov, NBR_May, TEMP_Jan, TEMP_Dec (Figure 3). These 25 features were used to evaluate the impact of reducing input features on model performance using RMSE and R2, which showed slight changes compared to the use of all 171 input features.
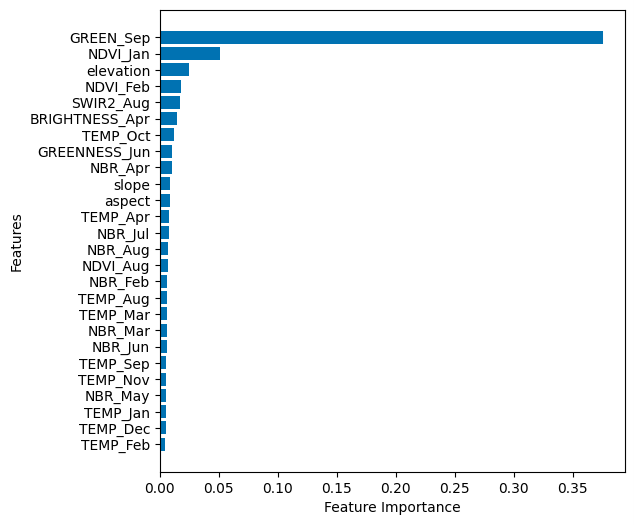
Figure 3. Top 25 important features contributing to the prediction of percent tree cover across Mexico.
Generation of the CMS-TC product:
The reduced model was then applied to the CCDC-derived Landsat time series to predict the CMS-TC for all 20 years from 2000 to 2019.
Data Access
These data are available through the Oak Ridge National Laboratory (ORNL) Distributed Active Archive Center (DAAC).
CMS: Tree Cover Estimates at 30 m Resolution for Mexico from 2000 to 2019
Contact for Data Center Access Information:
- E-mail: uso@daac.ornl.gov
- Telephone: +1 (865) 241-3952
References
Bruce, C. 2021. G-LiHT Lidar Point Cloud V001. NASA Land Processes Distributed Active Archive Center; Sioux Falls, South Dakota. https://doi.org/10.5067/Community/GLIHT/GLLIDARPC.001
Segal, M.R., 2004. Machine learning benchmarks and random forest regression. Center for Bioinformatics and Molecular Biostatistics; University of California, San Francisco, California. https://escholarship.org/uc/item/35x3v9t4
Tran, H.K., M. Sarupria, R. Vargas, I.G. Brosnan, and T. Park. 2025. Integrating airborne Lidar, Landsat time series, and machine learning for national-scale tree cover estimation across Mexico. In progress.
Yang, L., Meng, X. and Zhang, X., 2011. SRTM DEM and its application advances. International Journal of Remote Sensing 32:3875-3896. https://doi.org/10.1080/01431161003786016
Yang, J., Weisberg, P.J. and Bristow, N.A., 2012. Landsat remote sensing approaches for monitoring long-term tree cover dynamics in semi-arid woodlands: Comparison of vegetation indices and spectral mixture analysis. Remote Sensing of Environment 119:62-71. https://doi-org.ornl.idm.oclc.org/10.1016/j.rse.2011.12.004
Zhu, Z. and Woodcock, C.E., 2014. Continuous change detection and classification of land cover using all available Landsat data. Remote Sensing of Environment 144:152-171. https://doi-org.ornl.idm.oclc.org/10.1016/j.rse.2014.01.011
Dataset Revisions
| Version | Release Date | Revision Notes |
|---|---|---|
| 2 | 2025-09-08 | This is the updated version using additional input data source and enhanced machine learning approach. The data covers the period 2000-2019. |
| 1 | 2023-02-15 | Version 1 release (https://doi.org/10.3334/ORNLDAAC/2137). |