Documentation Revision Date: 2023-02-15
Dataset Version: 1
Summary
There are three data files in cloud-optimized GeoTiff (.tif) format with this dataset.
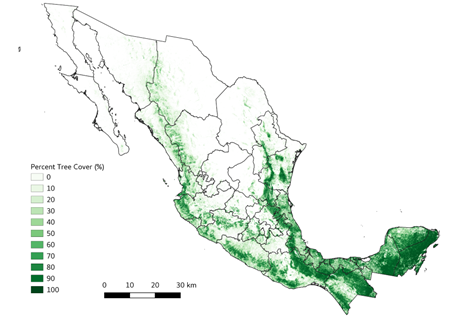
Figure 1. Multi-year mean (2016-2018) of percent tree cover maps for Mexico.
Citation
Park, T., and R. Vargas. 2022. Tree Cover Estimates at 30 m Resolution for Mexico, 2016-2018. ORNL DAAC, Oak Ridge, Tennessee, USA. https://doi.org/10.3334/ORNLDAAC/2137
Table of Contents
- Dataset Overview
- Data Characteristics
- Application and Derivation
- Quality Assessment
- Data Acquisition, Materials, and Methods
- Data Access
- References
Dataset Overview
The data set provides multi-year (2016-2018) percent tree cover (TC) estimates for entire Mexico at 30 m spatial resolution. The TC data (hereafter, NEX-TC) was derived from the 30 m Landsat Collection 1 product and a hierarchical deep learning approach (U-Net) developed in a previous CMS effort for the conterminous United States (CONUS) (Park et al., 2022). The hierarchical U-Net framework first developed a U-Net model for very high-resolution aerial images (NAIP) using training labels derived from previous work based on an interactive image segmentation tool and iterative updates with expert knowledge (Basu et al., 2015). The developed NAIP U-Net model and NAIP data produced 1-m NAIP TC across all lower 48 CONUS states. A Landsat U-Net model was developed for multi-year and large-scale TC mapping based on the very high-resolution NAIP TC made in the earlier stage. The Landsat U-Net model developed was adopted over the CONUS for testing its transferability, validation, and improvement across Mexico. This dataset provides national-scale percent tree cover estimates over Mexico and can be helpful for studies of carbon cycling, land cover and land use change, etc. The team has been working on improving temporal stability of the product and will update the product once the next version is ready to be shared.
Project: Carbon Monitoring System
The NASA Carbon Monitoring System (CMS) program is designed to make significant contributions in characterizing, quantifying, understanding, and predicting the evolution of global carbon sources and sinks through improved monitoring of carbon stocks and fluxes. The System uses NASA satellite observations and modeling/analysis capabilities to establish the accuracy, quantitative uncertainties, and utility of products for supporting national and international policy, regulatory, and management activities. CMS data products are designed to inform near-term policy development and planning.
Related Publication
Park, T., T. Vandal, S. Li, S. Kalia, A. Michaelis, R. Vargas, Y. Yu, S. Saatchi, S. Ganguly, and R.R. Nemani. 2022. Generation of large-scale percent tree cover products using deep-learning and multi-scale remote sensing data. In progress.
Acknowledgement
This study was supported by the NASA Carbon Monitoring System, grant number 80NSSC18K0173-CMS.
Data Characteristics
Spatial Coverage: Mexico
Spatial Resolution: 0.0002695 degrees (~30 m)
Temporal Coverage: 2016-01-01 to 2018-12-31
Temporal Resolution: Annual
Study Area: Latitude and longitude are given in decimal degrees.
|
Site |
Westernmost Longitude |
Easternmost Longitude |
Northernmost Latitude |
Southernmost Latitude |
|
Mexico |
-118.404 |
-86.701 |
32.719 |
14.55 |
Data File Information
There are three data files in cloud-optimized GeoTIFF (.tif) format with this dataset. The files provide percent tree cover for Mexico at 30-m resolution for the years 2016, 2017, and 2018:
Mexico_Tree_Cover_30m_2016.tif
Mexico_Tree_Cover_30m_2017.tif
Mexico_Tree_Cover_30m_2018.tif
Data Information:
- Projection Information: EPSG: 4326, Datum: WGS 1984
- Data Type: Int16 - Sixteen bit signed integer
- Valid Range: 0 - 10000
- Scaling factor: 0.01
- Offset: 0
- Unit: %
- Map units: Degrees
- No data value: -9999
Application and Derivation
This dataset provides national-scale percent tree cover estimates over Mexico and can be helpful for studies of carbon cycling, land cover and land use change, etc. (e.g., Yu et al., 2022).
Quality Assessment
Three independent quality assessment efforts described below were conducted using high-resolution lidar-TC, other moderate-resolution TC, and ground-measured TC. Note that the first and second assessments were performed based on lidar-TC and moderate-resolution TC datasets over the CONUS due to data availability in Mexico.
Assessment 1 - comparison to lidar-derived TC:
First, with NASA’s previous CMS effort, the lidar-based TC was generated by combining both NAIP and lidar, and this dataset provides high-resolution (1-m) TC for states in the Northeast USA (Pennsylvania, Delaware, and Maryland) (Dubayah et al., 2018). Another CMS-supported and lidar-based TC (1 m) data over Sonoma County, CA was also used in this assessment (Dubayah et al., 2017). The analysis pointed out that the TC-TC overall was negatively biased by 10.5 % compared to the lidar-TC: slight overestimation (mean difference = 12.9 %, median difference = 4.9 %) at the sparse tree-covered regions (0~20%) while underestimation (mean difference = -12.6 %, median difference = -10.2%) at the densely tree covered regions (80~100 %). A linear regression comparing the NEX-TC (N = 17,276) against lidar-TC gives R2 values of 0.83. This strong linearity indicates possible potential calibration based on the assessed regression model. We additionally investigated how the observed differences vary across land cover types. The analysis showed that the TC product underestimates TC over all land cover types compared to the lidar-TC.
Assessment 2 - intercomparison to existing NLCD and MODIS TCs:
NLCD Percent Tree Cover was also used (hereafter NLCD-TC, https://www.mrlc.gov/data), which provides free, easily accessible percentage tree cover values at the native 30-m spatial resolution for CONUS (Homer et al., 2015). The latest version of the Terra MODIS Collection 6 vegetation continuous field (VCF) is additionally used in this evaluation (Dimiceli et al., 2015). At the CONUS scale, Landsat-class TCs from this effort and NLCD are generally comparable, but MODIS TC tends to significantly underestimate the percent tree cover across all land cover classes, especially forested lands where dense tree cover exists. The difference between NEX-TC and MODIS-TC in forested landscapes is ~8 to 17 %. Compared to the NLCD-TC, NEX-TC gives higher TC (1% and 8 % for open and highly developed regions, respectively) over the developed environment, and this discrepancy can be explained by the difference observed in comparison with lidar-based percent tree cover. Over the developed regions, the MODIS-TC estimation is significantly lower than NLCD-TC and NEX-TC by ~5 % and 11 %, respectively. Overall, results indicate that NEX- and NLCD-TC estimate a similar total tree-covered area of the CONUS (marginal difference, 0.5 %), but the MODIS-TC estimate is smaller by about 22-23 % compared to both Landsat-based TCs. The observed discrepancies between different TC products lead to biased mean TC and total tree-covered area of counties over the CONUS. Note that the MODIS-TC data shows a profound negative bias in forested lands (<-20%) compared to the lidar-TC, while NLCD- and NEX-TC underestimate by ~ 12 % and 10 %, respectively.
Assessment 3 - comparison to ground-measured TC:
The TC was also evaluated over Mexico using ground-measured TC metrics from Inventario Nacional Forestal y de Suelos (INFyS) data and Paz (Braden et al., 2022). The assessment shows that the NEX-TC has generally higher agreements (>90%) with the ground observations over tropical moist forests and tropical rain forests while having lower agreements over drier environments (<30%).
The team has been working on improving temporal stability of the product and will update the product once the next version is ready to be shared.
Data Acquisition, Materials, and Methods
High-resolution tree cover data from NAIP
Recent advances in deep neural networks have produced highly accurate methods for semantic segmentation of spatial data, including high-dimensional images, by learning high-dimensional data representation. The U-Net architecture was applied which has shown high prediction accuracy in a number of semantic segmentation tasks. It is structured around convolutional filters and degrading the imagery to different resolutions, allowing the detection of structures and textures at different scales. The implementation includes four downsampling blocks with 2 x 2 max-pooling operations followed by four upsampling convolution transpose layers and concatenation of skip connection. Each block includes two convolutional layers and rectified linear unit (ReLU) activations. The output layer includes a softmax activation to return results between 0 and 1. A binary cross-entropy loss function is minimized with stochastic gradient descent and a learning rate of 0.01. For the learning phase, training labels derived from previous work were used based on an interactive image segmentation tool and iterative updates with expert knowledge (Basu et al., 2015). Labeled images (total = 1,508, 512 x 512) were used to train the U-Net model, which was then used to produce 1 m NAIP TC.
Landsat surface reflectances
Surface reflectance in the red, near-infrared, and shortwave infrared bands from Landsat-5 and Landsat-8 were used in this effort. All Landsat scenes were processed in the following order: (1) filtered for cloud, cloud shadow, and snow effects; (2) filtered for radiometric saturation; (3) valid pixels remaining after filtering, and between acquisition dates of May-1 and Oct-31 were used to produce an average reflectance value representing the growing season of a given year. The reflectance levels between Landsat scenes were calibrated with each other using MODIS surface reflectance from Aqua (Collection 6 MYD09GA) of the corresponding wavelengths (bands 1, 2, 6, and 7) for the same time frame to minimize inconsistency in different Landsat sensors, through the use of focal-mean with a radius of 2.5 km.
Generation of national-scale TC using deep learning and Landsat data
TC images produced from NAIP-1m were used to build labels for training the larger-scale, coarser resolution Landsat model. The 1-m pixels from NAIP were aggregated to percentages at the 30-m Landsat scale as labels. A patch size of 560 by 560 pixels with all four bands of Landsat imagery was used for training an identical U-Net model as described above. The whole set of paired image patches and labels (total = 2,441 pairs) was given to the U-Net model, iterating over the dataset 1,000 times. A mean square error loss was used to preserve TC percentages. In addition, 245 independent testing Landsat patches and labels were prepared from NAIP for evaluating the performance of the Landsat U-Net model. The trained model was then applied to full Landsat images to create the NEX-TC estimates.
Refer to Park et al. (2022, In Process) for details.
Data Access
These data are available through the Oak Ridge National Laboratory (ORNL) Distributed Active Archive Center (DAAC).
Tree Cover Estimates at 30 m Resolution for Mexico, 2016-2018
Contact for Data Center Access Information:
- E-mail: uso@daac.ornl.gov
- Telephone: +1 (865) 241-3952
References
Braden, D., P. Mondal, T. Park, R. Vargas. 2022. Quantifying uncertainty of forest extent estimates in Mexico by comparing satellite-derived land and tree cover products. In progress.
Basu, S., S. Ganguly, R.R. Nemani, S. Mukhopadhyay, Gong Zhang, C. Milesi, A. Michaelis, P. Votava, R. Dubayah, L. Duncanson, B. Cook, Yifan Yu, S. Saatchi, R. DiBiano, M. Karki, E. Boyda, U. Kumar, and Shuang Li. 2015. A semiautomated probabilistic framework for tree-cover delineation from 1-m NAIP imagery using a high-performance computing architecture. IEEE Transactions on Geoscience and Remote Sensing 53:5690–5708. https://doi.org/10.1109/TGRS.2015.2428197
Dimiceli, C., M. Carroll, R. Sohlberg, D.H. Kim, M. Kelly, and J.R.G. Townshend. 2015. MOD44B MODIS/Terra vegetation continuous fields yearly L3 global 250 m SIN grid V006. NASA EOSDIS Land Processes Distributed Active Archive Center 10. https://doi.org/10.5067/MODIS/MOD44B.006
Dubayah, R.O., A. Swatantran, W. Huang, L. Duncanson, K. Johnson, H. Tang, J. O'Neil-Dunne, and G.C. Hurtt. 2018. LiDAR Derived Biomass, Canopy Height and Cover for Tri-State (MD, PA, DE) Region, V2. ORNL DAAC, Oak Ridge, Tennessee, USA. https://doi.org/10.3334/ORNLDAAC/1538
Dubayah, R.O., A. Swatantran, W. Huang, L. Duncanson, H. Tang, H., K. Johnson, J.O. Dunne, and G.C. Hurtt. 2017. CMS: LiDAR-derived Biomass, Canopy Height and Cover, Sonoma County, California, 2013. ORNL DAAC, Oak Ridge, Tennessee, USA. https://doi.org/10.3334/ORNLDAAC/1523
Homer, C., J. Dewitz, L. Yang, S. Jin, P. Danielson, G. Xian, J. Coulston, N. Herold, J. Wickham, and K. Megown, K. 2015. Completion of the 2011 National Land Cover Database for the conterminous United States--representing a decade of land cover change information. Photogrammetric Engineering & Remote Sensing 81:345–354.
Park, T., T. Vandal, S. Li, S. Kalia, A. Michaelis, R. Vargas, Y. Yu, S. Saatchi, S. Ganguly, and R.R. Nemani. 2022. Generation of large-scale percent tree cover products using deep-learning and multi-scale remote sensing data. In progress.