Documentation Revision Date: 2019-01-17
Data Set Version: 1
Summary
There are seven files of carbon stock maps in GeoTIFF (.tif) format and one file in comma-separated (.csv) format of uncertainty comparisons with this dataset.
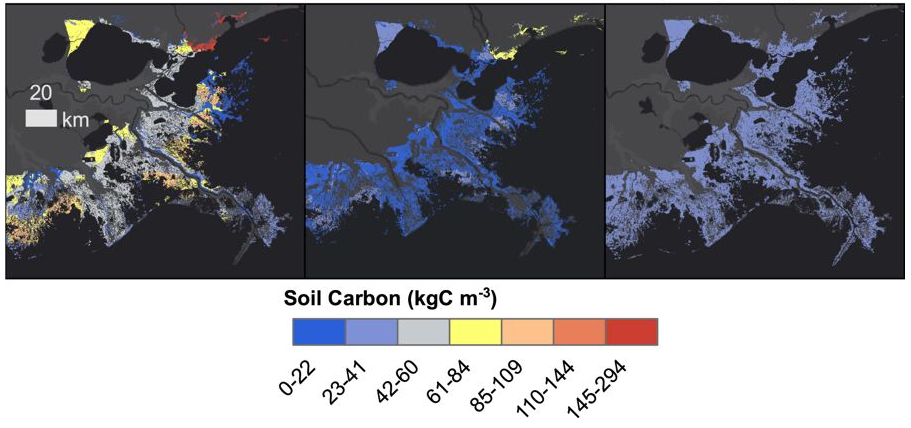
Figure 1. Results of three alternative carbon stock estimation approaches for the Louisiana Delta region: Left, using SSURGO data as independent soils data; Middle, using the SSURGO data after bulk density data were bias-corrected; Right, using the empirical average from the compiled soils dataset of 27 kg C /m3 (Holmquist et al., 2018).
Citation
Holmquist, J.R., L. Windham-Myers, N. Bliss, S. Crooks, J.T. Morris, P.J. Megonigal, T. Troxler, D. Weller, J. Callaway, J. Drexler, M.C. Ferner, M.E. Gonneea, K. Kroeger, L. Schile-beers, I. Woo, K. Buffington, B.M. Boyd, J. Breithaupt, L.N. Brown, N. Dix, L. Hice, B.P. Horton, G.M. Macdonald, R.P. Moyer, W. Reay, T. Shaw, E. Smith, J.M. Smoak, C. Sommerfield, K. Thorne, D. Velinsky, E. Watson, K. Grimes, and M. Woodrey. 2019. Tidal Wetland Soil Carbon Stocks for the Conterminous United States, 2006-2010. ORNL DAAC, Oak Ridge, Tennessee, USA. https://doi.org/10.3334/ORNLDAAC/1612
Table of Contents
- Data Set Overview
- Data Characteristics
- Application and Derivation
- Quality Assessment
- Data Acquisition, Materials, and Methods
- Data Access
- References
Data Set Overview
This dataset provides modeled estimates of soil carbon stocks for tidal wetland areas of the Conterminous United States (CONUS) for the period 2006-2010. Wetland areas were determined using both 2006-2010 Coastal Change Analysis Program (C-CAP) raster maps and the National Wetlands Inventory (NWI) vector data. All 30 x 30-meter C-CAP pixels were extracted that are coded as estuarine emergent, scrub/shrub, or forested in either 2006 or 2010. A soil database for model fitting and validation was compiled from 49 different studies with spatially explicit empirical depth profile data and associated metadata, totaling 1,959 soil cores from 18 of the 22 coastal states. Reported estimates of carbon stocks were derived with modeling approaches that included (1) applying a single average carbon stock value from the compiled soil core data, (2) applying models fit using the empirical data and applied spatially using soil, vegetation and salinity maps, (3) relying on independently generated soil carbon maps from The United States Department of Agriculture (USDA)'s Soil Survey Geographic Database (SSURGO), and the NWI that intersected with mapped tidal wetlands, and (4) using a version of SSURGO bias-corrected for bulk density. Comparisons of uncertainty, precision, and accuracy among these four approaches are also provided.
Project: Carbon Monitoring System
The NASA Carbon Monitoring System (CMS) is designed to make significant contributions in characterizing, quantifying, understanding, and predicting the evolution of global carbon sources and sinks through improved monitoring of carbon stocks and fluxes. The System will use the full range of NASA satellite observations and modeling/analysis capabilities to establish the accuracy, quantitative uncertainties, and utility of products for supporting national and international policy, regulatory, and management activities. CMS will maintain a global emphasis while providing finer scale regional information, utilizing space-based and surface-based data and will rapidly initiate generation and distribution of products both for user evaluation and to inform near-term policy development and planning.
Related Publication:
Holmquist, J., L. Windham -Myers, N. Bliss, S. Crooks, J.T. Morris, J.P. Megonigal, T. Troxler, D. Weller, J. Callaway, J. Drexler, M.C. Ferner, M.E. Gonneea, K.D. Kroeger, L. Schile-Beers, I. Woo, K. Buffington, J. Breithaupt, B.M. Boyd, L.N. Brown, N. Dix, L. Hice, B.P. Horton, G.M. MacDonald, R.P. Moyer, W. Reay, T. Shaw, E. Smith, J.M. Smoak, C. Sommerfield, K. Thorne, D.Velinsky, E. Watson, K.W. Grimes, and M. Woodrey. Accuracy and Precision of Tidal Wetland Soil Carbon Mapping in the Conterminous United States. Scientific Reports, Volume 8, Article number: 9478 (2018). https://doi/10.1038/s41598-018-26948-7
Related Dataset:
A soil database that forms the basis for these modeled estimates was compiled by Holmquist et al. (2018) and is available at the link below.
James R Holmquist, Windham-Myers, Lisamarie, Bliss, Norman, Crooks, Stephen, Morris, James T, Megonigal, J Patrick, Troxler, Tiffany, Weller, Donald, Callaway, John, Drexler, Judith, Ferner, Matthew C, Gonneea, Meagan E, Kroeger, Kevin D, Schile-Beers, Lisa, Woo, Isa, Buffington, Kevin, Boyd, Brandon M, Breithaupt, Joshua, Brown, Lauren N, Dix, Nicole, Hice, Lyndie, Horton, Benjamin P, MacDonald, Glen M, Moyer, Ryan P, Reay, William, Shaw, Timothy, Smith, Erik, Smoak, Joseph M, Sommerfield, Christopher, Thorne, Karen, Velinsky, David, Watson, Elizabeth, Wilson Grimes, Kristen, Woodrey, Mark. (2018). [Dataset:] Accuracy and Precision of Tidal Wetland Soil Carbon Mapping in the Conterminous United States: Public Soil Carbon Data Release Version 1. Smithsonian Institution. https://doi.org/10.25572/ccrcn/10088/35684
Acknowledgement
This study was funded under the NASA Carbon Monitoring System, Grant number NNH14AY67I.
Data Characteristics
Spatial Coverage: Tidal wetlands of the conterminous United States
Spatial Resolution: 30-m
Temporal Coverage: The data covers the period 2006-01-01 to 2010-12-31
Temporal Resolution: One-time estimate
Study Areas: (All latitude and longitude given in decimal degrees)
|
Sites |
Westernmost Longitude |
Easternmost Longitude |
Northernmost Latitude |
Southernmost Latitude |
|---|---|---|---|---|
|
Tidal wetland areas across 18 states |
-127.9658333 |
-65.27111111 |
48.23722222 |
22.72861111 |
Data File Information
There are seven data files in Geotiff (.tif) format and one file in comma-separated (.csv) format with this dataset.
Table 1. File names and descriptions
| File Name | Description | Mapping Extent |
|---|---|---|
| coastal_soil_carbon_stocks_max_extent_2006-2010.tif | Maximum wetland mapping extent used for modeling -- intersection of C-CAP wetlands and NWI tidal surfaces. | Source of Maximum wetland extent |
| coastal_soil_carbon_stocks_min_extent_2006-2010.tif | Minimum wetland mapping extent used for modeling -- intersection of C-CAP wetlands and NWI tidal surfaces and limited to SSURGO map units with hydric soils. | Source of Minimum wetland extent |
| coastal_soil_carbon_stocks_null_model_2006-2010.tif | Carbon stock map using the average 27 kgC/m3 for soil carbon density. The average density from the assembled soil dataset with bulk density, organic matter, and organic carbon content summarized across 10-cm increments down to 1 m. | Maximum |
| coastal_soil_carbon_stocks_untreated_ssurgo_2006-2010.tif | SSURGO independent soils map --carbon stocks down to 1 m calculated from hydric soils- integrated soil types and depths | Minimum |
| coastal_soil_carbon_stocks_bias_corrected_ssurgo_2006-2010.tif | Bias corrected SSURGO map using the known relationship between organic matter content and bulk density-refer to section 4 of this document | Minimum |
| coastal_soil_carbon_stocks_model1_2006-2010.tif | Carbon stock map produced from model 1 with soil type as an independent variable | Minimum |
| coastal_soil_carbon_stocks_model2_2006-2010.tif | Carbon stock map produced from model 2 in which soil type was not considered as an independent variable | Maximum |
| coastal_soil_carbon_stocks_bias_rmse.csv | The performance statistics from comparisons between the fit model and SSURGO-based maps and the reference dataset | NA |
Geotiff Files
Spatial properties:
Bands: 1
EPSG: 42303 (NAD83 / Albers NorthAm)
proj4: +proj=aea +lat_1=29.5 +lat_2=45.5 +lat_0=23 +lon_0=-96 +x_0=0 +y_0=0 +datum=NAD83 +units=m +no_defs
Table 2. Variable properties for each geotiff file. Note: Soil carbon stocks are in units of kg C/m3, representing the total carbon mass to 1m depth.
| File names | Min value | Max value | No data value |
|---|---|---|---|
| coastal_soil_carbon_stocks_null_model_2006-2010.tif | 27 | 27 | -128 |
| coastal_soil_carbon_stocks_untreated_ssurgo_2006-2010.tif | 0 | 294 | 65535 |
| coastal_soil_carbon_stocks_bias_corrected_ssurgo_2006-2010.tif | 0 | 235 | 255 |
| coastal_soil_carbon_stocks_model1_2006-2010.tif | 0 | 41 | 255 |
| coastal_soil_carbon_stocks_model2_2006-2010.tif | 11 | 46 | -128 |
| coastal_soil_carbon_stocks_max_extent_2006-2010.tif | 1 | 1 | 0 |
| coastal_soil_carbon_stocks_min_extent_2006-2010.tif | 1 | 1 | 0 |
Model Comparison Data: coastal_soil-carbon_stocks_bias_rmse.csv
Table 3. Variables in the file coastal_soil-carbon_stocks_bias_rmse.csv. Refer also to Section 4 of this document for a description of the uncertainty analysis.
| Column Heading | Units | Description |
|---|---|---|
| model_name | Model name | |
| analysis_type | Analysis type: validation or application | |
| depth_interval | cm | The minimum to maximum depth interval in cm. Evaluation of model performance for soil carbon from 10 cm depth increments down to 1 m |
| standardized_unbiased_rmse | Standardized unbiased root mean square error (reference dataset s.d.) | |
| standardized_bias | Standardized bias (reference dataset s.d.) | |
| total_rmse | Standardized total root mean square error (reference dataset s.d.) | |
| number_data_points | Number of data points available and used in analysis | |
| performance | Comments on model performance |
Application and Derivation
Tidal wetlands including salt marshes, tidal freshwater wetlands, and tidally influenced forests such as mangroves, are a substantial global sink of organic carbon stocks. Thus for carbon accounting purposes, accurate and precise information is needed on the magnitude and spatial distribution of those stocks. These data are the results of modeling strategies to determine the most accurate and precise method of mapping carbon stocks in tidal wetland areas.
Quality Assessment
For models fit using a randomized subset of the empirical data, uncertainty was quantified in two phases, a validation stage in which we tested uncertainty in the model, and an application phase in which uncertainty was tested in the final mapped product. See Holmquist et al. (2018) for additional details.
Model uncertainty, validation, application and SSURGO applications
A simple average carbon density value (27.0 kilograms of organic carbon per meter squared [kg C m-2 to 1 m depth]) was applied. The reference dataset had a standard deviation (s.d.) of 13.0 kg C m-2, and a standard error of 0.14 kg C m-2 to 1 m depth.
The maps were evaluated using accuracy and precision metrics; normalized bias (bias*) and unbiased root mean square error (RMSE*`). The total normalized root mean square error (RMSE*) was calculated as the sum of squares of bias* and RMSE*; values that are less than one indicate that the model performs better than using a single average value while values greater than one indicate the average performs better.
Models were assessed at two phases: a validation phase, and an application phase.
- For model validation, carbon density was modeled based on ‘true values’. The ‘R’ predict function using only the fixed effects from the mixed effects models 1 and 2 was used.
- For model application, carbon density was modeled based on ‘mapped’ values following the same procedure for model validation, except using mapped values. Application compounded uncertainty in both the models and the underlying data products used to apply the model.
Models were evaluated using accuracy and precision metrics, normalized bias (bias*) and unbiased root mean square error (RMSE*’), and total normalized root mean square error.
In addition to model 1 and 2 these validation metrics of bias*, RMSE*’ and RMSE* were performed on two different applications of SSURGO. First, SSURGO was validated as described above. However, a positive bias was detected. Second, an attempt was made to ‘bias correct’ SSURGO bulk density using the ideal mixing model fit to both the calibration dataset and SSURGO.
Applying SSURGO as an independent soils map resulted in mapped values that had a higher s.d. than the reference values. An attempt was made to bias-correct SSURGO bulk density data and it was found that SSURGO’s organic self-packing density values had no significant relationship to depth. Bias correcting SSURGO using the known relationship between organic matter content and bulk density substantially reduced bias but did not improve precision or reduce RMSE below the required threshold. Utilizing unadjusted SSURGO data and maps resulted in a CONUS stock estimate 54% higher than the approach of applying a single average carbon density (Holmquist et al., 2018).
Data Acquisition, Materials, and Methods
Data, map, and extent determination
Empirical Soil Carbon Dataset
A spatially explicit dataset of disaggregated depth profile data and associated metadata was assembled totaling 1,959 soil cores from 49 different studies across CONUS (provided at https://doi.org/10.25572/ccrcn/10088/35684). Cores were included if they intersected tidal wetlands as mapped by the NWI.
The dataset was dominated by:
- estuarine mergent wetlands (n = 1533), but also contained
- tidal palustrine emergent (n = 157),
- estuarine forested and scrub/shrub (n = 46), and
- tidal palustrine forested and scrub/shrub (n = 87).
- 134 cores did not have enough accompanying meta-data to make this distinction.
The empirical dataset was spatially representative with 18 of the 22 coastal CONUS states included. Bulk density for all cores was measured gravimetrically. Core compaction was assumed to be minimal. Empirical data bulk density, organic matter, and organic carbon content were summarized across 10-cm increments down to 1 m using a depth weighted average, normalizing sampling interval to 1 cm increments and summing across the 10-cm depth intervals. For additional details regarding the dataset, refer to Holmquist et al. (2018).
Wetland Area
Wetland area was calculated using both 2006–2010 Coastal Change Analysis Program (C-CAP) raster maps as well as the NWI vector data. All pixels were extracted that were coded as estuarine emergent, scrub/shrub, or forested in 2006 or 2010.
Soil Maps from SSURGO
Maps and tables corresponding to soil survey areas intersecting mapped tidal wetlands were downloaded from SSURGO.
SSURGO ‘map units’ represent the spatial extents of soils using mapping techniques, soil surveys, and expert judgment taking into account landscape factors. SSURGO contains multiple linked data tables associated with those map units. Each map unit may have one or more components, and each component can have one or more ‘horizons’, depth intervals, which contain organic matter content and bulk density data. All SSURGO map units intersecting mapped tidal wetlands from NWI were extracted, and further the authors extracted all components categorized as ‘hydric’.
Reference dataset members were additionally screened so that low-quality latitude-longitude coordinates were excluded (n = 960 cores). Location information was coded as coming from GPS measurements, map figures or site descriptions. If positional information was not able to be effectively matched to a SSURGO map unit they were excluded.
Modeling strategies
Strategies for accurate and precise mapping and estimation of carbon stocks were evaluated and included applying average carbon stock values from syntheses of soil core data, applying models fit using empirical data and applied spatially using soil, vegetation and salinity maps, and relying on independently generated soil carbon maps from The United States Department of Agriculture (USDA)’s Soil Survey Geographic Database (SSURGO), and the National Wetlands Inventory (NWI) that intersected with mapped tidal wetlands. See Holmquist et al. (2018) for additional details.
Model fitting occurred in three major steps:
- Fitting the ideal mixing and organic matter density models, useful for describing variability along a spectrum of soils types
- Determining an appropriate threshold for categorizing organic- and mineral- dominated soils
- Fitting two mixed effects models: model 1, with soil type as an independent variable, and model 2 in which soil type was not considered as an independent variable.
Models were assessed at two phases: a validation phase, and an application phase. Refer to Section 4 of this document for additional details.
Generating Final Mapped Products
For SSURGO organic and inorganic soils extents at each 10 cm increment, and SSURGO and bias-corrected SSURGO carbon stocks down to 1 m, a geodatabase file containing spatial information on soil map unit extent was joined with tables containing 1-m depth totals, indexed by the map unit code. Polygons were rasterized and the resulting rasters were clipped using the mapped extent of tidal wetlands and SSURGO. All layers had 30-m resolution, the same coordinate system, and ‘snapped to’ pixel extent, matching C-CAP.
Final map products were created for the top meter of soil for the null model (average 27 kgC/m3), and models 1 and 2.
Model 1
Since model 1 was depth independent and soils data were required, an intermediate raster data layer was created representing the number of organic and inorganic depth horizons. An index layer was created so that each combination of salinity, vegetation, and climate zone had a unique integer. A table of associated values was generated for each of model 1’s potential outputs to join to the index layer. This was done for organic and inorganic soils separately, multiplied by the number of appropriate soil depth horizons and summarized the two layers to calculate the total carbon mass down to 1 m.
Model 2
Since model 2 was depth dependent and soil type independent, the unique climate, salinity and vegetation index layer was joined to a table of the predictions for each class, with all depth interval predictions, summed to one meter.
Data Access
These data are available through the Oak Ridge National Laboratory (ORNL) Distributed Active Archive Center (DAAC).
Tidal Wetland Soil Carbon Stocks for the Conterminous United States, 2006-2010
Contact for Data Center Access Information:
- E-mail: uso@daac.ornl.gov
- Telephone: +1 (865) 241-3952
References
Holmquist, J., L. Windham -Myers, N. Bliss, S. Crooks, J.T. Morris, J.P. Megonigal, T. Troxler, D. Weller, J. Callaway, J. Drexler, M.C. Ferner, M.E. Gonneea, K.D. Kroeger, L. Schile-Beers, I. Woo, K. Buffington, J. Breithaupt, B.M. Boyd, L.N. Brown, N. Dix, L. Hice, B.P. Horton, G.M. MacDonald, R.P. Moyer, W. Reay, T. Shaw, E. Smith, J.M. Smoak, C. Sommerfield, K. Thorne, D.Velinsky, E. Watson, K.W. Grimes, and M. Woodrey. Accuracy and Precision of Tidal Wetland Soil Carbon Mapping in the Conterminous United States. Scientific Reports, volume 8, Article number: 9478 (2018). https://doi.org/10.1038/s41598-018-26948-7
James R Holmquist, Windham-Myers, Lisamarie, Bliss, Norman, Crooks, Stephen, Morris, James T, Megonigal, J Patrick, Troxler, Tiffany, Weller, Donald, Callaway, John, Drexler, Judith, Ferner, Matthew C, Gonneea, Meagan E, Kroeger, Kevin D, Schile-Beers, Lisa, Woo, Isa, Buffington, Kevin, Boyd, Brandon M, Breithaupt, Joshua, Brown, Lauren N, Dix, Nicole, Hice, Lyndie, Horton, Benjamin P, MacDonald, Glen M, Moyer, Ryan P, Reay, William, Shaw, Timothy, Smith, Erik, Smoak, Joseph M, Sommerfield, Christopher, Thorne, Karen, Velinsky, David, Watson, Elizabeth, Wilson Grimes, Kristen, Woodrey, Mark. (2018). [Dataset:] Accuracy and Precision of Tidal Wetland Soil Carbon Mapping in the Conterminous United States: Public Soil Carbon Data Release Version 1. Smithsonian Institution. https://doi.org/10.25572/ccrcn/10088/35684