Documentation Revision Date: 2018-12-11
Data Set Version: 1
Summary
The 1m NAIP classification was performed in eCognition, which applies an object-oriented approach, beginning with the multi-resolution segmentation tool to isolate spectrally similar pixels as objects. Parameters for shape and compactness were set to the default values of 0.1 and 0.5, and the scale parameter, which determines segmentation size, was set by region based on trial and error. Once the segmentation was complete, the objects were classified using spectral thresholds derived from the 4 NAIP bands -- NDVI, the Normalized Difference Water Index (NDWI), and mean brightness. The percent of each class within each 30m Landsat pixel in the Blue Carbon Extent Map was then calculated.
There are six files with the fraction of green vegetation (FGV) provided with this dataset in GeoTIFF (.tif) format, one for each estuarine region.
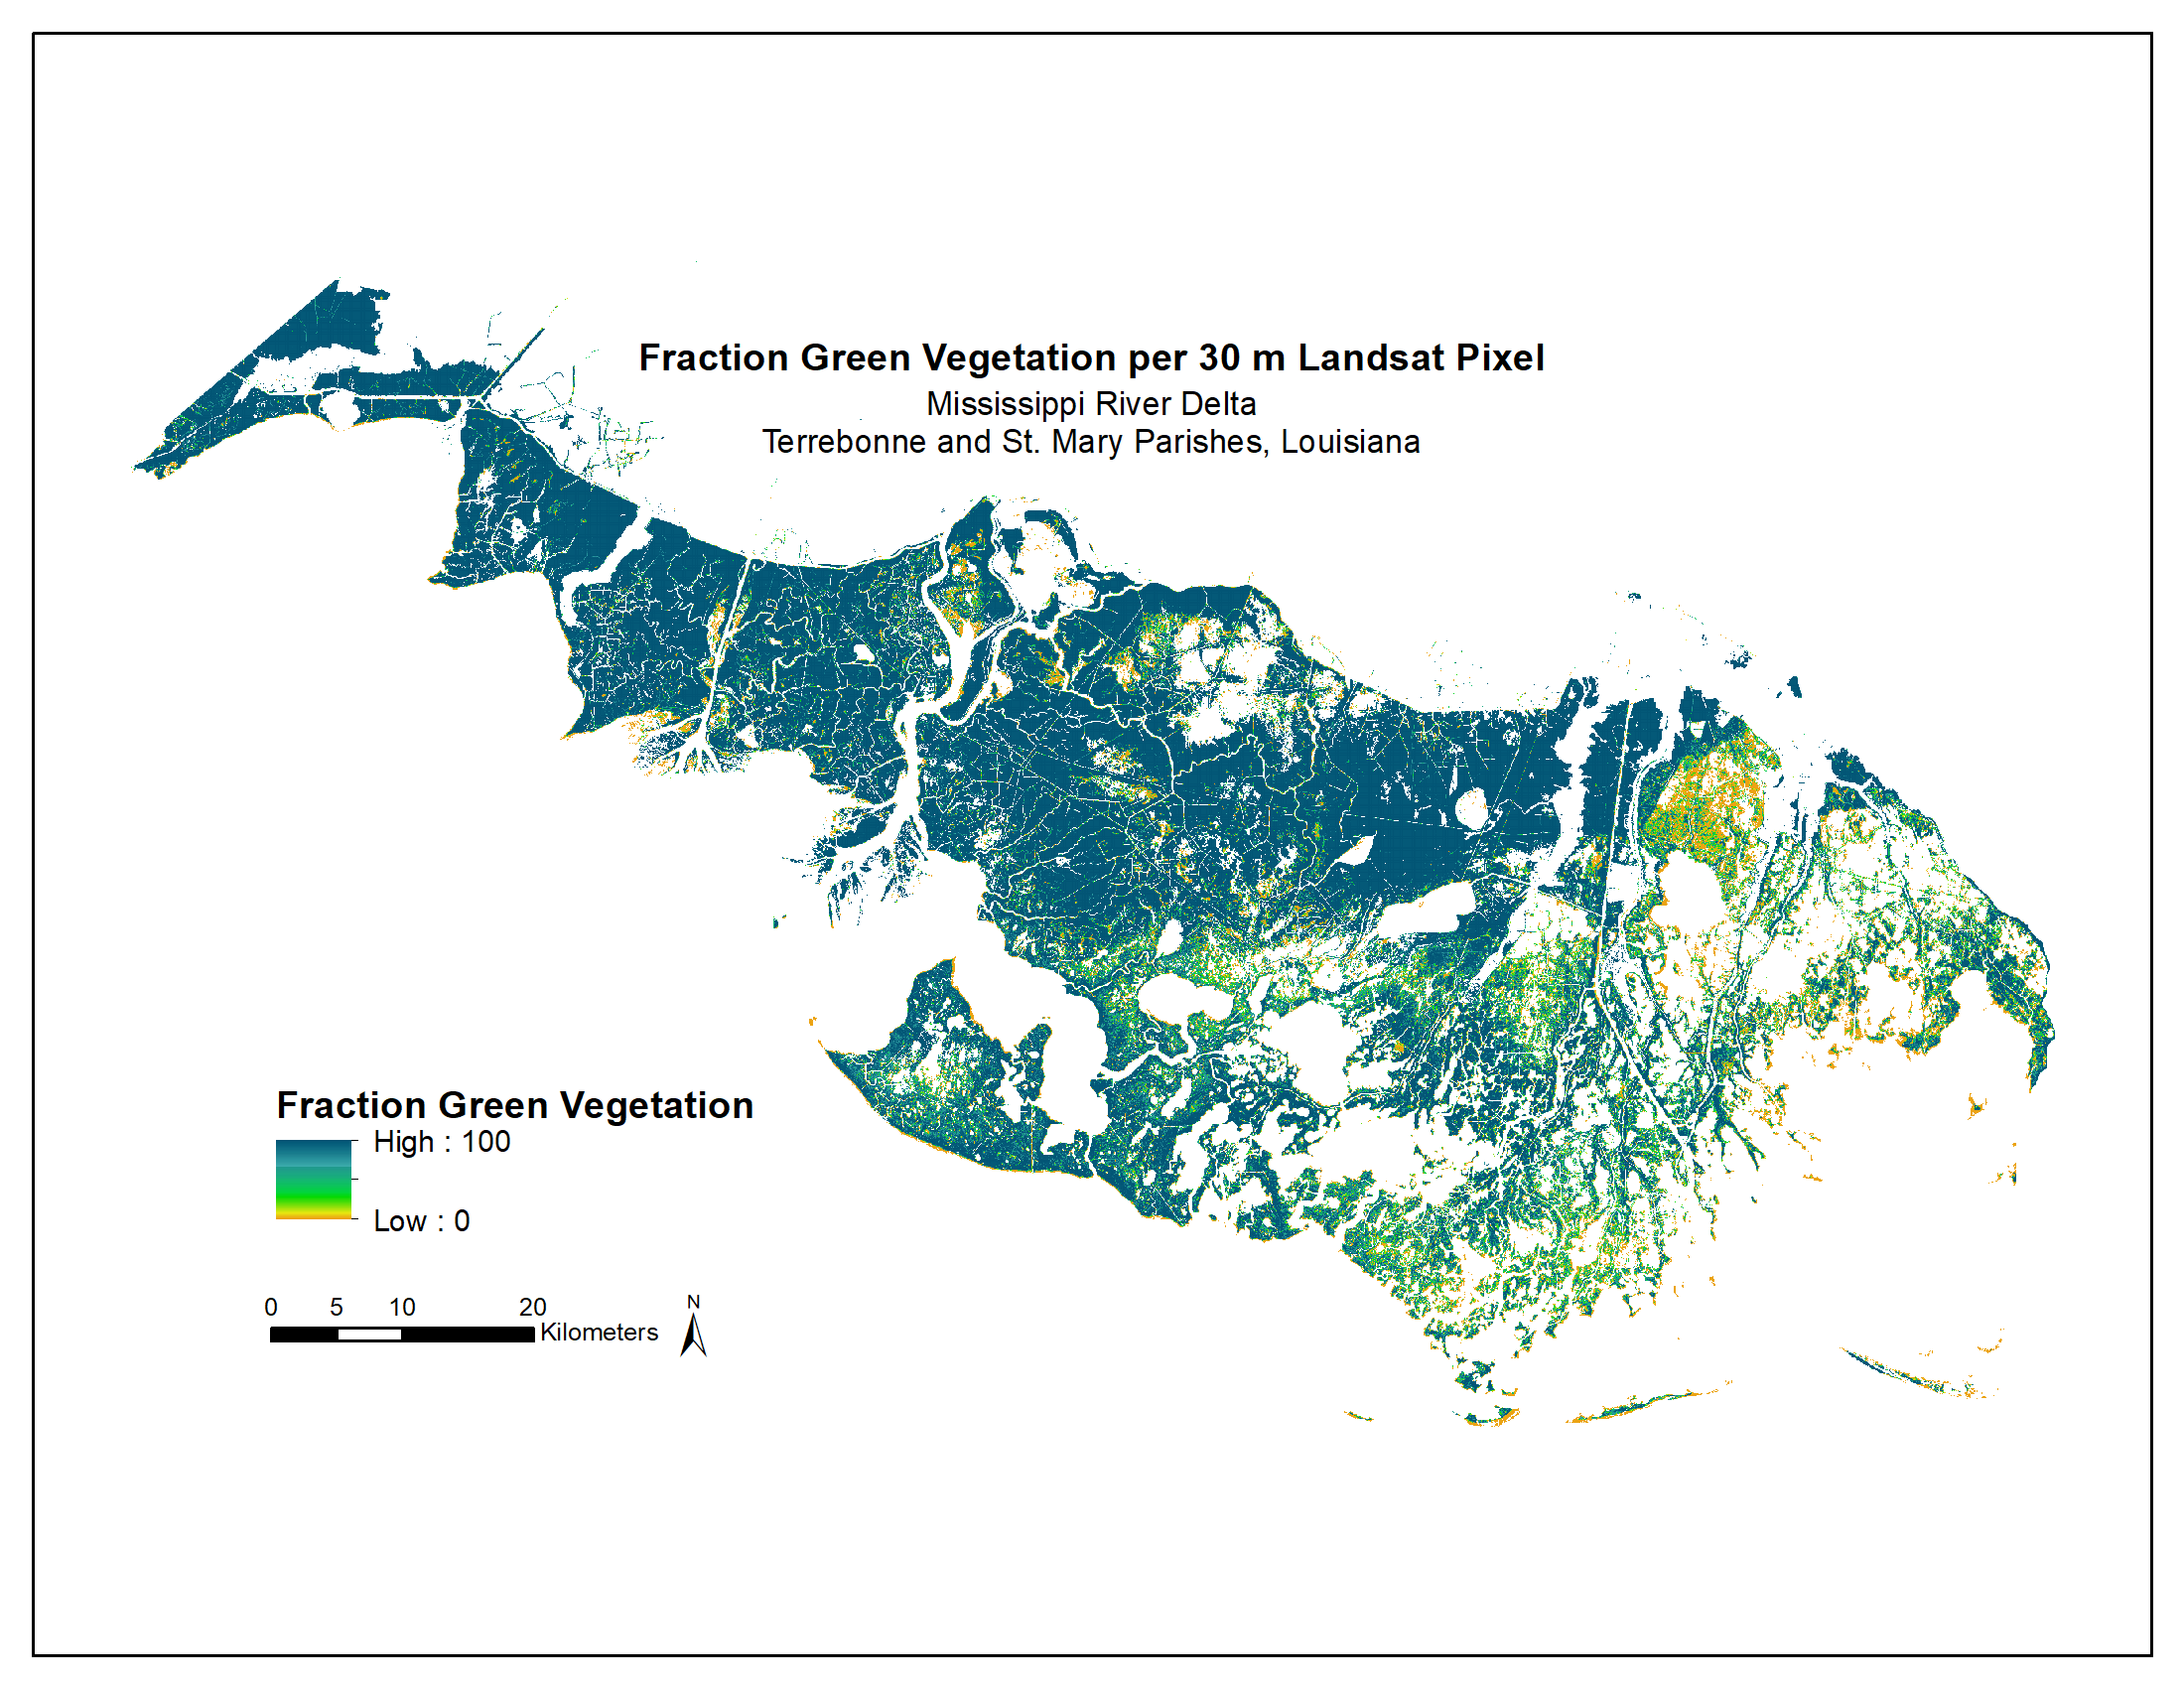
Figure 1. Fraction green vegetation per 30m Landsat pixel for Terrebonne and St. Mary Parishes, Louisiana, as classified in 1 m National Agriculture Imagery Program 2015 images.
Citation
Ballanti, L., and K.B. Byrd. 2018. Green Vegetation Fraction High-Resolution Maps for Selected US Tidal Marshes, 2015. ORNL DAAC, Oak Ridge, Tennessee, USA. https://doi.org/10.3334/ORNLDAAC/1608
Table of Contents
- Data Set Overview
- Data Characteristics
- Application and Derivation
- Quality Assessment
- Data Acquisition, Materials, and Methods
- Data Access
- References
Data Set Overview
This dataset provides 30m resolution maps of the fraction of green vegetation within tidal marshes for six estuarine regions of the conterminous United States: Cape Cod, MA; Chesapeake Bay, MD; Everglades, FL; Mississippi Delta, LA; San Francisco Bay, CA; and Puget Sound, WA. Maps were derived from a 1m classification of 2013 to 2015 National Agriculture Imagery Program (NAIP) images as tidal marsh green vegetation, non-vegetation, and open water. Using this high-resolution map, the percent of each class within Landsat pixel extents was calculated to produce a 30m fraction of green vegetation map for each region.
The 1m NAIP classification was performed in eCognition, which applies an object-oriented approach, beginning with the multi-resolution segmentation tool to isolate spectrally similar pixels as objects. Parameters for shape and compactness were set to the default values of 0.1 and 0.5, and the scale parameter, which determines segmentation size, was set by region based on trial and error. Once the segmentation was complete, the objects were classified using spectral thresholds derived from the 4 NAIP bands -- NDVI, the Normalized Difference Water Index (NDWI), and mean brightness. The percent of each class within each 30m Landsat pixel in the Blue Carbon Extent Map was then calculated.
Project: Carbon Monitoring System
The NASA Carbon Monitoring System (CMS) is designed to make significant contributions in characterizing, quantifying, understanding, and predicting the evolution of global carbon sources and sinks through improved monitoring of carbon stocks and fluxes. The System will use the full range of NASA satellite observations and modeling/analysis capabilities to establish the accuracy, quantitative uncertainties, and utility of products for supporting national and international policy, regulatory, and management activities. CMS will maintain a global emphasis while providing finer scale regional information, utilizing space-based and surface-based data and will rapidly initiate generation and distribution of products both for user evaluation and to inform near-term policy development and planning.
Related Publication:
Byrd, K. B., Ballanti, L., Thomas, N., Nguyen, D., Holmquist, J. R., Simard, M., Windham-Myers, L. 2018. A remote sensing-based model of tidal marsh aboveground carbon stocks for the conterminous United States. ISPRS Journal of Photogrammetry and Remote Sensing. 139, 255-271. https://doi.org/10.1016/j.isprsjprs.2018.03.019
Related Datasets:
Ballanti, L., and K.B. Byrd. 2018. Vegetation and Open Water High-Resolution Maps for Selected US Tidal Marshes, 2015. ORNL DAAC, Oak Ridge, Tennessee, USA. https://doi.org/10.3334/ORNLDAAC/1609
Byrd, K.B., Ballanti, L.R., Thomas, N.M., Holmquist, J.R., Simard, M., Windham-Myers, L. 2018. Aboveground Biomass High-Resolution Maps for Selected US Tidal Marshes, 2015. ORNL DAAC, Oak Ridge, Tennessee, USA. https://doi.org/10.3334/ORNLDAAC/1610
Acknowledgement: This work was funded by NASA CMS Grant NNH14AY671 and the U.S. Geological Survey Land Change Science Program and LandCarbon Program.
Data Characteristics
Spatial Coverage: Six estuarine study regions across the conterminous US.
Spatial resolution: 30m
Temporal coverage: 2013-09-25 to 2015-08-27
Temporal resolution: Annual
Study Areas (All latitude and longitude given in decimal degrees)
| Sites | Westernmost Longitude | Easternmost Longitude | Northernmost Latitude | Southernmost Latitude |
|---|---|---|---|---|
| Cape Cod | -70.702069 | -69.926677 | 42.085077 | 41.515281 |
| Chesapeake Bay | -76.781782 | -76.388616 | 39.238401 | 38.710581 |
| Everglades | -81.463655 | -80.394194 | 25.890658 | 24.916581 |
| Louisiana | -91.88786 | -90.360627 | 29.940082 | 29.037493 |
| Puget Sound | -122.732579 | -122.665894 | 47.117398 | 47.067822 |
| San Francisco Bay | -122.616322 | -121.226056 | 38.58976 | 37.660531 |
Data File Information
There are six files with the fraction of green vegetation (FGV) provided with this dataset in GeoTIFF (.tif) format, one for each estuarine region.
Each file is named as site name abbreviation_FGV.tif
| Filename | Study Sites | Site Abbreviations | UTM Zone |
|---|---|---|---|
| capecod_FGV.tif | Cape Cod | capecod | 19N |
| chesapeakebay_FGV.tif | Chesapeake | chesapeakebay | 18N |
| everglades_FGV.tif | Everglades | everglades | 17N |
| mississippidelta_FGV.tif | Louisiana | mississippidelta | 15N |
| pugetsound_FGV.tif | Puget Sound | pugetsound | 10N |
| sanfranciscobay_FGV.tif | San Francisco Bay | sanfranciscobay | 10N |
Spatial properties
Pixel size: 30 x 30 m
Parameter: fraction of green vegetation as percentage (%) with range from 0.0 to 100.0
No data value: -128
All files are in the Universal Transverse Mercator (UTM) conformal projection system, each defined within a standard zone, and observed with the WGS 84 spatial reference system.
Application and Derivation
The products were used to develop a U.S. national-scale remote sensing model of tidal marsh aboveground C stocks based on freely available satellite and airborne imagery and developed with field samples of aboveground biomass and plant %C. Uncertainties in C stock estimates were calculated through propagation of error in biomass, %C, and C-CAP tidal marsh map area. Remote sensing models such as described here will be used to develop national GHG inventories and aid implementation of projects approved in the voluntary carbon markets. For more information see Byrd et al. 2018.
Quality Assessment
An accuracy assessment of the original NAIP classification for each region was based on 150 random points selected for each of the six regions. Each sample point was assigned to a class based on visual interpretation of the NAIP imagery. Overall accuracy for the six regions ranged from 80.5% to 98%.
More information on the accuracy assessment is included in the supplemental data for the publication Byrd et al. 2018.
Data Acquisition, Materials, and Methods
Study Sites
The study regions include:
- Cape Cod peninsula, Massachusetts
- Smithsonian Environmental Research Center Global Change Research Wetland (GCReW) on Chesapeake Bay in Anne Arundel County, Maryland
- Florida Coastal Everglades Long Term Ecological Research Site in Everglades National Park, Florida
- Terrebonne and Saint Mary Parishes, Louisiana, in the Mississippi Delta
- Billy Frank Jr. Nisqually National Wildlife Refuge (NWR) in Puget Sound, Washington
- San Francisco Bay, California, which was split into two sub-regions, the saline/brackish marshes and the freshwater marshes.
The specific locations of the estuarine and palustrine emergent tidal marshes in the study regions were as indicated by a modified NOAA Coastal Change Analysis Program (C-CAP) map (NOAA Office for Coastal Management, 2015).
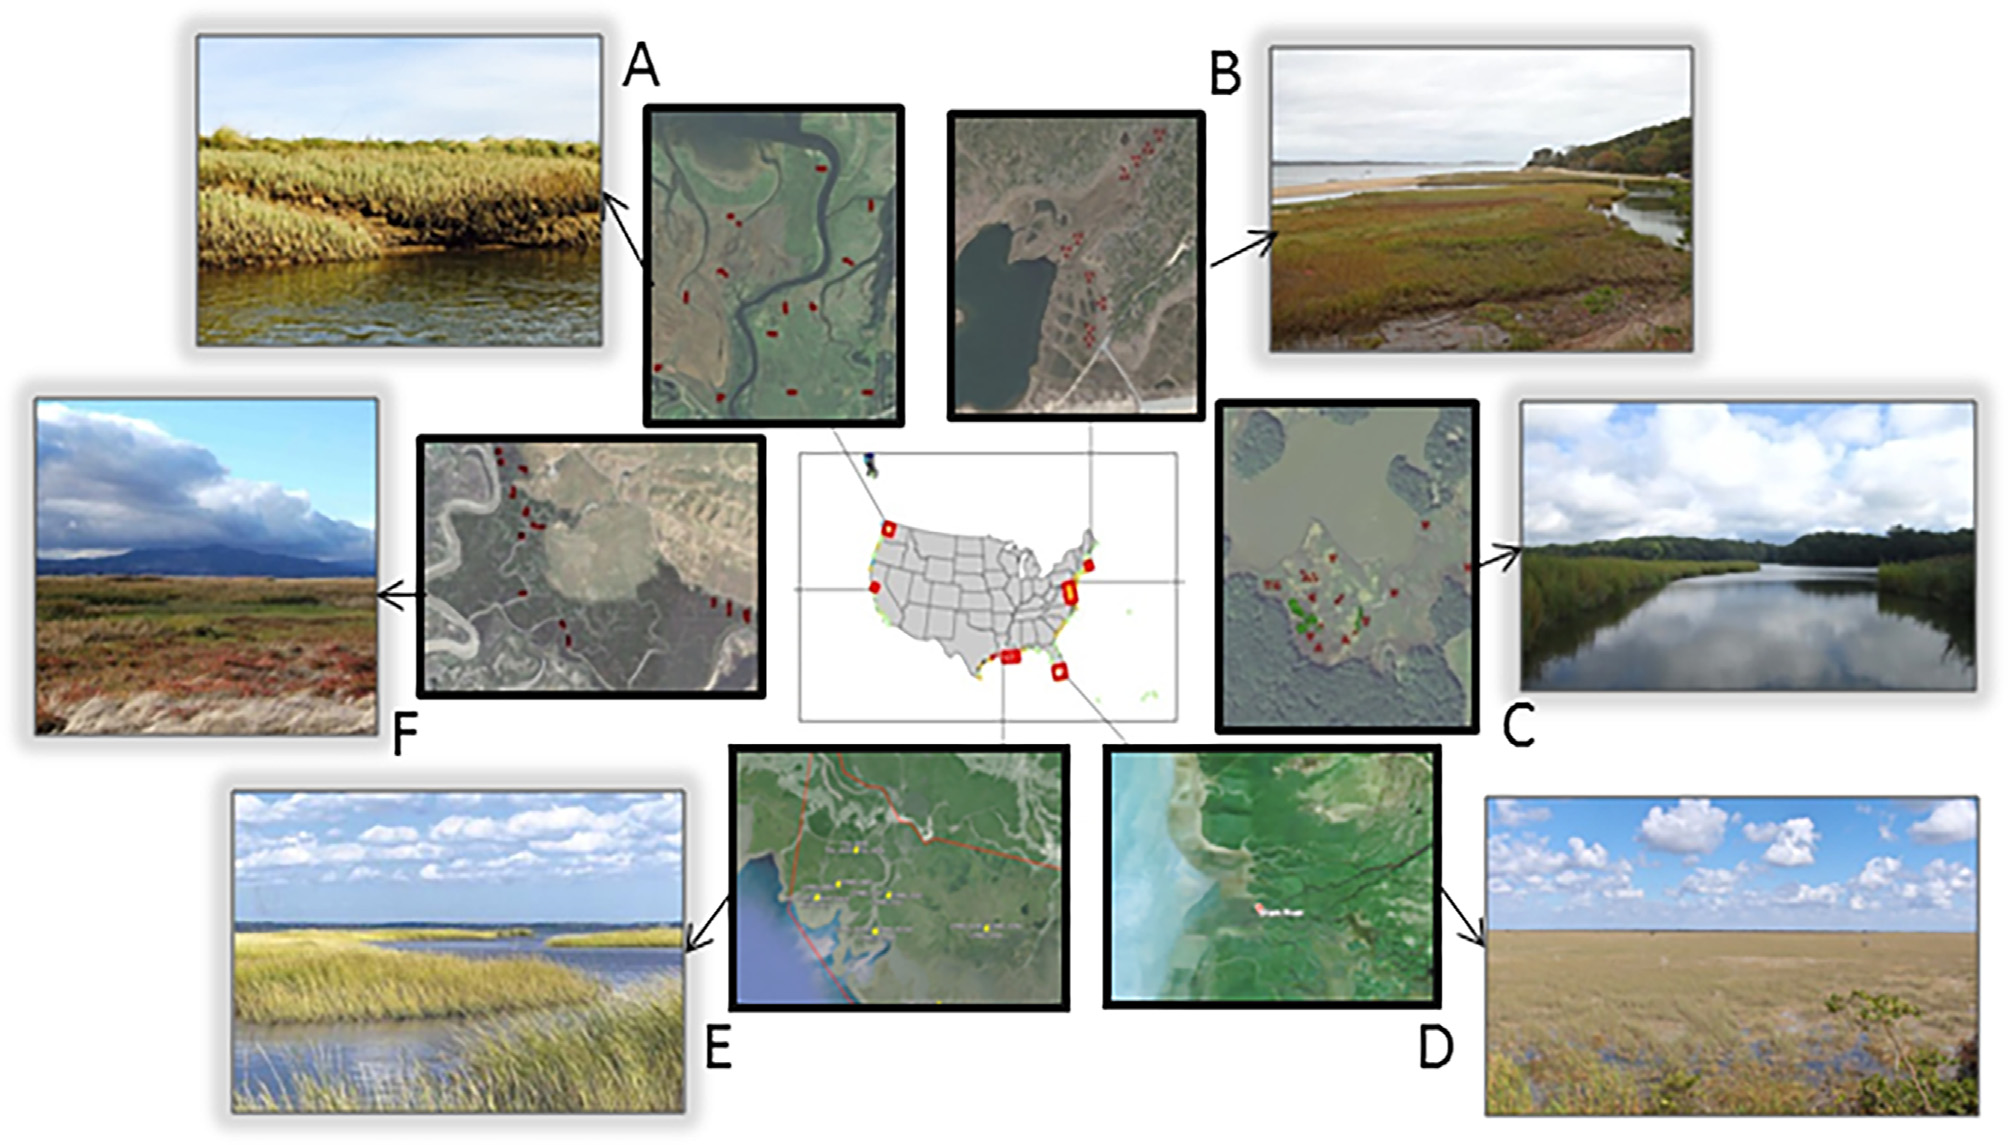
Figure 2. Photos of study regions with photo credits, from Byrd et al. (2018). (A) Puget Sound, Washington, Laurel Ballanti; (B) Cape Cod, Massachusetts, Lia McLaughlin; (C) Chesapeake Bay, Maryland, Grace Schwartz; (D) Everglades, Florida, paulsmithrj, CC BY-SA 3.0; (E) Mississippi River Delta, Louisiana, Greg Snedden; (F) San Francisco Bay, California, Jessica Schneider.
Data Processing
This dataset provides 30m resolution maps of the fraction of green vegetation within tidal marshes for six estuarine regions of the conterminous United States. Maps were derived from a 1m classification of 2015 National Agriculture Imagery Program (NAIP) images as tidal marsh green vegetation, non-vegetation, and open water. Using this high-resolution map, we calculated the percent of each class within Landsat pixel extents to produce a 30m fraction of green vegetation map for each region.
NAIP Image Classification: For each region, we generated a 1m resolution map of tidal marsh green vegetation, non-vegetation, and open water, which was then used to calculate 30m fractional cover of green vegetation per Landsat pixel in the Blue Carbon Extent Map. The most recent NAIP images for each region were downloaded for free from earthexplorer.usgs.gov and mosaicked in ERDAS Imagine MosaicPro using the color balance correction.
The NAIP classification was performed in eCognition, which applies an object-oriented approach, beginning with the multi-resolution segmentation tool to isolate spectrally similar pixels as objects. Object oriented-analysis has shown higher accuracy and removal of speckle noise in high resolution imagery such as NAIP, compared to pixel-based analysis (Li and Shao, 2014; Yuan and Bauer, 2006). Parameters for shape and compactness were set to the default values of 0.1 and 0.5, and the scale parameter, which determines segmentation size, was set by region based on trial and error. Once the segmentation was complete, the objects were classified using spectral thresholds based on the 4 NAIP bands, NDVI, the Normalized Difference Water Index (NDWI) (McFeeters, 1996) and mean brightness. We calculated the percent of each class within Landsat pixel extents, and generated 30m resolution maps of fraction green vegetation for each region.
Data Access
These data are available through the Oak Ridge National Laboratory (ORNL) Distributed Active Archive Center (DAAC).
Green Vegetation Fraction High-Resolution Maps for Selected US Tidal Marshes, 2015
Contact for Data Center Access Information:
- E-mail: uso@daac.ornl.gov
- Telephone: +1 (865) 241-3952
References
Byrd, K. B., Ballanti, L., Thomas, N., Nguyen, D., Holmquist, J. R., Simard, M., Windham-Myers, L. 2018. A remote sensing-based model of tidal marsh aboveground carbon stocks for the conterminous United States. ISPRS Journal of Photogrammetry and Remote Sensing. 139, 255-271. https://doi.org/10.1016/j.isprsjprs.2018.03.019
Li, X., Shao, G., 2014. Object-based land-cover mapping with high resolution aerial photography at a county scale in Midwestern USA. Remote Sens. 6, 11372. https://doi.org/10.3390/rs61111372
McFeeters, S.K., 1996. The use of the Normalized Difference Water Index (NDWI) in the delineation of open water features. Int. J. Remote Sens. 17, 1425–1432. https://doi.org/10.1080/01431169608948714
Yuan, F., Bauer, M.E., 2006. Mapping impervious surface area using high resolution imagery: A comparison of object-based and per pixel classification, American Society for Photogrammetry and Remote Sensing - Annual Conference of the American Society for Photogrammetry and Remote Sensing 2006: Prospecting for Geospatial Information Integration, Reno, NV, pp. 1667–1674.