Documentation Revision Date: 2021-03-22
Dataset Version: 1
Summary
The largest biomass concentration was found across the large extent of the Terrebonne and St. Mary Parishes, LA at 1971.9 g/m2. Aboveground biomass similarly averaged 1954.6 g/m2 in the freshwater tidal wetlands in the San Francisco Bay region.
There are six files in GeoTIFF format in this dataset; one file for each of the six estuarine sites.
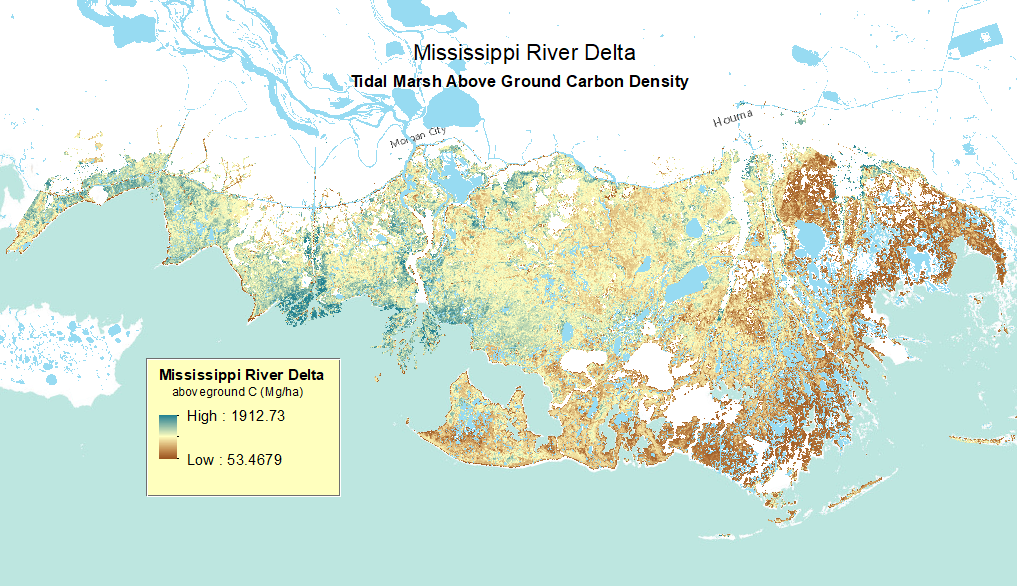
Figure 1. The largest present-day biomass concentration was found across the Terrebonne and St. Mary Parishes for the Mississippi River Delta in Louisiana. (Source Louisiana_biomass.tif)
Citation
Byrd, K.B., L. Ballanti, N. Thomas, D. Nguyen, J.R. Holmquist, M. Simard, and L. Windham-Myers. 2018. Aboveground Biomass High-Resolution Maps for Selected US Tidal Marshes, 2015. ORNL DAAC, Oak Ridge, Tennessee, USA. https://doi.org/10.3334/ORNLDAAC/1610
Table of Contents
- Dataset Overview
- Data Characteristics
- Application and Derivation
- Quality Assessment
- Data Acquisition, Materials, and Methods
- Data Access
- References
Dataset Overview
This dataset provides maps of aboveground tidal marsh biomass (g/m2) at 30 m resolution for six estuarine regions of the conterminous United States: Cape Cod, MA; Chesapeake Bay, MD, Everglades, FL; Mississippi Delta, LA; San Francisco Bay, CA; and Puget Sound, WA. Estuarine and palustrine emergent tidal marsh areas were based on a 2010 NOAA Coastal Change Analysis Program (C-CAP) map. Aboveground biomass maps were generated from a random forest model driven by Landsat vegetation indices and a national scale dataset of field-measured aboveground biomass. The final model, driven by six Landsat vegetation indices, with the soil adjusted vegetation index as the most important, successfully predicted biomass for a range of marsh plant functional types defined by height, leaf angle, and growth form. Biomass can be converted to carbon stocks using a mean plant carbon content of 44.1%.
The largest biomass concentration was found across the large extent of the Terrebonne and St. Mary Parishes, LA at 1971.9 g/m2. Aboveground biomass similarly averaged 1954.6 g/m2 in the freshwater tidal wetlands in the San Francisco Bay region.
Project: Carbon Monitoring System
The NASA Carbon Monitoring System (CMS) is designed to make significant contributions in characterizing, quantifying, understanding, and predicting the evolution of global carbon sources and sinks through improved monitoring of carbon stocks and fluxes. The System will use the full range of NASA satellite observations and modeling/analysis capabilities to establish the accuracy, quantitative uncertainties, and utility of products for supporting national and international policy, regulatory, and management activities. CMS will maintain a global emphasis while providing finer scale regional information, utilizing space-based and surface-based data and will rapidly initiate generation and distribution of products both for user evaluation and to inform near-term policy development and planning.
Related Publications:
Byrd, K. B., Ballanti, L., Thomas, N., Nguyen, D., Holmquist, J. R., Simard, M., Windham-Myers, L. 2018. A remote sensing-based model of tidal marsh aboveground carbon stocks for the conterminous United States. ISPRS Journal of Photogrammetry and Remote Sensing. 139, 255-271. https://doi.org/10.1016/j.isprsjprs.2018.03.019
Related Dataset:
Ballanti, L., and K.B. Byrd. 2018. Green Vegetation Fraction High-Resolution Maps for Selected US Tidal Marshes, 2015. ORNL DAAC, Oak Ridge, Tennessee, USA. https://doi.org/10.3334/ORNLDAAC/1608
Ballanti, L., and K.B. Byrd. 2018. Vegetation and Open Water High-Resolution Maps for Selected US Tidal Marshes, 2015. ORNL DAAC, Oak Ridge, Tennessee, USA. https://doi.org/10.3334/ORNLDAAC/1609
Acknowledgement: This work was funded by NASA CMS Grant NNH14AY671 and the U.S. Geological Survey Land Change Science Program and LandCarbon Program.
Data Characteristics
Spatial Coverage: Six estuarine study regions across the conterminous US.
Spatial resolution: 30 m
All files are in the Universal Transverse Mercator (UTM) conformal projection system, each defined within a standard zone
Temporal coverage: 2013-09-25 to 2015-08-27.
Temporal resolution: One-time estimate.
Study Areas (All latitude and longitude given in decimal degrees)
| Sites | Westernmost Longitude | Easternmost Longitude | Northernmost Latitude | Southernmost Latitude |
|---|---|---|---|---|
| Cape Cod | -70.7021 | -69.9267 | 42.0848 | 41.5152 |
| Chesapeake Bay | -76.7252 | -76.3886 | 39.2384 | 38.7114 |
| Everglades | -81.4637 | -80.3942 | 25.8899 | 25.0924 |
| Louisiana | -91.8879 | -90.3631 | 29.8467 | 29.0374 |
| Puget Sound | -122.7326 | -122.6658 | 47.1174 | 47.0678 |
| San Francisco Bay | -122.6163 | -121.2325 | 38.3264 | 37.6605 |
Data file information
There are 6 data files in GeoTIFF (.tif) format, one for each of the six estuarine study areas across the conterminous US.
Each file is named as site_biomass.tif
Pixel size= 30m x 30m
One band is included: Aboveground biomass in units of g/m2
|
filename
|
min_val
|
max_val
|
nodata_val
|
data_type
|
n_cols
|
n_rows
|
map_units
|
EPSG
|
| capecod_biomass.tif | 21.4 | 1906.2 | -9999 | Float64 | 2116 | 2076 | meter | 32619 |
| pugetsound_biomass.tif | 0 | 1587.7 | -9999 | Float64 | 168 | 183 | meter | 32610 |
| sanfranciscobay_biomass.tif | 0 | 1954.6 | -9999 | Float64 | 4023 | 2417 | meter | 32610 |
| mississippidelta_biomass.tif | 53.4 | 1971.9 | -9999 | Float64 | 4885 | 2912 | meter | 32615 |
| everglades_biomass.tif | 0 | 1520.2 | -9999 | Float64 | 3571 | 2942 | meter | 32617 |
| chesapeakebay_biomass.tif | 123.1 | 1811.1 | -9999 | Float64 | 939 | 1934 | meter | 32618 |
Application and Derivation
Remote sensing-based maps of tidal marshes, both of their extents and carbon stocks, have the potential to play a key role in conducting greenhouse gas inventories and implementing climate mitigation policies.
Remote sensing models such as described in Byrd et al. (2018) will be used to develop national GHG inventories and aid implementation of projects approved in the voluntary carbon markets. Given global coverage of Landsat, this approach can likely be expanded internationally as well. Although high resolution imagery such as NAIP is not available globally, Landsat-only models will likely provide suitable results, particularly in fully vegetated areas. Newly available global base maps of salt marshes (Mcowen et al., 2017) will also aid global implementation. While archived Landsat imagery can be used for historical estimates of aboveground C flux, moving forward, with the development of a 2015 C-CAP landcover map and continuation of Landsat satellites, future spatially explicit trends can be calculated as well.
Quality Assessment
In the paper by Byrd et al. 2018, we present a multivariate delta method to calculate uncertainties in regional carbon densities and stocks that considers standard errors in map area, mean biomass and mean %C per region and wetland type. The random forest model was assessed for error by considering RMSE, and percent normalized RMSE of cross-validation prediction values, as well as model bias.
Data Acquisition, Materials, and Methods
Study Sites
The study regions include:
- Cape Cod peninsula, Massachusetts
- Smithsonian Environmental Research Center Global Change Research Wetland (GCReW) on Chesapeake Bay in Anne Arundel County, Maryland
- Florida Coastal Everglades Long Term Ecological Research Site in Everglades National Park, Florida
- Terrebonne and Saint Mary Parishes, Louisiana, in the Mississippi Delta
- Billy Frank Jr. Nisqually National Wildlife Refuge (NWR) in Puget Sound, Washington
- San Francisco Bay, California, which was split into two sub-regions, the saline/brackish marshes and the freshwater marshes.
The specific locations of the estuarine and palustrine emergent tidal marshes in the study regions were as indicated by a modified NOAA Coastal Change Analysis Program (C-CAP) map (NOAA Office for Coastal Management 2015).
Data Sources and Processing
In this study the investigators developed a U.S. national-scale remote sensing model of tidal marsh aboveground C stocks based on freely available satellite and airborne imagery and developed with field samples of aboveground biomass and plant %C. Uncertainties in C stock estimates were calculated through propagation of error in biomass, %C, and C-CAP tidal marsh map area.
Details of data sources and processing may be found in the Byrd et al., 2018 related publication.
User Note: Time and effort in development of the remote sensing dataset used in this study was greatly reduced by taking advantage of the parallel processing and data archive available with Google Earth Engine (GEE). The GEE platform allowed for fast access to the massive archive of satellite images, and once the custom code was developed and tested, it allowed for fast, repeatable, automated extraction of and computations on pixel values from such images. Although GEE also contains collections of Sentinel-1 (though incomplete as of May 2017) and NAIP, we primarily used GEE’s Landsat imagery collections, which GEE kept current on a more regular basis, to build the Biomass/Remote Sensing dataset (Byrd et al., 2017). Despite the advantages of GEE for building large datasets however, in this study it was determined that some post-processing steps were best performed outside the GEE environment. See Supplementary Data S1 of Byrd et al. (2018) for the GEE code.
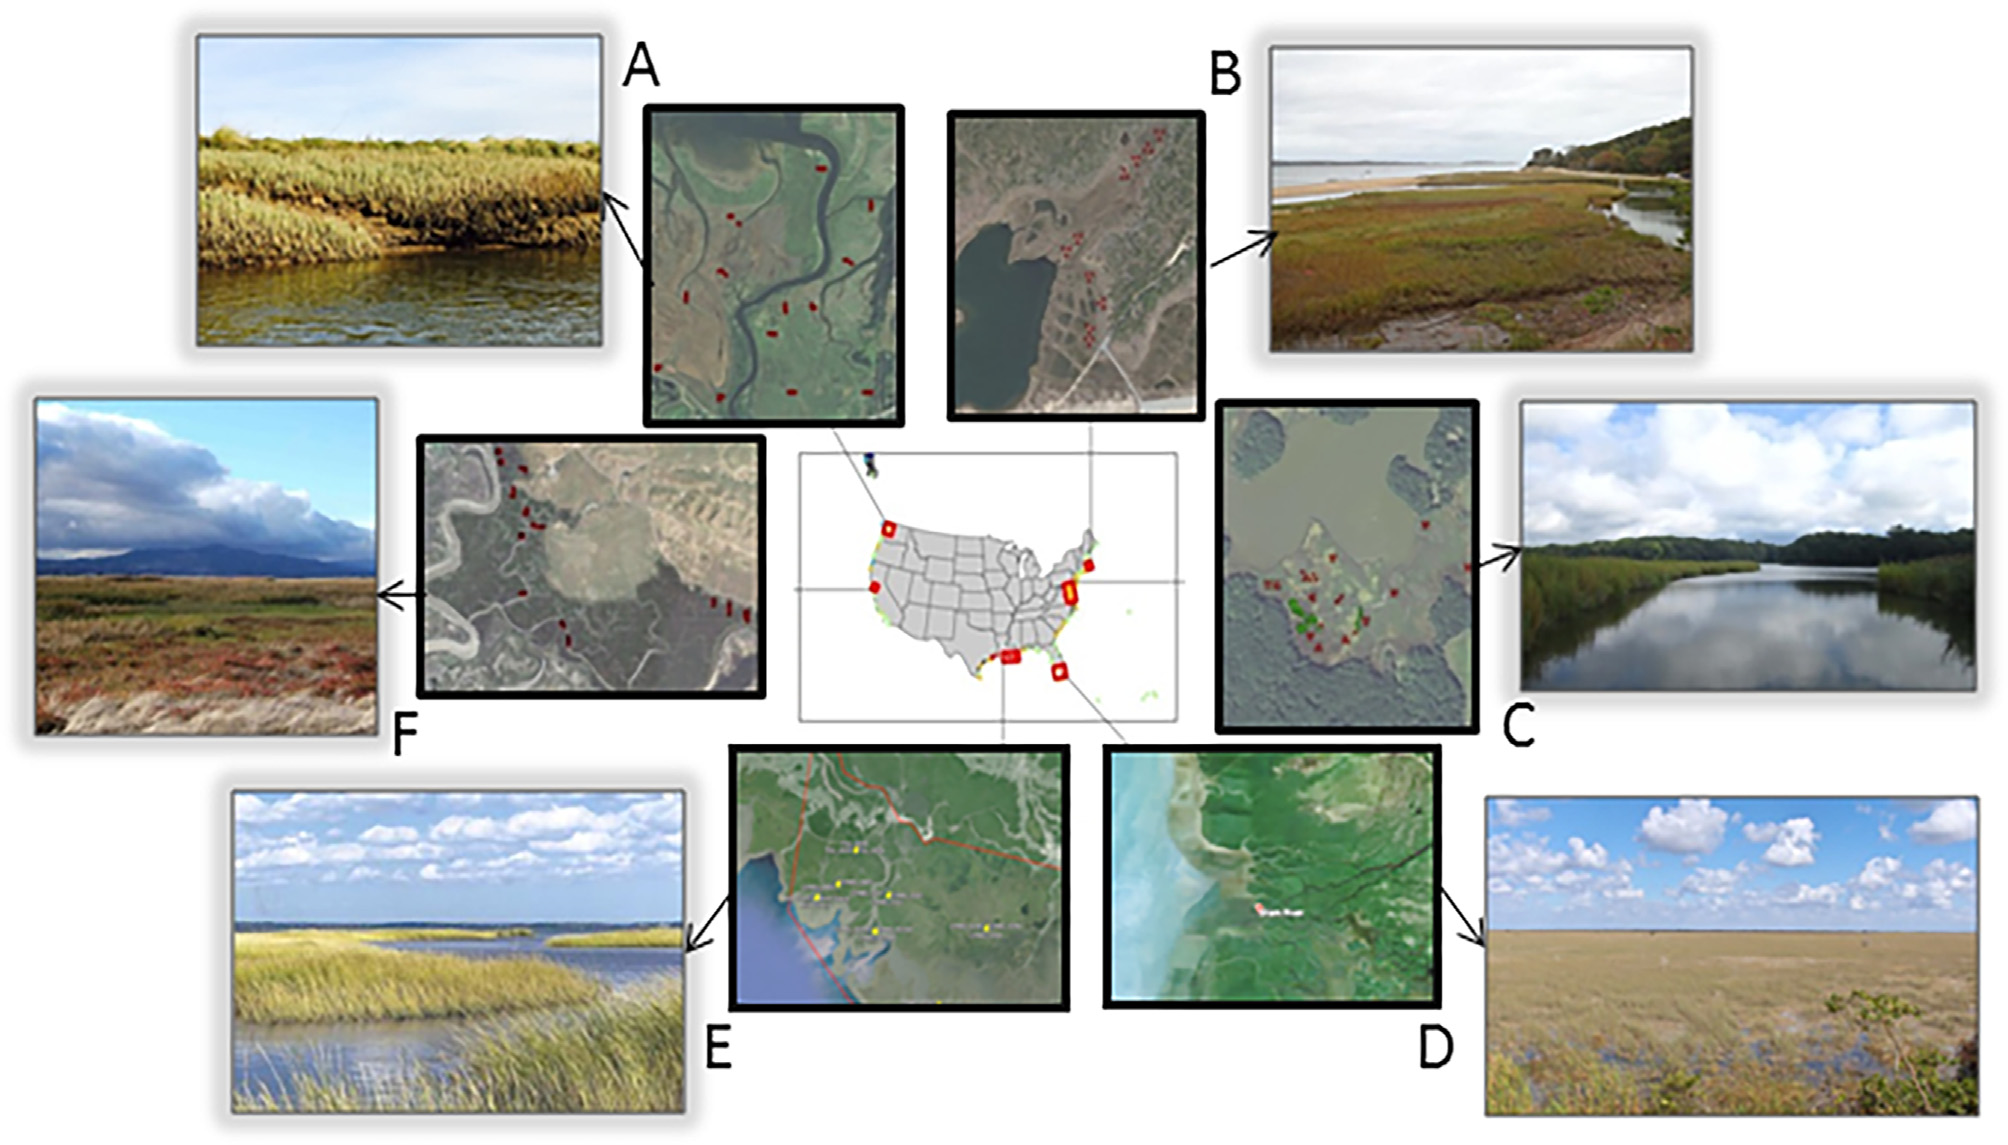
Figure 2. Photos of study regions with photo credits, from Byrd et al. (2018). (A) Puget Sound, Washington, Laurel Ballanti; (B) Cape Cod, Massachusetts, Lia McLaughlin; (C) Chesapeake Bay, Maryland, Grace Schwartz; (D) Everglades, Florida, paulsmithrj, CC BY-SA 3.0; (E) Mississippi River Delta, Louisiana, Greg Snedden; (F) San Francisco Bay, California, Jessica Schneider.
Data Access
These data are available through the Oak Ridge National Laboratory (ORNL) Distributed Active Archive Center (DAAC).
Aboveground Biomass High-Resolution Maps for Selected US Tidal Marshes, 2015
Contact for Data Center Access Information:
- E-mail: uso@daac.ornl.gov
- Telephone: +1 (865) 241-3952
References
Byrd, K. B., Ballanti, L., Thomas, N., Nguyen, D., Holmquist, J. R., Simard, M., Windham-Myers, L. 2018. A remote sensing-based model of tidal marsh aboveground carbon stocks for the conterminous United States. ISPRS Journal of Photogrammetry and Remote Sensing. 139, 255-271. https://doi.org/10.1016/j.isprsjprs.2018.03.019
Byrd, K., Ballanti, L., Thomas, N., Nguyen, D., Holmquist, J.R., Simard, M., Windham-Myers, L., Schile, L., Parker, V.T., Callaway, J.C., Vasey, M.C., Herbert, E.R., Davis, M., Woo, I., Cruz, S.D.L., Kroeger, K., Gonneea, M., Suttles, J.O.K., Megonigal, P., Lu, M., McFarland, L., Brooks, H., Drake, B., Peresta, G., Peresta, A., Troxler, T., Castaneda, E., 2017. Tidal marsh biomass field plot and remote sensing datasets for six regions in the conterminous United States. U.S. Geolog. Surv. Data Release. https://doi.org/10.5066/F77943K8
Mcowen, C.J., Weatherdon, L.V., Bochove, J.-W.V., Sullivan, E., Blyth, S., Zockler, C., Stanwell-Smith, D., Kingston, N., Martin, C.S., Spalding, M., Fletcher, S., 2017. A global map of saltmarshes. Biodivers. Data J. 5. https://doi.org/10.3897/BDJ.5.e11764
NOAA Office for Coastal Management, 2015. NOAA Coastal Change Analysis Program (C-CAP) Regional Land Cover Database. Data collected 1995-present. Data accessed at www.coast.noaa.gov/digitalcoast/data/ccapregional, Charleston.