Documentation Revision Date: 2024-06-21
Dataset Version: 1
Summary
There are 216 data files in cloud-optimized GeoTIFF (.tif) format with this dataset.
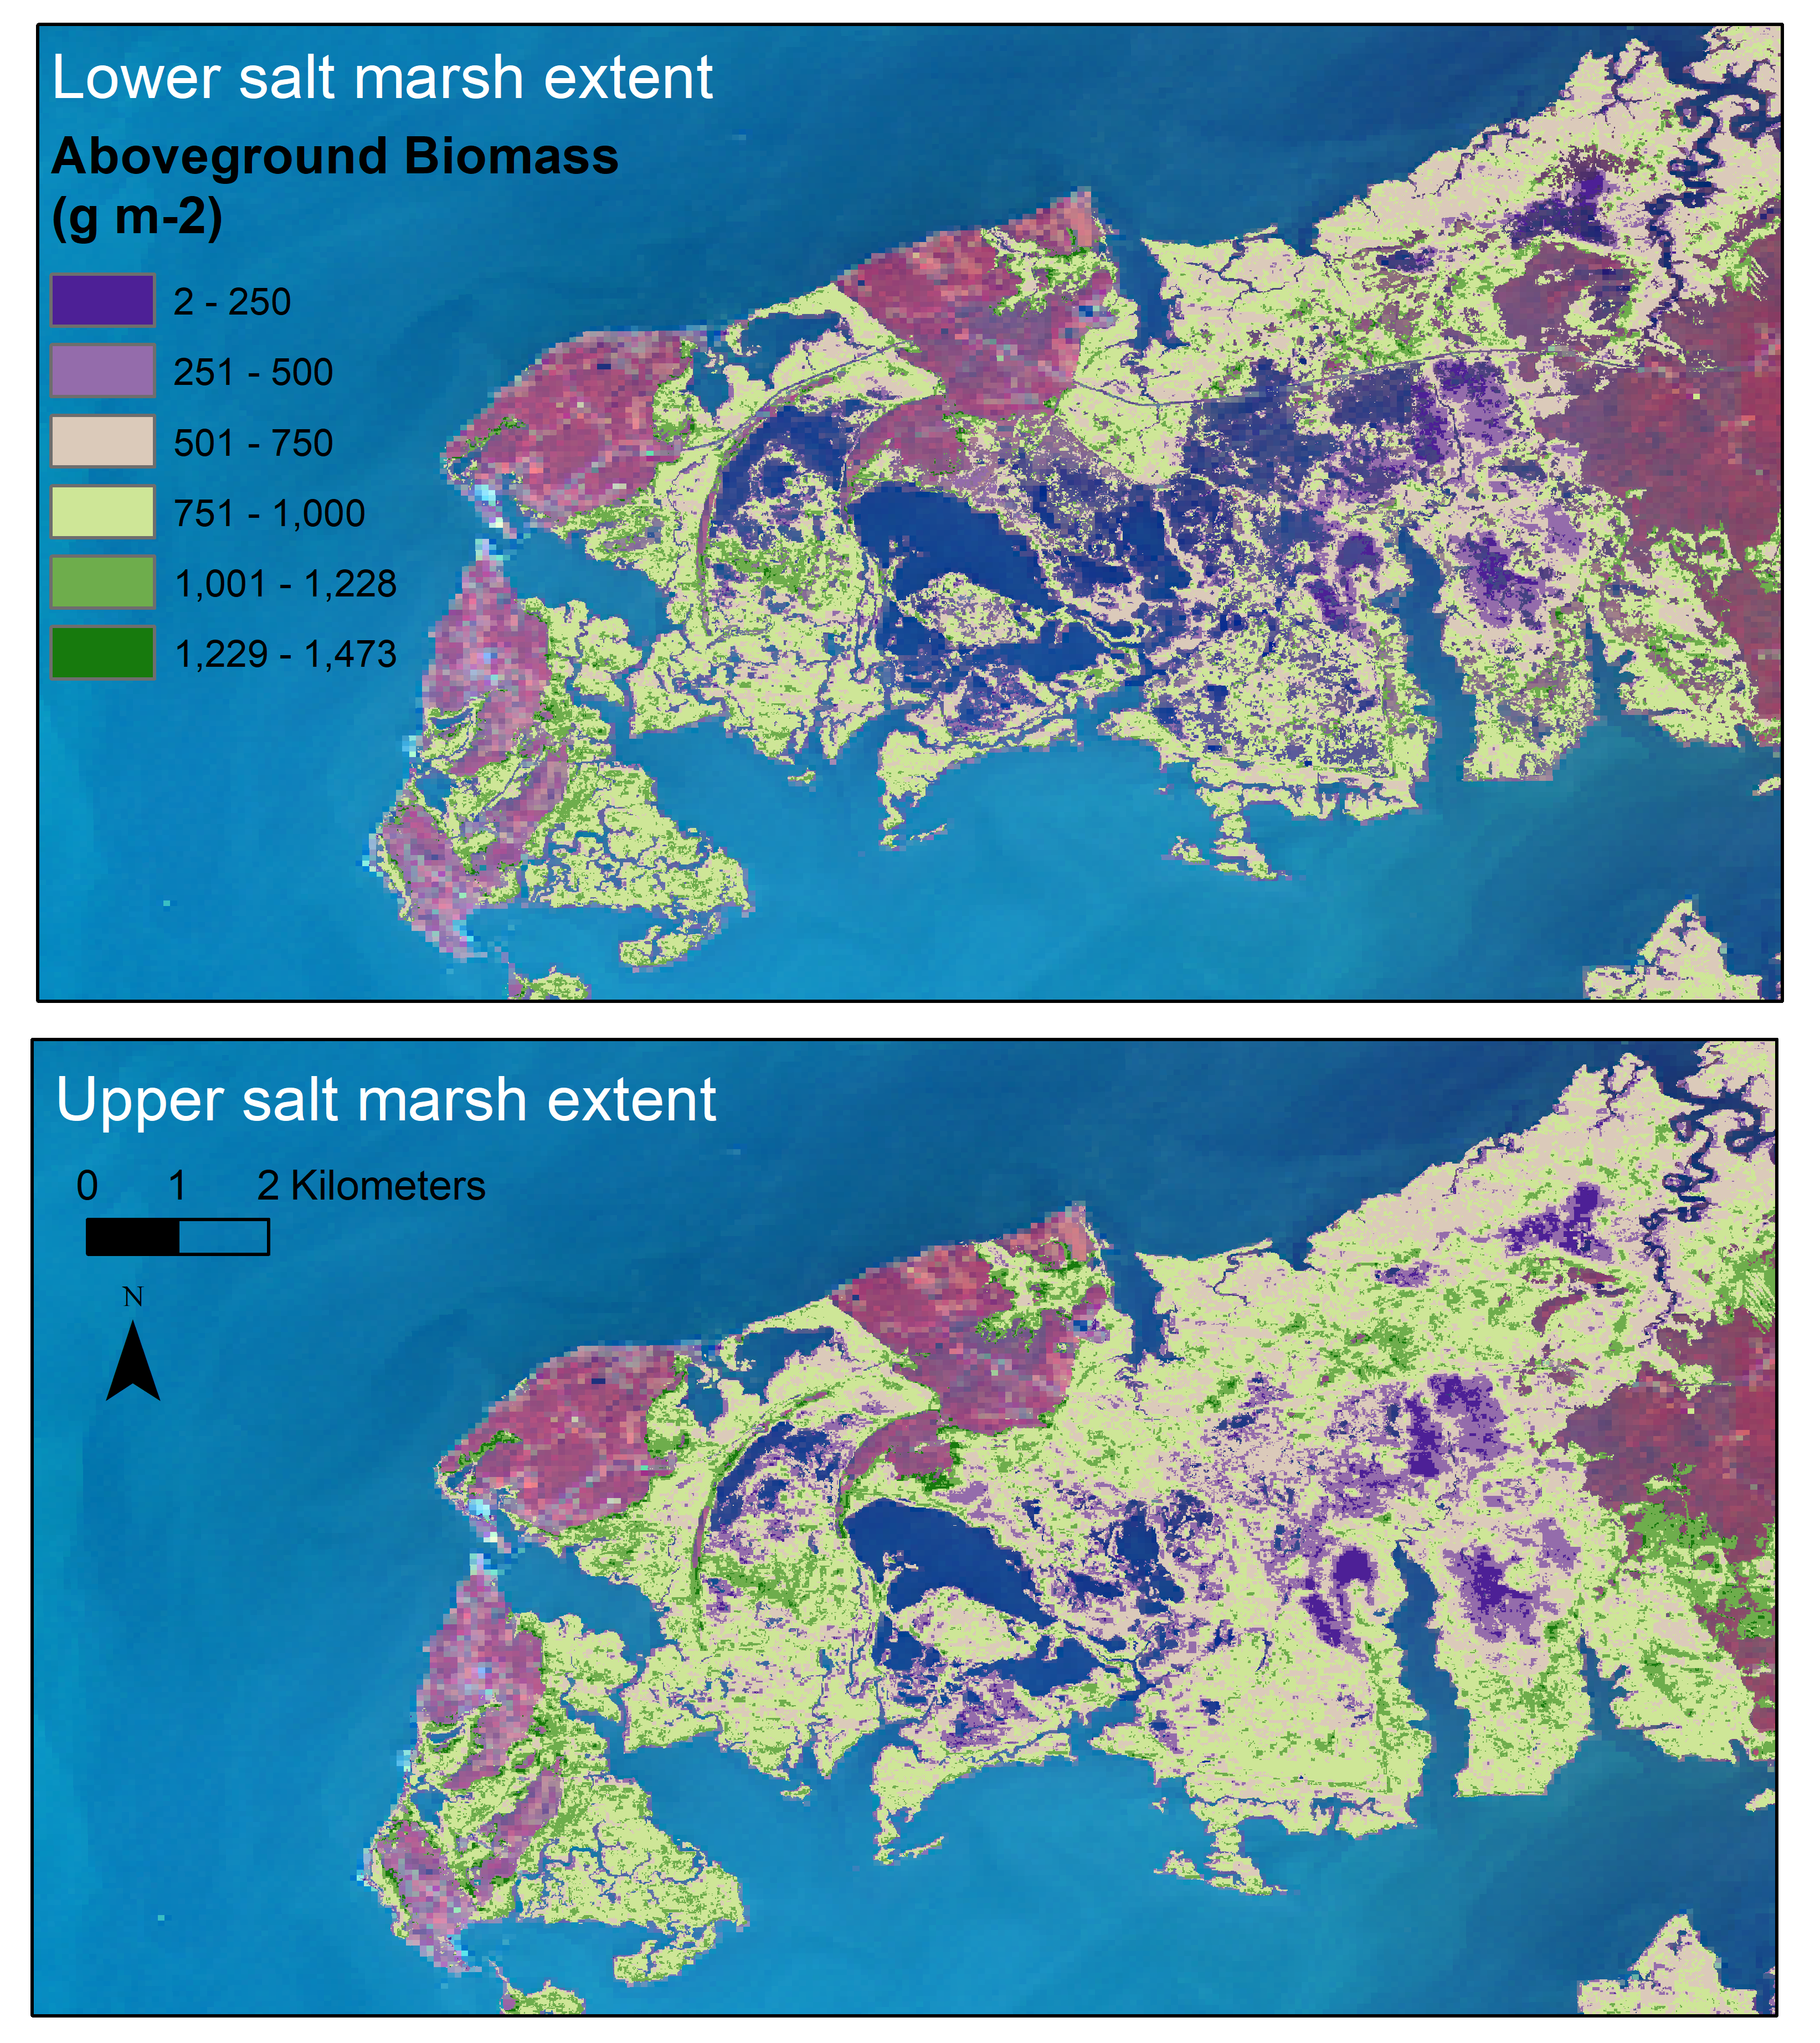
Figure 1. A visualization from the Chesapeake Bay displaying aboveground biomass and the upper and lower levels of salt marsh extent. Upper extent includes all areas within the lower extent. Background is Sentinel-2 imagery (NIR, G, B) for a section of Deal Island, Maryland.
Citation
Campbell, A., and L. Fatoyinbo. 2024. Aboveground Biomass Estimates for Salt Marsh for the Contiguous United States, 2020. ORNL DAAC, Oak Ridge, Tennessee, USA. https://doi.org/10.3334/ORNLDAAC/2348
Table of Contents
- Dataset Overview
- Data Characteristics
- Application and Derivation
- Quality Assessment
- Data Acquisition, Materials, and Methods
- Data Access
- References
Dataset Overview
This dataset provides estimates of aboveground biomass (AGB) and salt marsh extent in the contiguous United States for 2020 and includes all coastal watersheds across the contiguous United States at 10-m resolution. Estimates were generated by XGBoost machine learning regression. Salt marsh extent was classified using an ensemble of XGBoost, random forests, and support vector machines, trained with salt marsh location identified with the National Wetland Inventory (NWI). The data are organized by Hydrologic Unit Code (HUC) 6-digit basin. Within each HUC, the spatial extent of salt marsh and its uncertainty were estimated by machine learning and input data from NWI maps, the National Elevation Dataset, along with Sentinel-1 and Sentinel-2 imagery. Estimates were compared to in situ biomass data from salt marshes in Georgia and Massachusetts. The data are provided in cloud-optimized GeoTIFF format.
Project: Carbon Monitoring System
The NASA Carbon Monitoring System (CMS) program is designed to make significant contributions in characterizing, quantifying, understanding, and predicting the evolution of global carbon sources and sinks through improved monitoring of carbon stocks and fluxes. The System uses NASA satellite observations and modeling/analysis capabilities to establish the accuracy, quantitative uncertainties, and utility of products for supporting national and international policy, regulatory, and management activities. CMS data products are designed to inform near-term policy development and planning.
Related Publication
Campbell, A. and L. Fatoyinbo. 2024. Mapping aboveground biomass and carbon in salt marshes across the contiguous United States. Journal of Applied Remote Sensing. In review, 2024
Related Dataset
Byrd, K.B., L. Ballanti, N. Thomas, D. Nguyen, J.R. Holmquist, M. Simard, and L. Windham-Myers. 2021. Aboveground Biomass High-Resolution Maps for Selected US Tidal Marshes, 2015. ORNL DAAC, Oak Ridge, Tennessee, USA. https://doi.org/10.3334/ORNLDAAC/1879
Acknowledgments
This study was funded by the NASA Carbon Monitoring System (grant 16-CMS16-0073) and the NASA Postdoctoral Program.
Data Characteristics
Spatial Coverage: Coastal regions of contiguous U.S.
Spatial resolution: 10 m
Temporal coverage: 2020-01-01 to 2020-12-31
Temporal resolution: One-time estimate
Study Areas (All latitude and longitude given in decimal degrees)
| Sites | Westernmost Longitude | Easternmost Longitude | Northernmost Latitude | Southernmost Latitude |
|---|---|---|---|---|
| Coastal areas of the contiguous U.S. | -124.7400 | -66.935 | 49.00417 | 24.51806 |
Data file information
There are 216 data files in cloud optimized GeoTIFF (.tif) format.
Each data file provides estimates of aboveground biomass (g m-2) in salt marsh ecosystems. Each file covers the extent of a single HUC-6 basin. For each HUC, three maps are provided corresponding to the estimated spatial extent of salt marsh in the HUC. Extents include the mean estimate of extent as well as extents based on the upper and lower confidence limits of the mean.
GeoTIFFs are in projected coordinates using NAD 1983 UTM Zones from 10N to 19N. The spatial resolution is 10 m.
The file naming convention is bio_<huc>_<ext>0.tif (e.g., bio_010500_ex0.tif), where
- <huc> is the basin-level 6-digit HUC
- <ext> - extent of salt marsh: "ex" = mean estimate, "l" = lower confidence limit, "u" = upper confidence limit
- The "0" after <ent> indicates that pixels with 0 g m-2 of aboveground biomass were masked out.
Application and Derivation
These maps of aboveground biomass (AGB) are useful for research into carbon stocks of these wetlands. The related analysis (Campbell and Fatoyinbo, 2024) demonstrated the major drivers of AGB are relative sea-level rise (RSLR), temperature, precipitation, and tidal amplitude. RSLR, temperature, and precipitation are forecasted to change significantly due to climate change, and as such, the future AGB of these ecosystems will change. Increases in temperature and RSLR rates could result in temporary increases in AGB in these ecosystems; however, continued increases in these drivers would result in a loss of ABG. These results point to concerns for salt marsh health into the future including low AGB in drought conditions, high temperature environments, and under high rates of RSLR. While AGB was higher in moderate RSLR areas, it abruptly declined around 5 mm yr-1. The complex relationships between drivers and AGB suggest the importance of continuous monitoring of these ecosystems. National AGB monitoring in salt marsh environments is an important next step for improving coastal carbon monitoring. This work also demonstrates that spatial uncertainty on the extent and change of salt marsh environments makes repeat monitoring critical.
Quality Assessment
An accuracy assessment was conducted across the contiguous US with a stratified random sample of 10,000 points. The overall accuracy was 96.34%. For salt marsh extent, a confidence interval was estimated using the methods of Olofsson et al. (2014) as 3175.581 km2; this value was slightly less than the confidence interval derived from the machine learning approach (3473.5 km2). Data from Byrnes (2020) were used to assess accuracy of marsh AGB estimates.
For AGB modeling, salt marsh pixels were selected for temporal stability based on a time series satellite data. These 530 pixels along with 193 points from the Georgia Coastal Ecosystem Long Term Ecological Research Reserve (GCE LTER) were used to create a “stable” dataset for model training. Models from the stable training data were compared to models based on all training points (“complete” models, n = 984). The models based on the stable training data had a lower root mean squared error (RMSE). The XGBoost model based on stable training data had the best model performance.
Additional details about model performance and quality assessment are available in Campbell and Fatoyinbo (2024).
Data Acquisition, Materials, and Methods
Model input data were created from vegetation metrics based on Landsat, Sentinel-2, and Sentinel-1 imagery from 2020. Remote sensing data accessed via Google Earth Engine. The salt marsh extent was predicted utilizing training data collected from the National Wetland Inventory (NWI; USFWS, 2020) and visually verified for each basin.
Salt marsh extent refers to the spatial distribution of wetland pixels classified as salt marsh within each HUC 6-digit basin. The definition for this ecosystem closely matches class MFT1.3 saltmarshes and reedbeds from the IUCN Global Ecosystem Typology (Keith et al. 2022). Salt marsh extent was mapped at 10-m resolution using machine learning algorithms trained from verified points within NWI polygons for each basin. Training pixels were initially classified as salt marsh using NWI maps and then used to train multiple algorithms using imagery composites from Sentinel-1, Sentinel-2, and the National Elevation Dataset (NED). To estimate spatial uncertainty, multiple machine learning algorithm probabilities were used to calculate standard error and provide a mean estimate of marsh extent in each basin. This dataset includes maps of aboveground biomass (AGB) for mean estimate of extent as well as for extents based on the upper and lower confidence limits. The upper extent included all the marsh pixels identified by the mean and lower extent estimates. The upper extent typically included ecosystems such as tidal mudflats and ecotonal regions at the upland transition that were not classified as marsh pixels in the mean or lower extent estimates.
Aboveground biomass was predicted utilizing training data from Byrd et al. (2018) and the Georgia Coastal Ecosystems LTER Project and S.C. Pennings (2021) in combination with imagery metrics derived from satellite imagery. AGB was computed using XGBoost and compared to outputs from the other algorithms for our accuracy assessments.
Code used to generate these data is available at https://github.com/campban/biomass_sm
Additional details about methods are available in Campbell and Fatoyinbo (2024).
Data Access
These data are available through the Oak Ridge National Laboratory (ORNL) Distributed Active Archive Center (DAAC).
Aboveground Biomass Estimates for Salt Marsh for the Contiguous United States, 2020
Contact for Data Center Access Information:
- E-mail: uso@daac.ornl.gov
- Telephone: +1 (865) 241-3952
References
Byrd, K.B., L. Ballanti, N. Thomas, D. Nguyen, J.R. Holmquist, M. Simard, and L. Windham-Myers. 2021. Aboveground Biomass High-Resolution Maps for Selected US Tidal Marshes, 2015. ORNL DAAC, Oak Ridge, Tennessee, USA. https://doi.org/10.3334/ORNLDAAC/1879
Byrnes, J. 2020. PIE LTER plant biomass associated with marsh sites used in space for time sea level rise study, Rowley, MA. Environmental Data Initiative. https://doi.org/10.6073/pasta/895e4278b794533c94d3b3eee2211c93
Campbell, A. and L. Fatoyinbo. 2024. Mapping aboveground biomass and carbon in salt marshes across the contiguous United States. Journal of Applied Remote Sensing. In review, 2024.
Georgia Coastal Ecosystems LTER Project and S.C. Pennings. 2021. Fall 2019 plant monitoring survey -- biomass calculated from shoot height and flowering status of plants in permanent plots at GCE sampling sites 1-10, ver 9. Environmental Data Initiative. https://doi.org/10.6073/pasta/9418b615a46715305e14bffd9ccde40d
Keith, D.A., J.R. Ferrer-Paris, E. Nicholson, M.J. Bishop, B.A. Polidoro, E. Ramirez-Llodra, M.G. Tozer, J.L. Nel, R. Mac Nally, E.J. Gregr, K.E. Watermeyer, F. Essl, D. Faber-Langendoen, J. Franklin, C.E. R. Lehmann, A. Etter, D.J. Roux, J.S. Stark, J.A. Rowland, N.A. Brummitt, U.C. Fernandez-Arcaya, I.M. Suthers, S.K. Wiser, I. Donohue, L.J. Jackson, R.T. Pennington, T.M. Iliffe, V. Gerovasileiou, P. Giller, B.J. Robson, N. Pettorelli, A. Andrade, A. Lindgaard, T. Tahvanainen, A. Terauds, M.A. Chadwick, N.J. Murray, J. Moat, P. Pliscoff, I. Zager, and R.T. Kingsford. 2022. A function-based typology for Earth’s ecosystems. Nature 610:513–518. https://doi.org/10.1038/s41586-022-05318-4
Olofsson, P., G.M. Foody, M. Herold, S.V. Stehman, C.E. Woodcock, and M.A. Wulder. 2014. Good practices for estimating area and assessing accuracy of land change. Remote Sensing of Environment 148:42–57. https://doi.org/10.1016/j.rse.2014.02.015
USFWS. 2020. National Wetlands Inventory. U.S. Department of the Interior, Fish and Wildlife Service, Washington, D.C. https://www.fws.gov/program/national-wetlands-inventory