Documentation Revision Date: 2021-11-04
Dataset Version: 1
Summary
For each of the four variables (GPP, PAR, fC4, and SANIRv) and their uncertainties, the daily data are provided for each of 14 tiles for each day for the years 2000 thru 2019 with the following exceptions: (1) fC4 data are provided for the years 2000-2014 only. All fC4 uncertainty data is aggregated over all years and provided in 14 total files, one file per tile; and (2) there are no data files for GPP Uncertainty and SANIRv Uncertainty for January 2000, 1-16 February 2000, and 22-25 June 2001.
There are 612,416 files in GeoTIFF (.tif) format with this dataset.
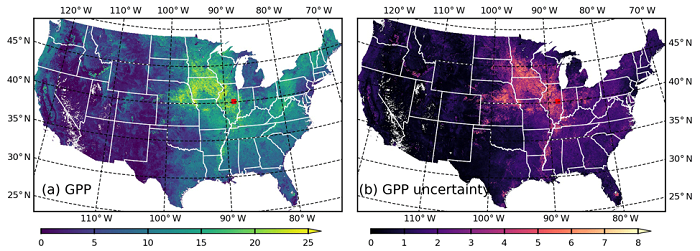
Figure 1. Spatial distribution of (a) GPP (gC m2/d) and (b) GPP uncertainty (gC m2/d) across the CONUS at 250-m resolution for 10 July 2020 (image source: Jiang et al. 2021).
Citation
Jiang, C., and K. Guan. 2020. MODIS-based GPP, PAR, fC4, and SANIRv estimates from SLOPE for CONUS, 2000-2019. ORNL DAAC, Oak Ridge, Tennessee, USA. https://doi.org/10.3334/ORNLDAAC/1786
Table of Contents
- Dataset Overview
- Data Characteristics
- Application and Derivation
- Quality Assessment
- Data Acquisition, Materials, and Methods
- Data Access
- References
Dataset Overview
This dataset contains estimated gross primary productivity (GPP), photosynthetically active radiation (PAR), soil adjusted near infrared reflectance of vegetation (SANIRV), the fraction of C4 crops in vegetation (fC4), and their uncertainties for the conterminous United States (CONUS) from 2000 to 2019. The daily estimates are SatelLite Only Photosynthesis Estimation (SLOPE) products at 250-m resolution. There are three distinct features of the GPP estimation algorithm: (1) SLOPE couples machine learning models with MODIS atmosphere and land products to accurately estimate PAR, (2) SLOPE couples gap-filling and filtering algorithms with surface reflectance acquired by both Terra and Aqua MODIS satellites to derive a soil-adjusted NIRV (SANIRV) dataset, and (3) SLOPE couples a temporal pattern recognition approach with a long-term Crop Data Layer (CDL) product to predict dynamic C4 crop fraction. PAR, SANIRV and C4 fraction are used to drive a parsimonious model with only two parameters to estimate GPP, along with a quantitative uncertainty, on a per-pixel and daily basis. The slope GPP product has an R2 = 0.84 and a root-mean-square error (RMSE) of 1.65 gC m-2 d-1.
For each of the four variables (GPP, PAR, fC4, and SANIRv) and their uncertainties, the daily data are provided for each of 14 tiles for each day for the years 2000 thru 2019 with the following exceptions: (1) fC4 data are provided for the years 2000-2014 only. All fC4 uncertainty data is aggregated over all years and provided in 14 total files, one file per tile; and (2) there are no data files for GPP Uncertainty and SANIRv Uncertainty for January 2000, 1-16 February 2000, and 22-25 June 2001.
Project: Carbon Monitoring System (CMS)
The NASA Carbon Monitoring System (CMS) is designed to make significant contributions in characterizing, quantifying, understanding, and predicting the evolution of global carbon sources and sinks through improved monitoring of carbon stocks and fluxes. The System will use the full range of NASA satellite observations and modeling/analysis capabilities to establish the accuracy, quantitative uncertainties, and utility of products for supporting national and international policy, regulatory, and management activities. CMS will maintain a global emphasis while providing finer scale regional information, utilizing space-based and surface-based data and will rapidly initiate generation and distribution of products both for user evaluation and to inform near-term policy development and planning.
Related Publications
Jiang, C., K. Guan, G. Wu, B. Peng, and S. Wang. 2021. A daily, 250 m and real-time gross primary productivity product (2000–present) covering the contiguous United States, Earth System Science Data 13:281–298. https://doi.org/10.5194/essd-13-281-2021
Related Dataset
Hagen, S., Harris, N., Saatchi, S.S., Pearson, T., Woodall, C.W., Ganguly, S., Domke, G.M., Braswell, B.H., Walters, B.F., Jenkins, J.C., Brown, S., Salas, W.A., Fore, A., Yu, Y., Nemani, R.R., Ipsan, C., Brown, K.R., 2016. CMS: Forest Carbon Stocks, Emissions, and Net Flux for the Conterminous US: 2005-2010. ORNL DAAC. https://doi.org/10.3334/ORNLDAAC/1313
Acknowledgments
This work was funded by NASA CMS grant 80NSSC18K0170.
Data Characteristics
Spatial Coverage: Contiguous US
Spatial Resolution: 250 m
Temporal Coverage: 2000-01-01 to 2019-12-31
Temporal Resolution: Daily
Study Area: Latitude and longitude are given in decimal degrees.
| Sites | Westernmost Longitude | Easternmost Longitude | Northernmost Latitude | Southernmost Latitude |
|---|---|---|---|---|
| CONUS | -155.573 | -52.216 | 50.000 | 20.000 |
Data File Information
There are 612,416 datasets in GeoTIFF (.tif) format with this dataset. For each of the four variables (GPP, PAR, fC4, and SANIRv) and their uncertainties, the daily data are provided for each of 14 tiles, for each day, for the years 2000 thru 2019 with the following exceptions:
- fC4 data are annual data and are only provided for the years 2000-2014. All fc4 uncertainty data for all years are provided in 14 total files, one file per tile.
- There are no data files for GPP Uncertainty and SANIRv Uncertainty for January 2000, 1-16 February 2000, and 22-25 June 2001.
The files are named as Variable.YYYY.MM.DD.tile.tif and Variable_Uncertainty.YYYY.MM.DD.tile.tif, where ...
- Variable = GPP, PAR, SANIRv or fC4 (Table 1)
- YYYY.MM.DD = date in year, month, day
- tile = one of 14 tiles: ho8v04, h08v05, h08v06, h09vo04, h09v05, h09v06, h10vo04, h10vo5, h10v06, h11vo04, h11v05, h12vo04, h12v05, and h13vo04 (Figure 2).
Example file names:
GPP.2001.01.01.h08v04.tif, GPP_Uncertainty.2002.01.01.h08v04.tif
PAR.2000.01.01.h08v04.tif, PAR_Uncertainty.2000.01.01.h08v04.tif
Table 1. Variables in the GeoTIFF files
| Variable | Description | Unit | Range | Scale factor | Frequency |
| GPP | Gross Primary Productivity | gC m-2 d-1 | 0–32.5 | 0.001 | Daily |
| GPP_Uncertainty | GPP uncertainty derived from SLOPE model parameter uncertainties quantified by the evaluation against AmeriFlux ground truth; the uncertainty of predicted dynamic C4 fraction quantified by the evaluation against CDL C4 fraction | gC m-2 d-1 | 0–32.5 | 0.001 | Daily |
| PAR | Photosynthetically Active Radiation | MJ m-2 d-1 | 0–15 | 0.001 | Daily |
| PAR_Uncertainty | PAR uncertainty quantified by the standard deviation of four machine learning models | MJ m-2 d-1 | 0–15 | 0.001 | Daily |
| SANIRv | Soil adjusted near infrared reflectance of vegetation | 1 | 0–0.6 | 0.0001 | Daily |
| SANIRV_Uncertainty | SANIRv uncertainty quantified by the standard deviation of a 7-day time window | 1 | 0–0.6 | 0.0001 | Daily |
| fC4 | Dynamic C4 crop fraction derived from a temporal pattern recognition approach applied to a long-term Crop Data Layer (CDL) product | 1 | 0–1 | 0.0001 | Annual |
| fC4_Uncertainty | fC4 uncertainty quantified by the evaluation against CDL C4 fraction | 1 | 0–1 | 0.0001 | Static |
Data File Details
All data are projected in the standard MODIS Land Integerized Sinusoidal tile map projection (Figure 2). Each processing tile is 4800 pixels by 4800 pixels, representing approximately 1200 km by 1200 km land region. The nodata (filled) value is -9999, and each GeoTIFF has a single band.
Application and Derivation
This product is developed to address a critical gap in estimating GPP over continental scales using remotely sensed data sources. The estimate method leverages a number of MODIS land and atmosphere products.
Quality Assessment
Uncertainty data are provided with this dataset.
Uncertainty of GPP is estimated as
dGPP = (fC4 x PAR x SANIRV) x dcC4 + [(1 - fC4) x PAR x SANIRV] x dcC3 + [(cC4-cC3) x PAR x SANIRV] x dfC4 + {[cC4 x fC4 + cC3 x (1 - fC4)] x SANIRV} x dPAR + {[cC4 x fC4 + cC3 x (1 - fC4)] x PAR} x dSANIRV,
where dcC4 and dcC3 are model parameter uncertainties quantified by the evaluation against AmeriFlux ground truth. dfC4 is the uncertainty of predicted dynamic C4 fraction quantified by the evaluation against the Crop Data Layer's C4 fraction. dPAR is the uncertainty of PAR quantified by the standard deviation of four machine learning models. dSANIRV is the uncertainty of SANIRV quantified by the standard deviation of a 7-day time window. Refer to Jiang et al. (2021) for additional details.
Data Acquisition, Materials, and Methods
The data were produced using the SLOPE GPP estimation algorithm which has three distinct features: (1) SLOPE couples machine learning models with MODIS atmosphere and land products to accurately estimate PAR, (2) SLOPE couples efficient gap-filling and filtering algorithms with surface reflectance acquired by both Terra and Aqua MODIS satellites to derive a soil-adjusted NIRV (SANIRv) dataset, and (3) SLOPE couples a temporal pattern recognition approach with a long-term Crop Data Layer (CDL) product to predict the dynamic fraction of C4 crops in total vegetation. PAR, SANIRV and C4 fraction are used to drive a parsimonious model with only two parameters to estimate GPP, along with a quantitative uncertainty, on a per-pixel and daily basis. SLOPE was calibrated using the GPP data derived from AmeriFlux site observations.
All data are projected in the standard MODIS Land Integerized Sinusoidal tile map projection (Figure 2). Each processing tile is 4800 pixels by 4800 pixels, representing approximately 1200 km by 1200 km land region.
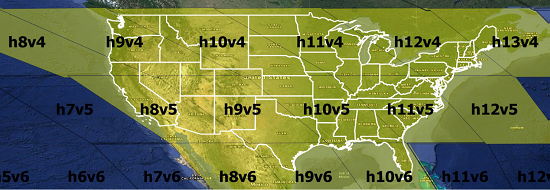
Figure 2. MODIS tiles covering the CONUS.
Estimating GPP
GPP was estimated by combining data from Terra and Aqua MODIS satellite instrument with a Crop Data Layer (CDL) product. Because MODIS provides long-term and real-time (2000–present) observations of red (RedRef) and NIR (NIRRef) reflectance and atmospheric conditions with high spatial (250 m for reflectance and 1 km for atmosphere) and temporal (daily) resolutions, MODIS can be used to generate an observation-based GPP product. The GPP model used for this dataset was
GPP = [ cC4 x fC4 x cC3 x (1 - fC4) ] x PAR x SANIRV,
where cC4 and cC3 are model parameters representing C3 and C4, respectively, vegetation cover. The remaining parameters are described below. See Jiang et al. (2021) for details of these calculations.
NIRV and SANIRv
Near-infrared reflectance of vegetation (NIRV,Ref), defined as the product of the normalized difference vegetation index (NDVI) and observed NIR reflectance (NIRRef), has recently been presented as a proxy of GPP (Badgley et al., 2017).
NIRV,Ref = NDVI × NIRRef = [( NIRRef − RedRef ) / ( NIRRef + RedRef )] x NIRRef
where NIRV,Peak is the maximum value of the multi-year average NIRV,Ref time series on a per-pixel basis.
Moreover, a soil-adjusted measure of near-infrared reflectance of vegetation (SANIRV) is available from MODIS.
SANIRV = [( NIRV,Ref − NIRV,Soil ) / ( NIRV,Peak − NIRV,Soil )] x NIRV,Peak,
SANIRV does not change substantially with NIRV,Peak but is more sensitive to low NIRV,Ref values. SANIRV was set to 0 when NIRV,Ref ≤ NIRV,Soil. In general, SANIRV is supposed to be smooth within a short time period; therefore, the standard deviation within the ±3 day temporal window was calculated as uncertainty.
PAR
SLOPE adopts several machine learning approaches to compute PAR using forcing data mainly from Terra and Aqua MODIS Atmosphere and Land products. Machine learning approaches were used to upscale the ground truth to satellite data. The ground truth was from the Surface Radiation Budget (SURFRAD) Network (Augustine et al., 2000), including seven long-term continuous sites across the CONUS. Daily-mean shortwave radiation (SWR) and PAR on the surface were calculated from site observations at 1-3 min intervals from 2000 through 2018. Daily mean top-of-atmosphere SWR (SWRTOA) was calculated using latitude and day-of-year (DOY) information (Allen et al., 1998). Subsequently, atmospheric transmittance (tSWR) and proportion of PAR in SW (pPAR) were calculated as SWR / SWRTOA and PAR / SWR.
fC4 and CDL data
A National Land Cover Database (NLCD; Homer et al., 2004; https://www.mrlc.gov/) along with a crop-specific land cover product Cropland Data Layer (CDL; Boryan et al., 2011; https://nassgeodata.gmu.edu/CropScape) were used to derive the fraction cover of C4 crop in vegetation (fC4). The fraction of C4 crop in vegetated areas was first derived using existing CDL data. NLCD land cover types were categorized into vegetated areas and non-vegetated areas with 30 m resolution. The fraction of vegetated areas in total area was subsequently calculated for each 250-m pixel. Similarly, CDL crop types were categorized into C4-planted areas and non-C4 areas with 30 m resolution. The fraction of C4 crops in total area was subsequently calculated for each pixel. The ratio of the fraction of C4 crops in total area to the fraction of vegetated areas in total area was calculated to derive the fraction of C4 crops in vegetated areas (fC4) at 250-m resolution. Since NLCD data were not available for every year, an assumption was made that 1 year of NLCD data can represent adjacent years.
Refer to Jiang et al. (2021) for additional details.
Data Access
These data are available through the Oak Ridge National Laboratory (ORNL) Distributed Active Archive Center (DAAC).
MODIS-based GPP, PAR, fC4, and SANIRv estimates from SLOPE for CONUS, 2000-2019
Contact for Data Center Access Information:
- E-mail: uso@daac.ornl.gov
- Telephone: +1 (865) 241-3952
References
Allen, R.G., L.S. Pereira, D. Raes, and M. Smith. 1998. Crop evapotranspiration-Guidelines for computing crop water requirements. FAO Irrigation and drainage paper 56, Italy: Rome. Accessed 20 January 2021. http://www.fao.org/3/x0490E/x0490e00.htm
Augustine, J.A., J.J. DeLuisi, and C.N. Long. 2000. SURFRAD – A national surface radiation budget network for atmospheric research. Bulletin of the American Meteorological Society 81:2341–2357. https://doi.org/10.1175/1520-0477(2000)081<2341:SANSRB>2.3.CO;2
Badgley, G., L.D. Anderegg, J.A. Berry, and C.B. Field. 2019. Terrestrial gross primary production: using NIRV to scale from site to globe. Global Change Biology 25:3731–3740. https://doi.org/10.1111/gcb.14729
Boryan, C., Z. Yang, R. Mueller, and M. Craig. 2011. Monitoring US agriculture: the US Department of Agriculture, National Agricultural Statistics Service, Cropland Data Layer Program. Geocarto International 26:341-358. https://doi.org/10.1080/10106049.2011.562309
Homer, C., C. Huang, L. Yang, B. Wylie, and M. Coan. 2004. Development of a 2001 National Land-Cover Database for the United States. Photogrammetric Engineering & Remote Sensing 70:829-840. https://doi.org/10.14358/PERS.70.7.829
Jiang, C., K. Guan, G. Wu, B. Peng, and S. Wang. 2021. A daily, 250 m and real-time gross primary productivity product (2000–present) covering the contiguous United States, Earth System Science Data 13:281–298. https://doi.org/10.5194/essd-13-281-2021