Documentation Revision Date: 2021-02-22
Dataset Version: 1
Summary
A semi-empirical model was developed to spatially downscale the TROPOMI footprint SIF data and express the total SIF of a mixed pixel (i.e., a pixel containing more than one vegetation type) as the sum of SIF of each vegetation type (i.e., corn, soybean, grass/pasture, forest) weighted by its land cover fraction. Three independent datasets were used for model validation and estimates of uncertainty were derived for each SIF component and vegetation type-specific SIF estimate.
There are 6 files in netCDF (*.nc) format provided with this dataset including PAR, fPAR, SIFyield, land cover fractions, SIF estimates for specific vegetation types, and total SIF. Total SIF is provided under both clear-sky and real-cloudy sky conditions.
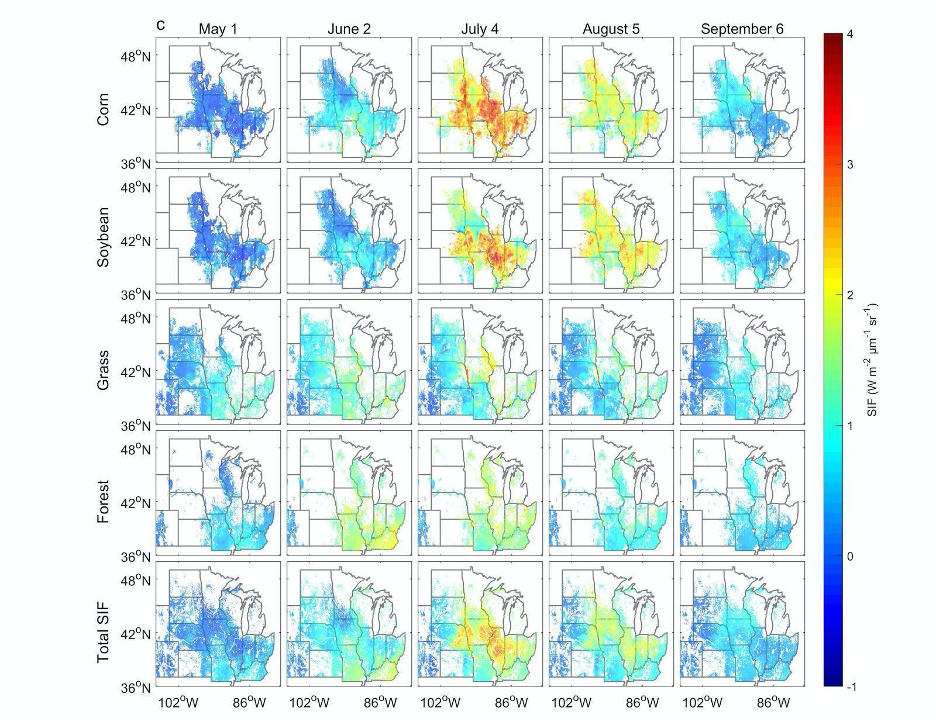
Figure 1. Examples of spatial patterns of reconstructed SIF at 4 km resolution. Only pixels with a fraction of the specific vegetation type larger than 0.1 are shown. For Total SIF, only pixels with a fraction of corn, soybean, grass/pasture, and forest larger than 0.8 are displayed. Source: Wang et al., 2020.
Citation
Wang, C., K. Guan, B. Peng, C. Jiang, J. Peng, G. Wu, C. Frankenberg, P. Koehler, X. Yang, Y. Cai, and Y. Huang. 2021. High Resolution Land Cover-Specific Solar-Induced Fluorescence, Midwestern USA, 2018. ORNL DAAC, Oak Ridge, Tennessee, USA. https://doi.org/10.3334/ORNLDAAC/1813
Table of Contents
- Dataset Overview
- Data Characteristics
- Application and Derivation
- Quality Assessment
- Data Acquisition, Materials, and Methods
- Data Access
- References
Dataset Overview
This dataset provides estimated solar-induced chlorophyll fluorescence (SIF) of specific vegetation types and total SIF under clear-sky and real/cloudy conditions at a resolution of 4 km for the Midwest USA. The estimates are 8-day averaged daily means over the 2018 crop growing season for the time period 2018-05-01 to 2018-09-29. SIF of a specific vegetation type (i.e., corn, soybean, grass/pasture, forest) was expressed as the product of photosynthetically active radiation (PAR), the fraction of photosynthetically active radiation absorbed by the canopy (fPAR), and canopy SIF yield (SIFyield) for each vegetation type. Uncertainty of each variable was also calculated and is provided. These components of the SIF model were derived using a TROPOspheric Monitoring Instrument (TROPOMI) dataset, the USDA National Agricultural Statistics Service Cropland Data Layer, and the MODIS MCD15A2H 8-day 500 m fPAR product. These data could be used to improve estimates of vegetation productivity and vegetation stress.
A semi-empirical model was developed to spatially downscale the TROPOMI footprint SIF data and express the total SIF of a mixed pixel (i.e., a pixel containing more than one vegetation type) as the sum of SIF of each vegetation type (i.e., corn, soybean, grass/pasture, forest) weighted by its land cover fraction. Three independent datasets were used for model validation and estimates of uncertainty were derived for each SIF component and vegetation type-specific SIF estimate.
Project: Carbon Monitoring System
The NASA Carbon Monitoring System (CMS) program is designed to make significant contributions in characterizing, quantifying, understanding, and predicting the evolution of global carbon sources and sinks through improved monitoring of carbon stocks and fluxes. The System uses NASA satellite observations and modeling/analysis capabilities to establish the accuracy, quantitative uncertainties, and utility of products for supporting national and international policy, regulatory, and management activities. CMS data products are designed to inform near-term policy development and planning.
Related Publication
Wang, C., K. Guan, B. Peng, M. Chen, C. Jiang, Y. Zeng, G. Wu, S. Wang, J. Wu, X. Yang, C. Frankenberg, P. Köhler, J. Berry, C. Bernacchi, K. Zhu, C. Alden, and G. Miao. 2020. Satellite footprint data from OCO-2 and TROPOMI reveal significant spatio-temporal and inter-vegetation type variabilities of solar-induced fluorescence yield in the U.S. Midwest. Remote Sensing of Environment 241:111728. https://doi.org/10.1016/j.rse.2020.111728
Related Dataset
Yu, L., J. Wen, C.Y. Chang, C. Frankenberg, and Y. Sun. 2019. High Resolution Global Contiguous SIF Estimates Derived from OCO-2 SIF and MODIS. ORNL DAAC, Oak Ridge, Tennessee, USA. https://doi.org/10.3334/ORNLDAAC/1696
Acknowledgments
This work was supported by the Carbon Monitoring System Program (grant 80NSSC18K0170), NASA's New Investigator Program (grant NNX16AI56G), and the Carbon Cycle Science Program (grant NNX17AE14G).
Data Characteristics
Spatial Coverage: Midwest, USA, including 15 states: Colorado, Illinois, Indiana, Iowa, Kansas, Kentucky, Michigan, Minnesota, Missouri, Nebraska, North Dakota, Ohio, South Dakota, Wisconsin, Wyoming
Spatial Resolution: 0.041667 degrees (~4 km)
Temporal Coverage: 2018-05-01 to 2018-09-29
Temporal Resolution: 8-day
Study Area: Latitude and longitude are given in decimal degrees.
| Site | Northernmost Latitude | Southernmost Latitude | Easternmost Longitude | Westernmost Longitude |
|---|---|---|---|---|
| Midwest USA | 49.9375 | 34.979167 | -77.979167 | -110.02083 |
Data File Information
There are 6 files in netCDF (*.nc) format provided with this dataset including PAR, fPAR, SIFyield, land cover fractions, SIF estimates for specific vegetation types, and total SIF. Total SIF is provided under both clear-sky and real-cloudy sky conditions. Variables, descriptions, and units, are provided in the netCDF files. SIF estimate values are 8-day averaged daily means.
The file naming convention is midwest_variable_2018.nc, where variable = fpar, par, sif_cloud, sif_nocloud, sify, or veg_fraction.
Table 1. File names and descriptions.
| File Names | Description |
|---|---|
| midwest_fpar_2018.nc | The fraction of absorbed photosynthetically active radiation (fPAR) absorbed by the canopy and uncertainty for corn, soybean, forest, and grass. The data were generated from the USDA NASS Cropland Data Layer and MODIS product MCD15A2H. |
| midwest_par_2018.nc | The daily mean photosynthetically active radiation (PAR) and its uncertainty. Two versions of PAR are provided, PAR with and without clouds (i.e., simulated under real/unclear and clear sky conditions, respectively). The data were generated from the BESS model. |
| midwest_sif_cloud_2018.nc | Solar-induced chlorophyll fluorescence (SIF) with clouds (i.e., simulated under real/unclear sky condition) and its uncertainty for corn, soybean, forest, grass, and total. The data were generated from the USDA NASS Cropland Data Layer, MODIS product MCD15A2H, PAR (with clouds) from the BESS model, and TROPOMI SIF footprint data. SIF values are 8-day averaged daily means. |
| midwest_sif_nocloud_2018.nc | Solar-induced chlorophyll fluorescence (SIF) without clouds (i.e., simulated under clear sky condition) and its uncertainty for corn, soybean, forest, grass, and total. The data were generated from the USDA NASS Cropland Data Layer, MODIS product MCD15A2H, PAR (without clouds) from the BESS model, and TROPOMI SIF footprint data. SIF values are 8-day averaged daily means. |
| midwest_sify_2018.nc | The observed SIF per photon absorbed by the canopy (SIFyield) and its uncertainty for corn, soybean, forest, and grass. Two versions of SIFyield are provided, temporally smoothed and unsmoothed SIFyield. The data were generated from the USDA NASS Cropland Data Layer, MODIS product MCD15A2H, PAR from the BESS model, and TROPOMI SIF footprint data. |
| midwest_veg_fraction_2018.nc | The land cover fraction of the vegetation type for corn, soybean, forest, and grass. The data were generated from the USDA NASS Cropland Data Layer. |
Data File Details
Missing values are represented by "-9999."
Each file contains 359 rows and 769 columns.
The spatial reference system used is "WGS 84" EPSG:4326.
Application and Derivation
This dataset includes reconstructed SIF (and its components) that was spatially downscaled from TROPOMI footprint data using a semi-empirical model expressing the SIF of a "mixed" pixel (i.e., a pixel containing more than one vegetation type) as the sum of SIF of each vegetation type (i.e., corn, soybean, grass/pasture, and forest) weighted by its land cover fraction. The dataset has significant advantages over similar products. First, it provides the components used to reconstruct SIF, which could help interpret the SIF signal given varying light conditions, canopy structure, leaf pigment content, and physiological stress. Second, the product could improve the estimation of GPP from SIF given the potential difference in the SIF-GPP relationship for different vegetation types. Lastly, the product provides reconstructions of SIF using estimates of PAR with and without cloud cover.
Quality Assessment
Three datasets were used for model validation: the TROPOMI dataset 2, the OCO-2 SIF Lite product, version B8100r from https://co2.jpl.nasa.gov/, and ground-based measurements from three agricultural sites in the U.S. Corn Belt. The variance (i.e., the R2 value) between raw observations and reconstructed SIF values was 0.79 for the TROPOMI dataset 2, 0.83 for the OCO-2 SIF dataset, and 0.85-0.93 for the ground measurements. See Wang et al. (2020) for details.
Estimates of uncertainty for each variable are provided in the next section.
Data Acquisition, Materials, and Methods
Following is a synopsis of the methods described in detail in Wang et al. (2020).
Study Area
The spatial extent of the product spans 15 states in the U.S. Midwest including North Dakota, South Dakota, Nebraska, Kansas, Minnesota, Iowa, Missouri, Wisconsin, Illinois, Michigan, Indiana, Ohio, Kentucky, Wyoming (East to 107 °W), and Colorado (East to 107 °W). Corn, soybean, grass/pasture, and forest are the four dominant vegetation types in the area. The temporal extent of the product includes the crop growing season (May-September) of 2018. The time span was divided into 19 8-day intervals.
Estimating SIF
Solar-induced chlorophyll fluorescence (SIF) of vegetation is expressed as the product of photosynthetically active radiation (PAR), the fraction of PAR absorbed by the canopy (fPAR), and canopy SIF yield. SIFyield is the ratio of SIF observed in the direction of the sensor to PAR absorbed by canopies (Eq. 1).
 (1)
(1)
For a pixel containing more than one vegetation type and a total vegetation fraction greater than 0.80 (i.e., a "mixed" pixel), SIF was conceptualized as:
 (2)
(2)
where fi is the fraction of vegetation type i; SIFi is the SIF of vegetation type i; SIFyieldi is the SIFyield of vegetation type i; and n=4 is the number of vegetation types within a target pixel. SIF for herbaceous plants and woody plants were assumed to be the same as that of grass/pasture and forest, respectively. SIF of water bodies, bare area, and artificial objects (i.e., road and urban regions) were assumed to be equal to zero.
The uncertainty of SIF of vegetation type i (i.e., a pixel containing a single vegetation type) was estimated as:
 (3)
(3)
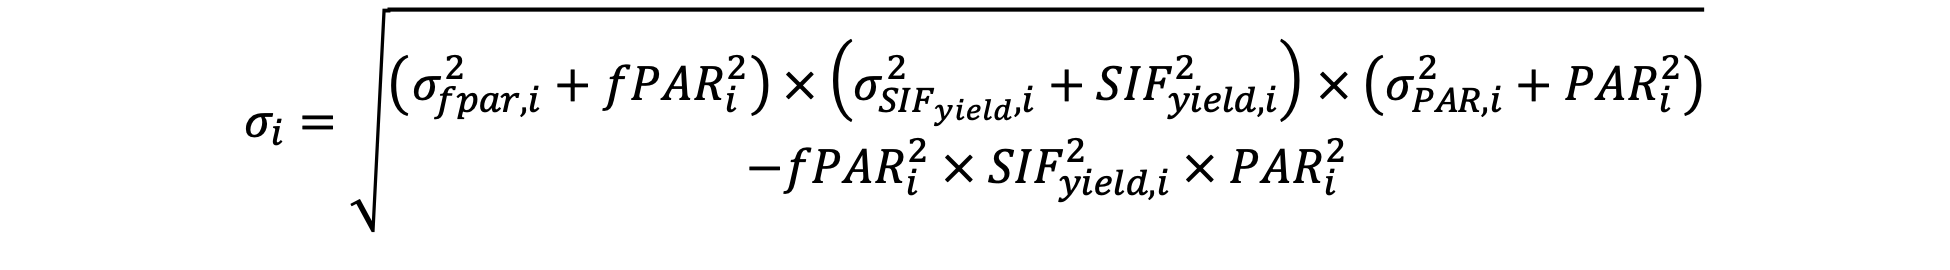
where the values of σ denote uncertainty of a specific variable of pixel i. The uncertainty of the mixed SIF (σ) was calculated as:
 (4)
(4)
The equations used to estimate each component and its respective uncertainty are provided below and follow the data processing steps summarized in Figure 2.
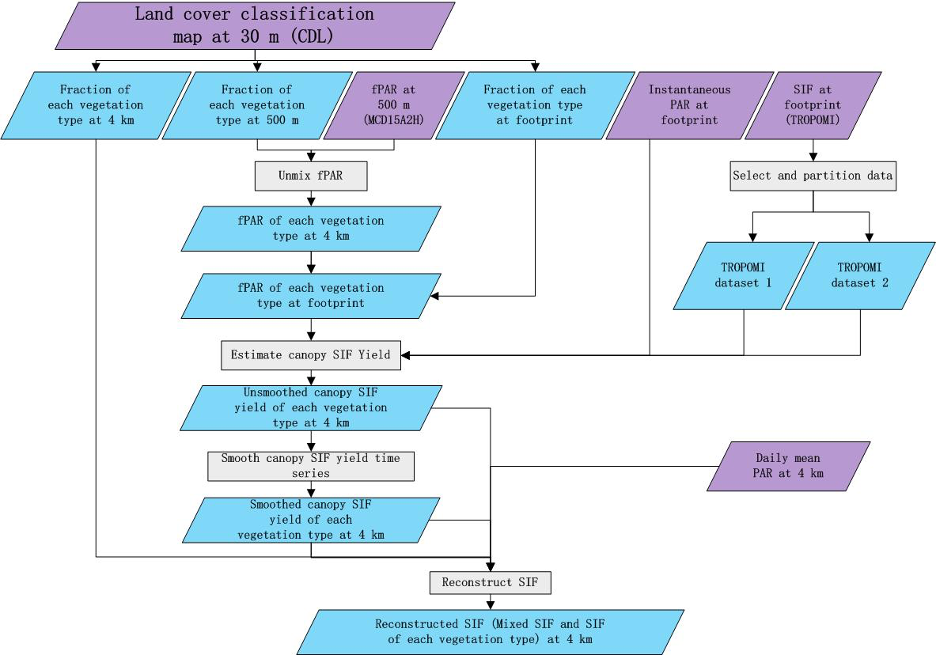
Figure 2. Processing steps for generating SIF. Violet boxes represent input data, grey boxes represent processing steps, and blue boxes represent output or intermediary datasets. Source: Wang et al., 2020
Estimating Land Cover Fraction and PAR
The land cover fraction of each vegetation type was calculated using the National Agricultural Statistics Service Cropland Data Layer (USDA) and included the vegetation types corn, soybean, grass/pasture, forest, general grass (i.e., all herbaceous plants excluding corn and soybean), and general forest (i.e., all woody plants). The PAR data were produced according to Ryu et al. (2018) and used the 8-day average of daily mean PAR. Two versions of PAR are provided; PAR with cloud (i.e., simulated under real/unclear sky condition) and PAR without cloud (i.e., simulated under clear sky condition).
Estimating fPAR
The MCD15A2H 8-day 500 m fPAR product (Myneni et al. 2015) was used to generate fPAR for each vegetation type, and a 4 km pixel (i.e., the target resolution) contained approximately 64 MODIS pixels. The value of fPAR in a MODIS pixel was expressed as a weighted sum of fPAR for each vegetation type:
 (5)
(5)
where n is the number of vegetation types within the MODIS pixel. fPAR of vegetation type i (fPARi) was assumed to be invariant within a 4 km pixel so that fPARi could be estimated by minimizing a loss function:
 (6)
(6)
where fPARj is the fPAR of MODIS pixel j, fij is the fraction of vegetation type i in MODIS pixel j, m is the number of MODIS pixels within the 4 km pixel.
Only MODIS pixels with a cumulative cover (of the four vegetation types) greater than 0.8 were included. fPAR for herbaceous plants and woody plants were assumed to be the same as that of grass/pasture and forest, respectively. fPAR for other land cover types (i.e., water bodies, bare areas, and artificial objects) was not assumed to be equal to zero because there is always a positive value for the MODIS fPAR. Therefore, the fifth land cover type was included in Equation 5.
Uncertainty of fPAR of vegetation type i (σfPAR,i) is the 8-day average of the daily mean uncertainty and was estimated as:

 (7)
(7)
If fPAR for a given pixel had a calculated uncertainty larger than 0.1, the estimate was considered invalid. Consequently, the mean of all the valid fPAR values within a 21 x 21-pixel neighborhood of the invalid pixel was used as the fPAR estimate. If there was no valid value within the 21 x 21-pixel neighborhood, a background value that was calculated as the mean of the study area was used.
Estimating SIFyield
TROPOMI footprint data (Köhler et al. 2018) were used to estimate SIFyield. TROPOMI data include measured reflected sunlight, which covers the near-infrared band (band 6, 727–775 nm) and makes SIF retrieval possible (Guanter et al. 2014; Köhler et al. 2015). For this dataset, only footprints with cloud coverage less than 0.3 and a total vegetation fraction greater than 0.80 were considered. The footprint data were randomly divided into two datasets for each 8-day period: 80% to TROPOMI "dataset 1" and 20% to TROPOMI "dataset 2."
SIFyield of vegetation type i was estimated by minimizing a loss function using TROPOMI dataset 1 as:

 (9)
(9)
where N is the number of TROPOMI footprints overlapping the target pixel, SIFj is the SIF of the footprint j, fij is the fraction of vegetation type i in footprint j, and n is the number of vegetation types. Different values of N were used to estimate SIFyield for each period and the value that resulted in the best reconstruction of SIF was used to estimate SIFyield again using TROPOMI dataset 2. SIFyield for herbaceous plants and woody plants were assumed to be the same as that of grass/pasture and forest, respectively. SIFyield of water bodies, bare area, and artificial objects (i.e., road and urban regions) were assumed to be equal to zero.
Uncertainty of the estimated SIFyield of vegetation type i was estimated as:

 (10)
(10)
If the estimated SIFyield of vegetation type i had an uncertainty value larger than 0.01, the estimate was considered invalid. An alternate estimate was calculated as the mean of the valid SIFyield values within a 21 x 21-pixel neighborhood of the invalid pixel. If there were no valid values within the 21 x 21-pixel neighborhood, a background value that was calculated as the mean of the study area was used.
A temporally smoothed version of SIFyield was calculated using the Savisky-Glay filter (Savitzky and Golay, 1964).
Data Access
These data are available through the Oak Ridge National Laboratory (ORNL) Distributed Active Archive Center (DAAC).
High Resolution Land Cover-Specific Solar-Induced Fluorescence, Midwestern USA, 2018
Contact for Data Center Access Information:
- E-mail: uso@daac.ornl.gov
- Telephone: +1 (865) 241-3952
References
Guanter, L., I. Aben, P. Tol, J.M. Krijger, A. Hollstein, P. Köhler, A. Damm, J. Joiner, and C. Frankenberg. 2015. Potential of the TROPOspheric Monitoring Instrument (TROPOMI) onboard the Sentinel-5 Precursor for the monitoring of terrestrial chlorophyll fluorescence. Atmospheric Measurement Techniques, 8:1337–1352. https://doi.org/10.5194/amt-8-1337-2015
Guanter, L., Y. Zhang, M. Jung, J. Joiner, M. Voigt, J.A. Berry, C. Frankenberg, A.R. Huete, P. Zarco-Tejada, J.-E. Lee, M.S. Moran, G. Ponce-Campos, C. Beer, G. Camps-Valls, N. Buchmann, D. Gianelle, K. Klumpp, A. Cescatti, J.M. Baker, and T.J. Griffis. 2014. Global and time-resolved monitoring of crop photosynthesis with chlorophyll fluorescence. Proceedings of the National Academy of Sciences, 111:E1327–E1333. https://doi.org/10.1073/pnas.1320008111
Köhler, P., C. Frankenberg, T.S. Magney, L. Guanter, J. Joiner, and J. Landgraf. 2018. Global Retrievals of Solar-Induced Chlorophyll Fluorescence With TROPOMI: First Results and Intersensor Comparison to OCO-2. Geophysical Research Letters, 45:10456-10463. https://doi.org/10.1029/2018GL079031
Köhler, P., L. Guanter, and J. Joiner. 2015. A linear method for the retrieval of sun-induced chlorophyll fluorescence from GOME-2 and SCIAMACHY data. Atmospheric Measurement Techniques, 8:2589–2608. https://doi.org/10.5194/amt-8-2589-2015
Myneni, R., Y. Knyazikhin, and T. Park. 2015. MCD15A2H MODIS/Terra+Aqua Leaf Area Index/FPAR 8-day L4 Global 500m SIN Grid V006. Distributed by NASA EOSDIS Land Processes DAAC. https://doi.org/10.5067/MODIS/MCD15A2H.006
Ryu, Y., C. Jiang, H. Kobayashi, and M. Detto. 2018. MODIS-derived global land products of shortwave radiation and diffuse and total photosynthetically active radiation at 5 km resolution from 2000. Remote Sensing of Environment, 204:812–825. https://doi.org/10.1016/j.rse.2017.09.021
Savitzky, A., and M.J.E. Golay. 1964. Smoothing and differentiation of data by simplified least squares procedures. Analytical Chemistry, 36:1627– 1639. https://doi.org/10.1021/ac60214a047
USDA Foreign Agricultural Service, 2018. World Agricultural Production. Circular Series WAP, 12–18, December. pp. 17–24 https://downloads.usda.library.cornell.edu/usda-esmis/files/5q47rn72z/qj72pc12b/sj1395841/production.pdf
USDA National Agricultural Statistics Service Cropland Data Layer. Published crop-specific data layer. USDA-NASS, Washington, DC. https://nassgeodata.gmu.edu/CropScape/
Wang, C., K. Guan, B. Peng, M. Chen, C. Jiang, Y. Zeng, G. Wu, S. Wang, J. Wu, X. Yang, C. Frankenberg, P. Köhler, J. Berry, C. Bernacchi, K. Zhu, C. Alden, and G. Miao. 2020. Satellite footprint data from OCO-2 and TROPOMI reveal significant spatio-temporal and inter-vegetation type variabilities of solar-induced fluorescence yield in the U.S. Midwest. Remote Sensing of Environment 241:111728. https://doi.org/10.1016/j.rse.2020.111728