Documentation Revision Date: 2021-10-29
Dataset Version: 1
Summary
There are 24 data files included in this dataset; 16 files in in comma-separated values (*.csv) format and 8 files in compressed Keyhole Markup Language (*.kmz) format.
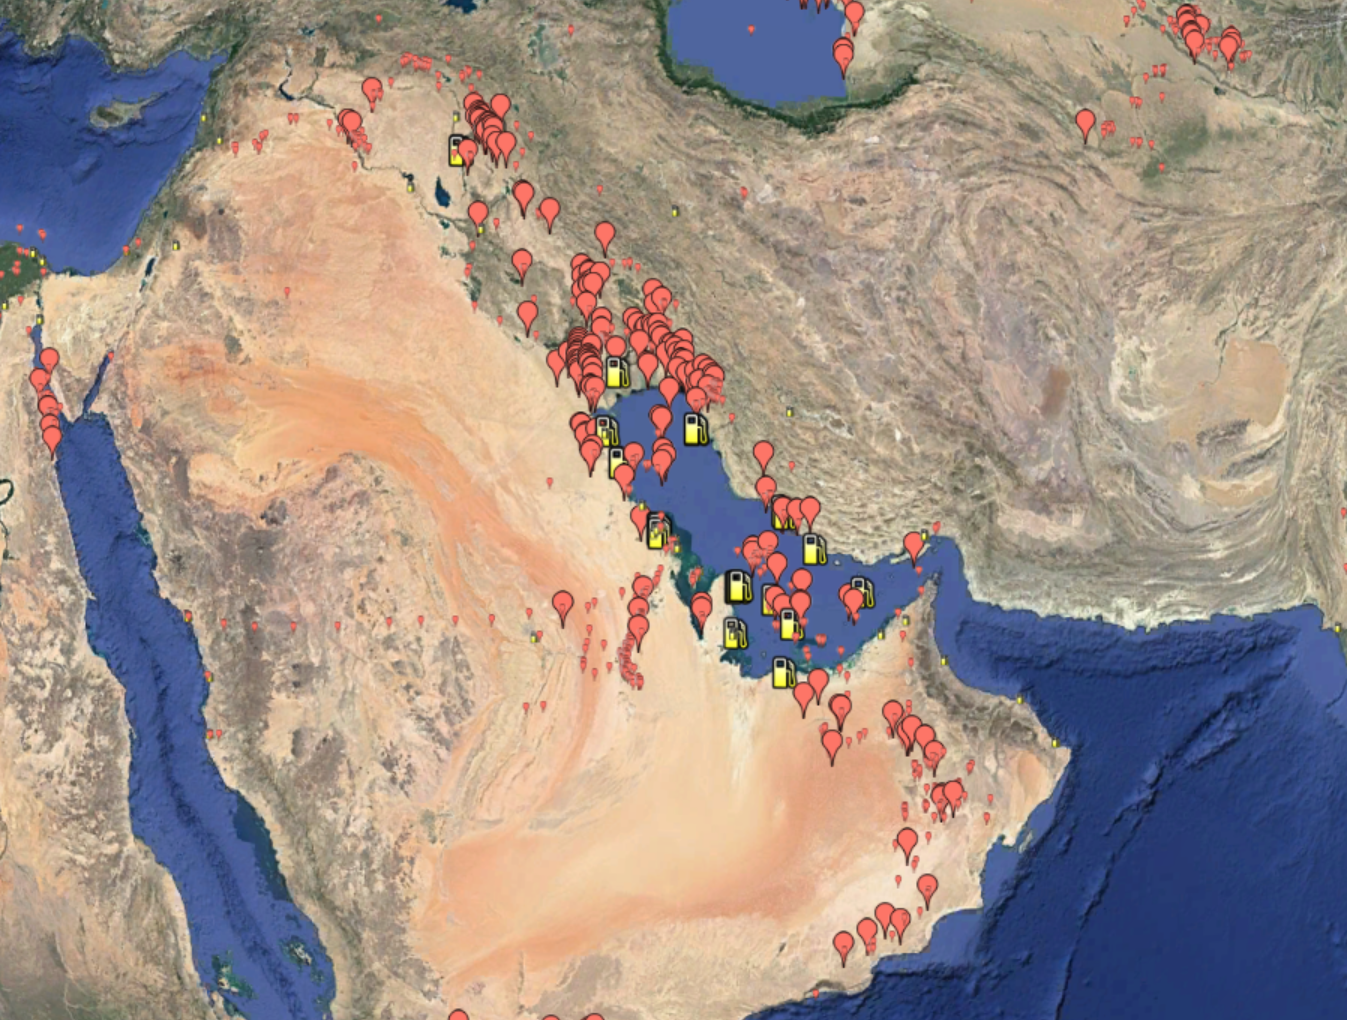
Figure 1. Representation of gas flares recorded over the Persian Gulf in 2019 by Earth Observation Group's Global Gas Flare Survey. Source: Authors
Citation
Elvidge, C.D., and M. Zhizhin. 2021. Global Gas Flare Survey by Infrared Imaging, VIIRS Nightfire, 2012-2019. ORNL DAAC, Oak Ridge, Tennessee, USA. https://doi.org/10.3334/ORNLDAAC/1874
Table of Contents
- Dataset Overview
- Data Characteristics
- Application and Derivation
- Quality Assessment
- Data Acquisition, Materials, and Methods
- Data Access
- References
Dataset Overview
This dataset contains annual global flare site surveys from 2012–2019 derived from Visible Infrared Imaging Radiometer Suite (VIIRS) on the Suomi National Polar Partnership (SNPP) satellite. Gas flaring sites were identified from heat anomalies first estimated by the VIIRS Nightfire (VNF) algorithm from which high-temperature biomass burning and low-temperature gas flaring were separated based on temperature and persistence. Nightly observations for each flare site were drawn to determine their activity in the given calendar year. Data include flare location, temperature, and estimated flared gas volume; flaring data summarized by country; and KMZ files for viewing flaring locations in Google Earth. This dataset is valuable for measuring the current status of global gas flaring, which can have significant environmental impacts.
Project: Carbon Monitoring System
The NASA Carbon Monitoring System (CMS) is designed to make significant contributions in characterizing, quantifying, understanding, and predicting the evolution of global carbon sources and sinks through improved monitoring of carbon stocks and fluxes. The System will use the full range of NASA satellite observations and modeling/analysis capabilities to establish the accuracy, quantitative uncertainties, and utility of products for supporting national and international policy, regulatory, and management activities. CMS will maintain a global emphasis while providing finer scale regional information, utilizing space-based and surface-based data and will rapidly initiate generation and distribution of products both for user evaluation and to inform near-term policy development and planning.
Related Publications
Elvidge, C.D., M. Zhizhin, K. Baugh, F-C. Hsu, and T. Ghosh. 2016. Methods for global survey of natural gas flaring from visible infrared imaging radiometer suite data. Energies 9:14. https://doi.org/10.3390/en9010014
Elvidge, C.D., M. Zhizhin, F-E. Hsu, and K. Baugh. 2013. VIIRS nightfire: Satellite pyrometry at night. Remote Sensing 5:4423-4449. https://doi.org/10.3390/rs5094423
Acknowledgments
This dataset was supported by funding from NASA’s Carbon Monitoring System (grant NNH16AD04I).
Data Characteristics
Spatial Coverage: Global
Spatial Resolution: Point locations
Temporal Coverage: 2012-04-01 to 2019-12-31
Temporal Resolution: Annual
Data File Information
There are 24 data files included in this dataset; 16 files in in comma-separated values (*.csv) format and 8 files in compressed Keyhole Markup Language (*.kmz) format. The files are named eog_global_flare_survey_<year>_<type>.<ext> (e.g., eog_global_flare_survey_2012_flare_list.csv), where
<year> is the four-digit year of data collection (2012–2019),
<type> is the type of data ("country_summary" or "flare_list"), and
<ext> is the file extension ("csv" or "kmz").
Table 1. File names and descriptions.
| File Name | Number of Files | Description |
|---|---|---|
| eog_global_flare_survey_<year>_country_summary.csv | 8 | Country-wide summary of the flare survey |
| eog_global_flare_survey_<year>_flare_list.csv | 8 | Annual global gas flare survey |
| eog_global_flare_survey_<year>_flare_list.kmz | 8 | Annual global gas flare survey locations for viewing in Google Earth. |
Data File Details
For each file,
- Coordinates are in longitude-latitude, "WGS 84" (EPSG:4326).
- Missing values are coded as -9999.
Table 2. Variable names and descriptions for files named eog_global_flare_survey_<year>_country_summary.csv.
| Variable | Description |
|---|---|
| cntry_name | Country name |
| cntry_iso | Country ISO-3166 Alpha3 code |
| bcm_sum_up | Sum of annual flared volume for upstream gas flares in billion of cubic meters (BCM) |
| flr_cnt_up | Count of upstream gas flares |
| bcm_sum_dn | Sum of annual flared volume for downstream gas flares in BCM |
| flr_cnt_dn | Count of downstream gas flares |
| bcm_sum_al | Sum of annual flared volume for all gas flare in BCM |
| flr_cnt_al | Count of all gas flares |
Table 3. Variable names and descriptions for files named eog_global_flare_survey_<year>_flare_list.csv.
| Variable | Description |
|---|---|
| cntry_name | Country name |
| cntry_iso | Country ISO-3166 Alpha3 code |
| catalog_id | Catalogue ID for the flare site |
| id_number | ID number for the flare site |
| latitude | Latitude for the flare site (decimal degrees) |
| longitude | Longitude for the flare site (decimal degrees) |
| flr_volume | Annual flared volume for the flare site in billions on cubic meters (BCM) |
| avg_temp | Average flare temperature for the flare site in Kelvin (K) |
| ellip | Ellipsoid geometry correction factor for the flare site |
| dtc_freq | Detection frequency for the flare site |
| clr_obs | Number of clear (cloud-free) observations for the flare site |
| flr_type | Type designation for the flare site |
Application and Derivation
This dataset is valuable for measuring the current status of global gas flaring. It avoids potential biases present in other similar datasets, which are often produced or funded by entities with ties to industry members. This dataset was produced by unbiased reporting entity of Earth Observation Group (EGO) under the Payne Institute for Public Policy in the Colorado School of Mines.
Quality Assessment
The data for 2012–2016 were combined, hence the resolved flare locations do not change over these years. The years 2017–2019 are processed separately; therefore, the resolved flare locations change between years based on the observations collected during each calendar year. Thus, the catalog ID is commutable from 2012–2016, but not from 2017–2019. The accuracy of the flared gas volume estimates is rated at ±9.5% (Elvidge et al., 2016).
Data Acquisition, Materials, and Methods
These data were derived using data from Visible Infrared Imaging Radiometer Suite (VIIRS) on the Suomi National Polar Partnership (SNPP) satellite. VIIRS is operated in an unusual way that offers a substantial advantage for the observation of gas flaring. At night, the VIIRS continues to record data in three near- to short-wave infrared channels designed for daytime imaging. At night, the only features detected in these channels are combustion sources. These data from gas flaring sites were identified from a year's worth of heat anomalies observed by VIIRS Nightfire product.
The VIIRS Nightfire (VNF) algorithm (Elvidge et al., 2013) was applied to all of the usable nighttime VIIRS data to convert radiance observations to temperature. Gas flaring sites could not be determined solely on temperature due to the overlap between high-temperature biomass burning and low-temperature gas flaring. To separate gas flares from fires, both temperature and persistence were used. The vast majority of biomass burning events could be filtered out by excluding single and double detections. Manual editing was used to mask out the few remaining biomass burning events. The remaining events were sorted based on temperature. Those >1,400 K were classified as gas flares and those ≤1,400 K were classified as industrial sites. Flaring measurements were then corrected for view angle differences. Gas flaring volumes were derived from radiant heat and calculated from temperature and source size using the Stefan-Boltzmann Law.
Detailed methodology can be found in Elvidge et al. (2016).
Data Access
These data are available through the Oak Ridge National Laboratory (ORNL) Distributed Active Archive Center (DAAC).
Global Gas Flare Survey by Infrared Imaging, VIIRS Nightfire, 2012-2019
Contact for Data Center Access Information:
- E-mail: uso@daac.ornl.gov
- Telephone: +1 (865) 241-3952
References
Berk, A., G.P. Anderson, P.K. Acharya, and E.P. Shettle. MODTRAN 5.2.1 User’s Manual; Spectral Sciences Inc: Burlington, MA, USA; Air Force Research Laboratory: Hanscom Air Force Base, MA, USA, 2011. https://citeseerx.ist.psu.edu/viewdoc/download?doi=10.1.1.458.1743&rep=rep1&type=pdf
Elvidge, C.D., M. Zhizhin, K. Baugh, F-C. Hsu, and T. Ghosh. 2016. Methods for global survey of natural gas flaring from visible infrared imaging radiometer suite data. Energies 9:14. https://doi.org/10.3390/en9010014
Elvidge, C.D., M. Zhizhin, F-E. Hsu, and K. Baugh. 2013. VIIRS nightfire: Satellite pyrometry at night. Remote Sensing 5:4423-4449. https://doi.org/10.3390/rs5094423