Documentation Revision Date: 2020-09-17
Dataset Version: 1
Summary
This dataset contains 16 data files in GeoTIFF (.tif) format, one for each year from 2001-2016.
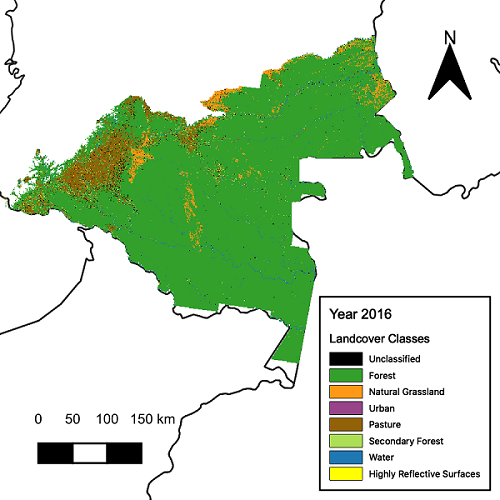
Figure 1. Land cover classification at 30 m resolution for the Colombian Amazon for the year 2016.
Citation
Arévalo, P. 2020. CMS: Landsat-derived Annual Land Cover Maps for the Colombian Amazon, 2001-2016. ORNL DAAC, Oak Ridge, Tennessee, USA. https://doi.org/10.3334/ORNLDAAC/1783
Table of Contents
- Dataset Overview
- Data Characteristics
- Application and Derivation
- Quality Assessment
- Data Acquisition, Materials, and Methods
- Data Access
- References
Dataset Overview
This dataset provides annual maps of land cover classes for the Colombian Amazon from 2001 through 2016 that were derived from Landsat time series, Continuous Change Detection and Classification (CCDC) models, and Random Forest classification. The CCDC algorithm detected changes in Landsat pixel surface reflectance across the time series to define common land-cover time segments. The stable land cover type for each time segment was classified based on manually collected training data for creation of land cover annual maps for each Landsat scene. Land cover types include unclassified, forest, natural grasslands, urban, pastures, secondary forest, water, or highly reflective surfaces. The training data are not included with this dataset.
Project: Carbon Monitoring System
The Carbon Monitoring System (CMS) is a forward-looking initiative designed to make significant contributions in characterizing, quantifying, understanding, and predicting the evolution of global carbon sources and sinks through improved monitoring of carbon stocks and fluxes.
Related Publication
Arevalo, P., P. Olofsson, and C.E. Woodcock. 2020. Continuous monitoring of land change activities and post-disturbance dynamics from Landsat time series: A test methodology for REDD+ reporting. Remote Sensing of Environment, 238:11105. https://doi.org/10.1016/j.rse.2019.01.013
Tang, X., Hutyra, L.R., Arévalo, P., Baccini, A., Woodcock, C.E., Olofsson, P., 2020. Spatiotemporal tracking of carbon emissions and uptake using time series analysis of Landsat data: A spatially explicit carbon bookkeeping model. Science of The Total Environment 137409. https://doi.org/10.1016/j.scitotenv.2020.137409
Acknowledgments
This study was funded by NASA CMS (grant NNX16AP26G) and SilvaCarbon (grant 14-DG-11132762-347).
Data Characteristics
Spatial Coverage: Colombian Amazon
Spatial Resolution: 30 m
Temporal Coverage: 2001-01-01 to 2016-12-31
Temporal Resolution: Annual
Site Boundaries: Latitude and longitude are given in decimal degrees.
| Site | Westernmost Longitude | Easternmost Longitude | Northernmost Latitude | Southernmost Latitude |
|---|---|---|---|---|
| Colombian Amazon | -78.03063889 | -65.95400278 | 5.377130556 | -3.882725 |
Data File Information
This dataset contains 16 data files in GeoTIFF (.tif) format, one for each year from 2001-2016. The file naming convention is landcover_colombian_amazon_YYYY.tif, where YYYY is a year from 2001 through 2016.
Data File Details
Missing values are represented by 15. Each file contains 34165 rows and 44745 columns. The projection used is "WGS 84 / UTM zone 18N" (EPSG:32618).
Table 1. Map values and class descriptions. Note that landcover_colombian_amazon_2001.tif does not have any 0 map values.
| Map Value | Class Description |
|---|---|
| 0 | Unclassified due to lack of temporal segment after a detected break in the time series |
| 1 | Forest |
| 2 | Natural grasslands |
| 3 | Urban: Areas that show stable urban cover |
| 4 | Pastures: Stable human-introduced pasturelands and croplands |
| 5 | Secondary forest: Areas that show sustained vegetation regrowth over the course of two years or more |
| 6 | Water |
| 7 | Highly reflective surfaces: Sandbanks, exposed rock, and other highly reflective surfaces |
Application and Derivation
These data are the first published maps of land cover categories for the Colombian Amazon that are temporally consistent and include information on forest recovery. The maps were used to create biennial change maps that were in turn used for the estimation of stable and change areas using a stratified random estimation approach as described in Arevalo et. al (2020). Any spatial analysis performed with these maps must consider the accuracies calculated for the change maps.
Quality Assessment
Given that these maps were created primarily to create biennial maps of stable and change classes, an accuracy assessment was performed on those biennial maps rather than in the annual maps included here. Areas and accuracy assessment were performed using a stratified design and estimation approach. Refer to Arevalo et al. (2020) for additional information.
Data Acquisition, Materials, and Methods
The study area, which is mostly covered by tropical rainforest, makes up more than two thirds of the forest area of Colombia (Galindo et al., 2014).
For the study, terrain-corrected (L1T), surface reflectance images from the TM, ETM+, and OLI sensors onboard Landsat-5, -7 and -8 with a cloud cover of <80% were downloaded from the EROS Center Science Processing Architecture (ESPA) website (USGS, 2010) for the 25 Landsat path and rows covering the study area. Because of a data gap around the mid-1990s, only data acquired after 1997 were used with a total of 5,184 images.Two masking procedures were applied to reduce the number of cloudy observations in the data.
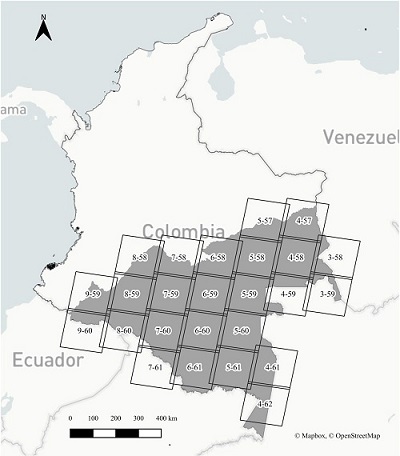
Figure 2. Study area and Landsat scenes. The Landsat WRS-2 path and row are displayed for each scene. The total area of the study region is 46,822 Kha. Source: Arevalo et al. (2020).
The 5184 resulting images were stacked chronologically to create a time series of surface reflectance. A Python implementation (YATSM) (Holden, 2016) of the Continuous Change Detection and Classification (CCDC) algorithm was applied to each Landsat pixel in each of the 25 Landsat paths and rows from 1997 to 2016. CCDC and YATSM search for breaks in a time series by monitoring for a change in the residuals of the forecast from statistical models (Holden, 2016; Zhu et al., 2012; Zhu and Woodcock, 2014).
A prediction of the surface reflectance is estimated using the initial values in the time series; when the actual observations start behaving differently than predicted, the model assumes that a change has occurred on the land surface. When change is detected, the prediction halts, and a new model is initiated when a sufficient number of observations are available. This process is repeated until the end of the time series. The result was one or more time segments for each pixel. This approach enabled the identification of land categories before and after land change events. The segments were then classified using their time series model coefficients along with training data in a Random Forest classifier to assign land cover labels. The stable mapped classes include unclassified, forest, natural grasslands, urban, pastures, secondary forest, water, and highly reflective surfaces.
A single classifier created from the training dataset across the study area was applied to the time series segments for the creation of land cover annual maps from 2001 to 2016 for each Landsat scene. This allowed for an initial training and stabilization period between the start of the time series in 1997 to the beginning of the selected time period for subsequent annual change analysis, in 2001. Annual maps were mosaicked in sequential order from low to high WRS-2 path and row number (i.e., north to south, east to west), discarding the relatively small overlap zones of each previous scene in order to simplify the process.
Training data were collected manually over ten Landsat paths and rows to account for the natural variability in each of the land categories, particularly in the forest category. In total, 420 training polygons were collected with the total number of training pixels per land category being approximately proportional to the mapped area of the category based on initial test maps produced and refined iteratively. Training data are not included in this dataset. Refer to Arevalo et al. (2020) for additional information.
Data Access
These data are available through the Oak Ridge National Laboratory (ORNL) Distributed Active Archive Center (DAAC).
CMS: Landsat-derived Annual Land Cover Maps for the Colombian Amazon, 2001-2016
Contact for Data Center Access Information:
- E-mail: uso@daac.ornl.gov
- Telephone: +1 (865) 241-3952
References
Arevalo, P., P. Olofsson, and C.E. Woodcock. 2020. Continuous monitoring of land change activities and post-disturbance dynamics from Landsat time series: A test methodology for REDD+ reporting. Remote Sensing of Environment, 238:11105. https://doi.org/10.1016/j.rse.2019.01.013
Breiman, L., 2001. Random forests. Machine Learning, 45:5-32. https://doi.org/10.1023/A:1010933404324
Galindo, G., O. Espejo, J. Ramirez, C. Forero, C. Valbuena, J. Rubiano, R. Lozano, K. Vargas, A. Palacios, S. Palacios, C. Franco, E. Granados, L. Vergara, and E. Cabrera. 2014. Memoria técnica de la Cuantificación de la superficie de bosque natural y deforestación a nivel nacional. Actualización Periodo 2012–2013. Bogota, D.C.
Holden, C., 2016. yatsm: Yet Another Time Series Model (YATSM) v0.6.1. https://doi.org/10.5281/zenodo.51336
USGS, 2010. ESPA: EROS Science Processing Architecture On Demand Interface. US Geological Survey. http://espa.cr.usgs.gov/index/
Zhu, Z., and C.E Woodcock. 2014. Continuous change detection and classification of land cover using all available Landsat data. Remote Sensing of Environment, 144:152-171. https://doi.org/10.1016/j.rse.2014.01.011
Zhu, Z., C.E. Woodcock, and P. Olofsson. 2012. Continuous monitoring of forest disturbance using all available Landsat imagery. Remote Sensing of Environment, 122:75–91. https://doi.org/10.1016/j.rse.2011.10.030