Get Data
Revision Date: May 16, 2016
Summary:
This data set provides estimates of forest canopy height derived from the Geoscience Laser Altimeter System (GLAS) LiDAR instrument that was aboard the NASA Ice, Cloud, and land Elevation (ICESat) satellite. A global GLAS waveform data set (n=12,336,553) from collection periods between October 2004 and March 2008 was processed to obtain canopy height estimates.
Estimates of GLAS maximum canopy height and crown-area-weighted Lorey’s height are provided for 18,578 statistically-selected globally distributed forested sites in a point shapefile. Country is included as a site attribute.
Also provided is the average canopy height for the forested area of each country, plus the number of GLAS data footprints (shots), number of selected sample sites, and estimates of the variance for each country.
There is one compressed shapefile (.zip) file and one comma separated file (.csv) with this data set.
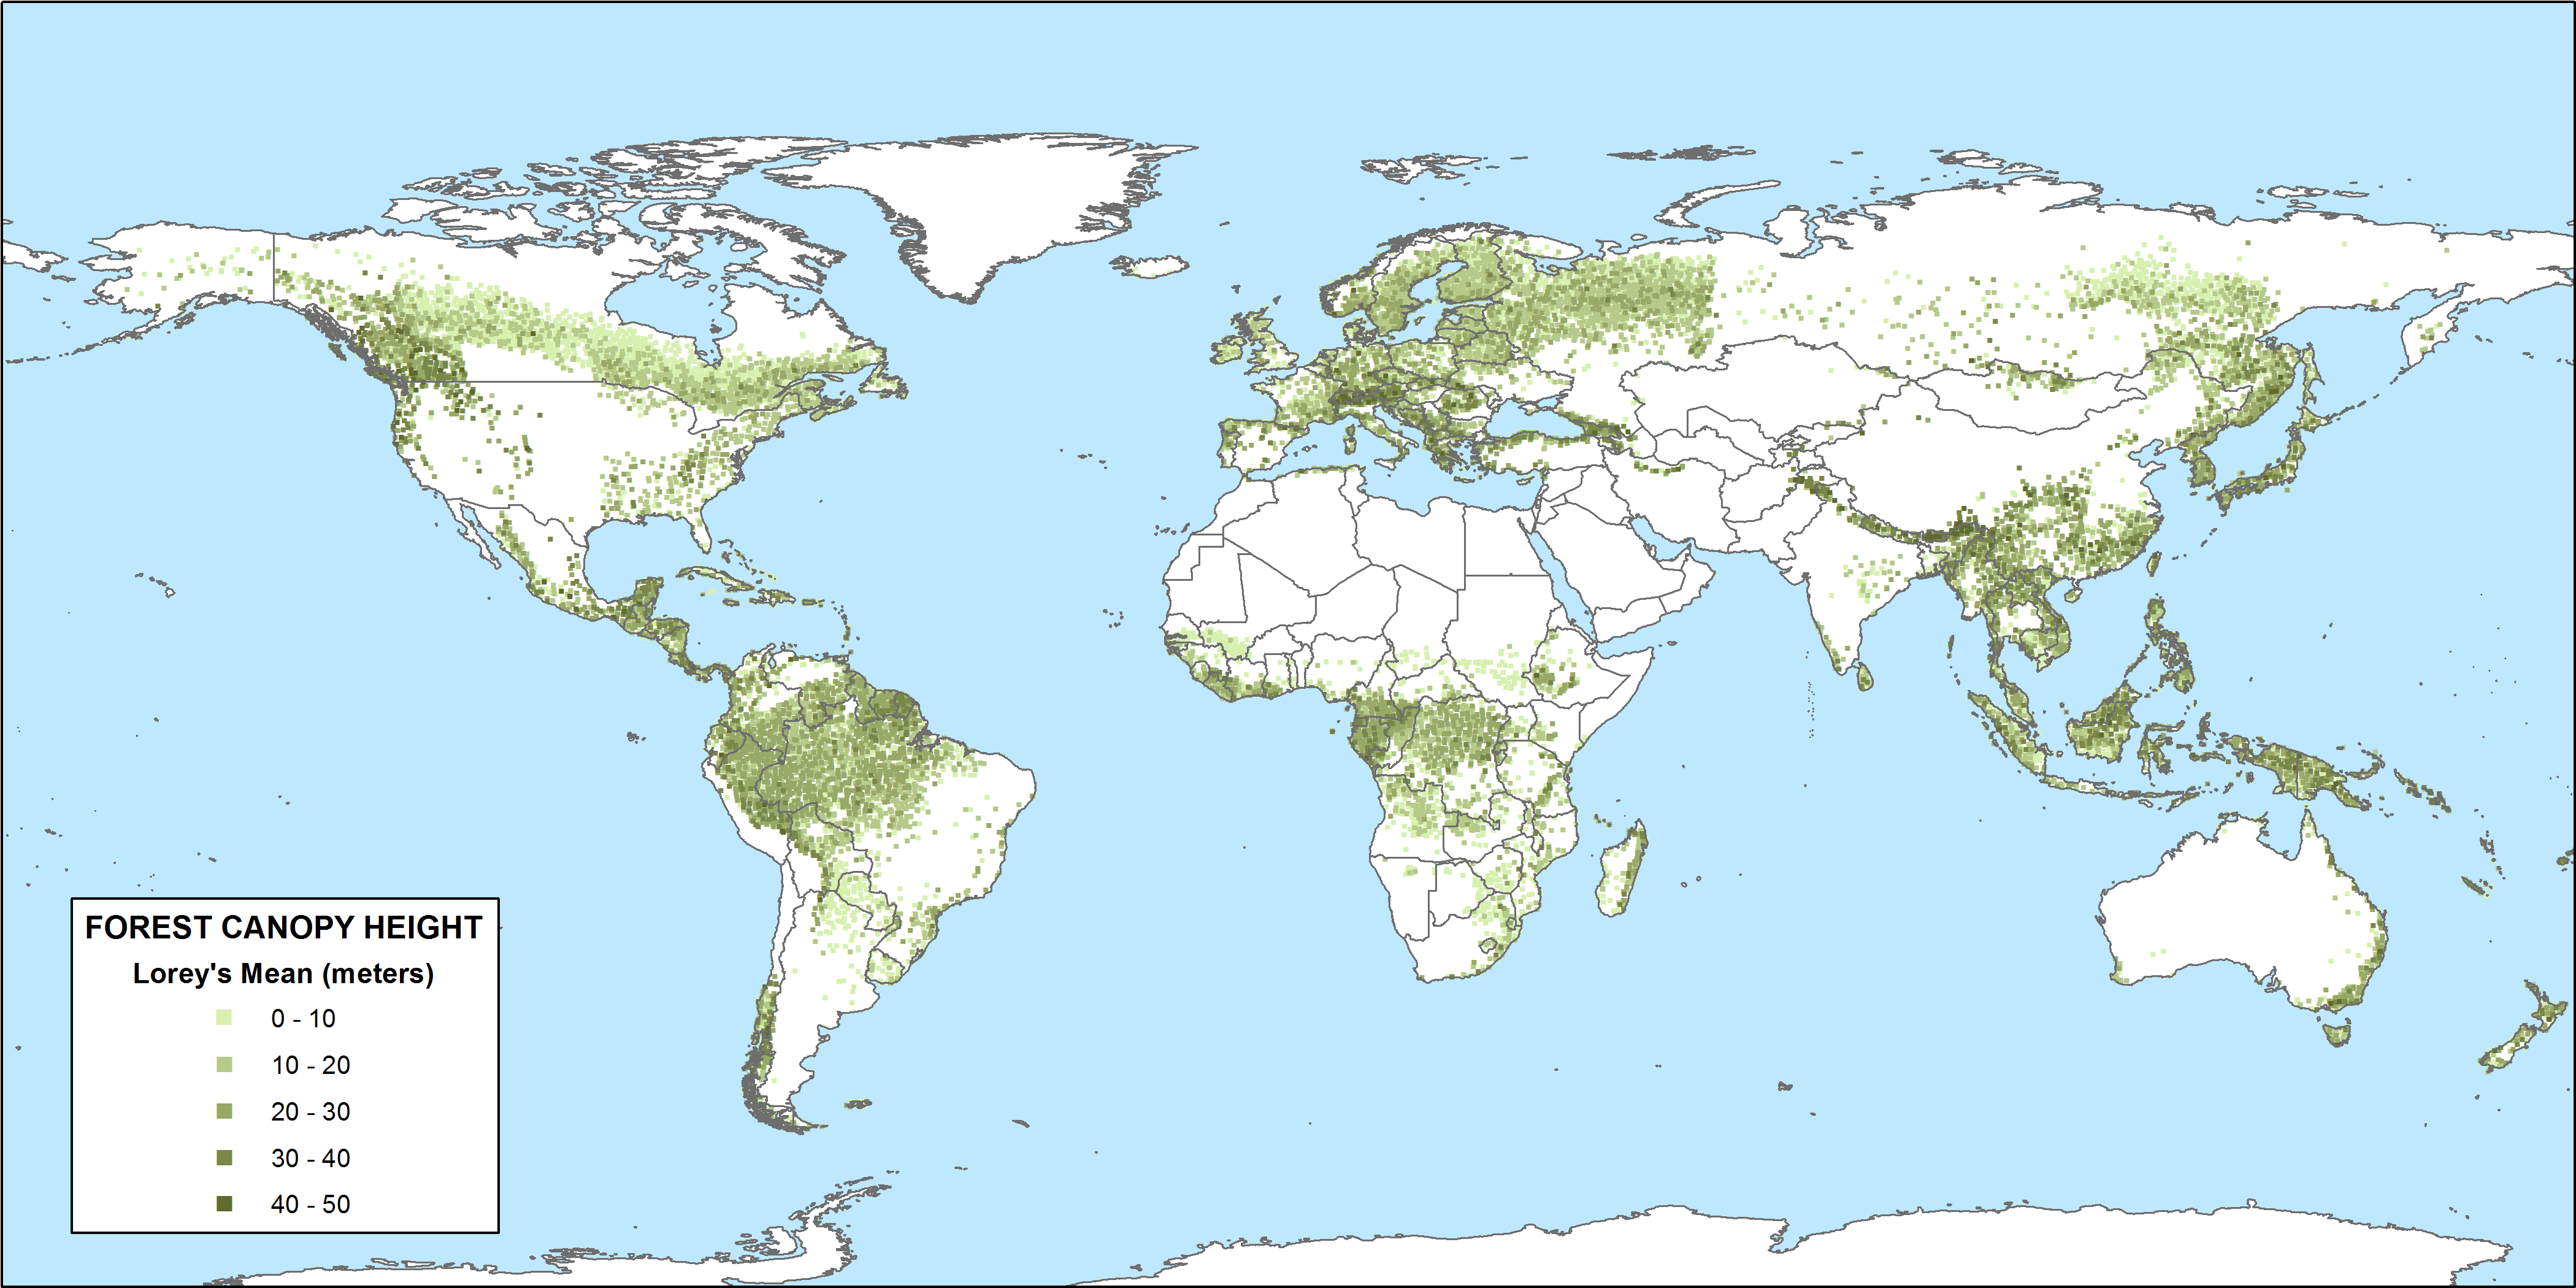
Figure 1. Global forest canopy height (Lorey's mean (m)).
Acknowledgement: Support for this research was provided by the NASA Carbon Monitoring System (grant # 11-CMS11-0046), as well as by the US Forest Service Rocky Mountain Research Station, the United Nations Food and Agriculture Organization, and Weber State University.
Data Citation:
Cite this data set as follows:
Healey, S.P., M.W. Hernandez, D.P. Edwards, M.A. Lefsky, E. Freeman, P.L. Patterson, E.J. Lindquist, and A.J. Lister. 2015. CMS: GLAS LiDAR-derived Global Estimates of Forest Canopy Height, 2004-2008. ORNL DAAC, Oak Ridge, Tennessee, USA. http://dx.doi.org/10.3334/ORNLDAAC/1271
NOTE: This data set is restricted pending journal acceptance of a manuscript.
Table of Contents:
- 1 Data Set Overview
- 2 Data Characteristics
- 3 Applications and Derivation
- 4 Quality Assessment
- 5 Acquisition Materials and Methods
- 6 Data Access
- 7 References
1. Data Set Overview:
Estimates of forest canopy height were derived from a global GLAS waveform data set (n=12,336,553) using an algorithm described by Lefsky et al. (2007). Because global GLAS Lidar data were not collected with an identifiable sample frame over forests this approach uses a height correction factor based upon trailing waveform edge extent to address topographic complexities.
GLAS data from collection periods between October, 2004 and March, 2008 (defined by which of three lasers was used and the changing power levels of each laser) used in this study included periods L3A through L3J.
The spatially balanced sample design for GLAS data developed by Healey et al. (2012) was used to create an optimal sampling procedure at the national level according to Hernandez et al, 2015.
Project: Carbon Monitoring System (CMS)
The CMS is designed to make significant contributions in characterizing, quantifying, understanding, and predicting the evolution of global carbon sources and sinks through improved monitoring of carbon stocks and fluxes. The System will use the full range of NASA satellite observations and modeling/analysis capabilities to establish the accuracy, quantitative uncertainties, and utility of products for supporting national and international policy, regulatory, and management activities. CMS will maintain a global emphasis while providing finer scale regional information, utilizing space-based and surface-based data.
2. Data Characteristics:
Spatial Coverage
Site boundaries: (All latitude and longitude given in decimal degrees, datum: WGS84)
| Site (Region) | Westernmost Longitude | Easternmost Longitude | Northernmost Latitude | Southernmost Latitude |
|---|---|---|---|---|
| Global | -161.413251 | 179.892895 | 69.293631 | -55.451286 |
Spatial Resolution
Individual sample
areas were 230 x 230-meters and average values are by respective
country.
GLAS returns were collected in discrete 70-meter (diameter)
footprints, and do not provide continuous coverage.
Temporal Coverage
GLAS data are from
collection periods between October 2004 and March 2008. Defined by which of
three lasers was used and the changing power levels of each laser. This study
included collection periods L3A through L3J.
Data are for the years 2004-10-03 through 2004-11-08:
L3A = 2004-10-03 through
2004-11-08
L3B = 2005-02-17 through
2005-03-24
.........
L3J = 2008-02-17
through 2008-03-21
(Source:
http://nsidc.org/data/icesat/laser_op_periods.html)
Temporal Resolution
One time
estimates.
Data File Information
There are two data files with this data set:
1. All_countries_hmax_hlorey.zip. A shapefile, which when unzipped contains six files (.shx, .dbf, .prj, .sbn, .sbx, .shp). The shapefile parameters and attributes are described below. There are 171 countries represented in the shapefile and 18,578 selected forested sites.
2. GLAS_mean_canopy_height_by_country.csv. A comma-separated (.csv) file which provides average canopy height for the forested area of each country, plus the number of GLAS data footprints (shots), number of selected sample sites, and estimates of the variance for each country calculated according to Hernandez et al., 2015.
File 1. All_countries_hmax_hlorey
Shapefile Parameters:
Projected Coordinate System: WGS_1984
Geographic Coordinate
System: GCS_WGS_1984
Datum: D_WGS_1984 SPHEROID=D_WGS_1984
Semimajor Axis
= 6378137.0
Semiminor Axis = 6378137.0
Inverse Flattening = 298.257223563
Prime Meridian: Greenwich (0.0)
Angular Unit = Degree
(0.0174532925199433)
Attributes
FID: Internal feature number; sequential unique whole numbers that
are automatically generated
Shape: Feature geometry
Data values (most all sites have values for new_hmax and New_hlorey):
new_hmax = Maximum canopy height from GLAS
Lidar
min value = 0; maximum value =59.970772; and
Mean=21.477449; there are no null data values; 323 0 values
new_hlorey = Lefsky's estimate for Lorey's height
which may be defined as "crown-area-weighted heigth".
min
value = 0; maximum value =49.887493; and Mean=16.128564; there are no null data
values; 637 0 values
Country = country
name
period = the GLAS time
period
Beginning L3A = 2004-10-03 through 2004-11-08; L3B = 2005-02-17
through 2005-03-24; and continuing L3J = 2008-02-17 through 2008-03-21
File 2: GLAS_mean_canopy_height_by_country.csv
| Column | Column Heading | Units/format | Description |
|---|---|---|---|
| 1 | Country | Countries for which canopy height estimates were derived. 171 in total. | |
| 2 | Forest_Area | hectares | Forested area in each country as defined by the five forested classes of the International Geosphere-Biosphere Programme (IGBP) MODIS global land cover raster (MOD12Q1) including: Evergreen Needleleaf forest, Evergreen Broadleaf forest, Deciduous Needleleaf forest, Deciduous Broadleaf forest, and Mixed forest. |
| 3 | Total_Shots_within_Forest_ Area | Total number of GLAS data footprints falling within the forested area in each country. | |
| 4 | Shots_in_Sample | Number of forest area sample pixels (230 x 230 m) with multiple GLAS shots. Areas used to estimate canopy height. | |
| 5 | Hectares per sample | hectares | Number of hectares that each sample represents within the forested area of a country. (Column 2 divided by Column 4) |
| 6 | Avg_Canopy_Height | meters | Average of GLAS canopy height of sample areas |
| 7 | Estimate_of_the_Variance | meters | squared Country-level variance (V-hat as defined in Hernandez et al. 2015) |
| 8 | Standard_Error_of_the_Estimate | meters | Square root of the variance. |
3. Data Application and Derivation:
The data may be of future use in estimating biomass under a model-based estimation approach (e.g. (Gregoire 1998; Ståhl et al. 2010)), and it may also form the basis of weighted estimates of height or biomass across trans-national ecological zones.
4. Quality Assessment:
This is a statistically defined sample of the global GLAS data set. It is intended for use in studying global forests using sample/survey estimation methods. Resulting estimates are accompanied by clear estimates of uncertainty based upon the variance of the sample.
Recall that estimates are for canopy height as GLAS sees it, which can differ significantly from actual height in some areas.
5. Data Acquisition Materials and Methods:
The GLAS instrument aboard ICESat provided full-waveform lidar data for the earth’s forests from 2003 to 2010. For this data set, mean forest canopy height was derived for a global GLAS waveform data set (n=12,336,553) using an algorithm described by Lefsky et al. (2007). This approach used a height correction factor based upon trailing waveform edge extent to address topographic complexities. GLAS data from collection periods between October, 2004 and March, 2008 (defined by which of three lasers was used and the changing power levels of each laser) used in this study included periods L3A through L3J. GLAS footprints were dropped from the data set using quality flags indicating cloud or atmospheric contamination, but footprints falling on areas of high topographic relief were not eliminated.
Sampling Process
The spatially balanced sample design for GLAS data developed by Healey et al. (2012) was used to create an optimal sampling procedure at the national level according to the following process (Hernandez et al., 2015):
- The five forested classes of the International Geosphere-Biosphere Programme (IGBP) MODIS global land cover raster (MOD12Q1), resampled to 230-m pixel size following the procedure of Healey et al. (2012), were used to define the spatial domain within each country for which mean height was estimated. The GLAS data set was subset to this domain. The UN FAO Global Administrative Units Layer (GAUL) country boundaries layer (2008-2009 data) was used to define national boundaries. Country-specific equal-area projections were used to ensure highest accuracy.
- When GLAS data were overlain onto the forest areas, some individual GLAS shots were the only points within a given forest pixel area (230 m x 230 m) while other pixels contained multiple shots. Therefore, the next step in the sampling procedure was to randomly select a single GLAS shot in multiple-shot pixels using SAS 9.3 statistical software with a proximity tool (ArcToolbox™: NEAR tool).
- A space-filling curve (Peano curve) was applied to all forest cell center points in each country using an ArcToolbox™ tool in which an algorithm assigned a unique ordinal rank to each forested pixel. An open-source script distributed in association with the work of Healey et al. (2012), was run to divide the spatial order number line of forest cell centers for each country into the shortest possible equal-length segments such that each segment contained at least one forest cell associated with a GLAS shot. These segments represented equal-area, semi-contiguous sampling units, and were considered optimal at the country level. Country-level GLAS samples were then developed by randomly choosing a GLAS shot in each sample unit.
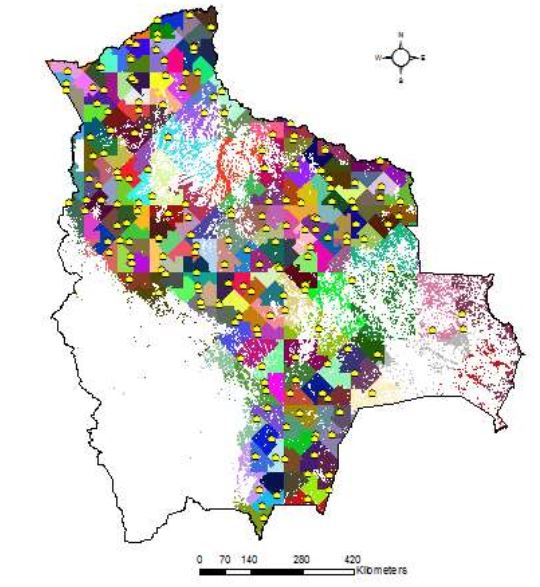
Figure 2. Locations of 185 randomly sampled GLAS shots across Bolivia overlying the forest sample units/segments. White (unfilled) areas of the map indicate nonforested regions.
Canopy Height Assessment
Approximately 1.4% of the global data set (258 samples) processed using the techniques described by Lefsky et al. (2007) were given a canopy height of 60 meters. However, such values were indicative of potential problems, with error sources ranging from sensor and atmospheric error to topography and interfering objects (e.g. birds). Samples with a value of 60 meters occurring within a national sample were therefore considered “nonresponsive”. Affected samples were replaced with another randomly selected GLAS shot from the same sample unit/segment. In two cases, (one in Australia, one in Belize), no alternative GLAS shot was available, resulting in no measurement available for the affected sample unit (Hernandez et al., 2015).
Resulting Data Products
Global GLAS Canopy Height Estimates
The resulting data set identifies the largest possible sub-set of GLAS data for each country that can be treated as a simple random sample. There are 171 countries represented in the provided shapefile and 18,578 statistically-selected forested sites with estimates of maximum canopy height and crown-area-weighted Lorey’s height.
Mean Canopy Height Estimation
This process established a spatially balanced simple random sample of GLAS footprints, where the sample number was optimized by country. As such, mean GLAS canopy height was estimated from the simple arithmetic mean of each country’s sample (Hernandez et al., 2015) and provided in the comma separate file.
6. Data Access:
These data are available through the Oak Ridge National Laboratory (ORNL) Distributed Active Archive Center (DAAC).
CMS: GLAS LiDAR-derived Global Estimates of Forest Canopy Height, 2004-2008
Contact for Data Center Access Information:
E-mail: uso@daac.ornl.gov
Telephone: +1 (865)
241-3952
7. References:
Golinkoff, J., M. Hanus, J. Carah. 2011. The use of airborne laser scanning to develop a pixel-based stratification for a verified carbon offset project. Carbon Balance and Management 6:9. doi:10.1186/1750-0680-6-9
Healey, S.P.,P.L. Patterson, S.S. Saatchi, M.A. Lefsky, A.J. Lister, and E.A. Freeman. (2012). A sample design for globally consistent biomass estimation using lidar data from the Geoscience Laser Altimeter System (GLAS). Carbon Balance and Management, 7.
Hernandez, M.W., S.P. Healey, D. Edwards, M. Lefsky, E. Freeman, P.L. Patterson, E.J. Lindquist, and A. Lister. 2015. Sample-based Estimates of Global Forest Height by Country. Manuscript.
Lefsky, M.A., M. Keller, Y. Pang, P.B. De Camargo, and M.O. Hunter. (2007). Revised method for forest canopy height estimation from Geoscience Laser Altimeter System waveforms. Journal of Applied Remote Sensing, 1, 013537-013537-013518