Documentation Revision Date: 2026-03-20
Dataset Version: 2
Summary
This dataset contains six files in cloud optimized GeoTIFF format.
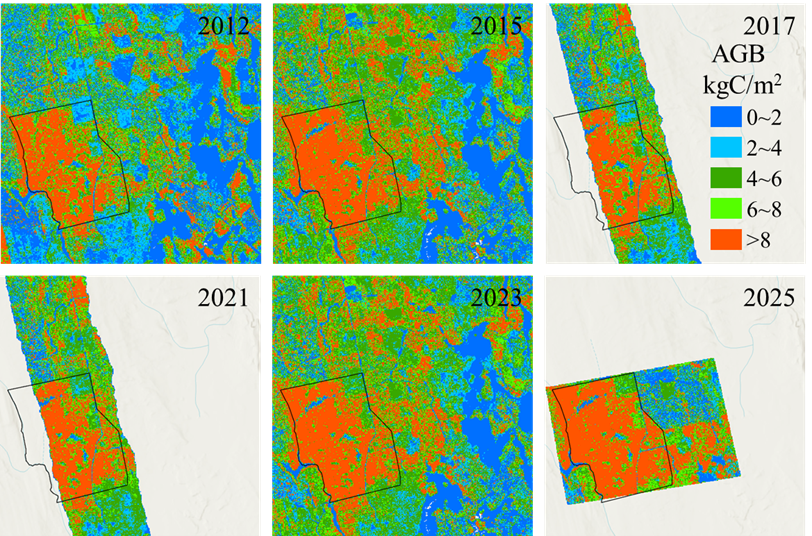
Figure 1. Wall-to-wall aboveground biomass maps for the Howland Research Forest for the years 2012, 2015, 2017, 2021, 2023, and 2025.
Citation
Wei, X., D.J. Hayes, D. Sandilands, A. Owen, J. Zhao, L. Ma, and A. Weiskittel. 2026. Aboveground Biomass Maps for Howland Research Forest, Maine, 2012-2025. ORNL DAAC, Oak Ridge, Tennessee, USA. https://doi.org/10.3334/ORNLDAAC/2490
Table of Contents
- Dataset Overview
- Data Characteristics
- Application and Derivation
- Quality Assessment
- Data Acquisition, Materials, and Methods
- Data Access
- References
- Dataset Revisions
Dataset Overview
This dataset provides aboveground biomass (AGB) maps at 10-m spatial resolution for the Howland Research Forest in central Maine for the years 2012, 2015, 2017, 2021, 2023, and 2025. Forest inventory measurements were collected from 38 plots during the summers of 2024 and 2025. Airborne LiDAR data were obtained from multiple sources and acquisition periods. The USGS 3D Elevation Program 3DEP data were acquired in 2015 and 2023 under leaf-off conditions. The NASA G-LiHT project (Cook et al., 2013) collected data in 2012, 2017, and 2021 under leaf-on conditions. An additional leaf-on survey was conducted on 13 August 2025 using the Phoenix RANGER-U580 system (Riegl VQ-580II-S laser scanner). Area-based Random Forest models were calibrated separately for leaf-off conditions using USGS 3DEP 2023 data and for leaf-on conditions using Phoenix 2025 data. Each calibrated model was applied to LiDAR datasets acquired under the corresponding seasonal conditions to produce wall-to-wall AGB maps for each acquisition year.
Project: Carbon Monitoring System (CMS)
The NASA Carbon Monitoring System (CMS) program is designed to make significant contributions in characterizing, quantifying, understanding, and predicting the evolution of global carbon sources and sinks through improved monitoring of carbon stocks and fluxes. The System uses NASA satellite observations and modeling/analysis capabilities to establish the accuracy, quantitative uncertainties, and utility of products for supporting national and international policy, regulatory, and management activities. CMS data products are designed to inform near-term policy development and planning.
Related Datasets:
Ayrey, E., D.J. Hayes, X. Wei, G. Shao, A. Weiskittel, S. Fei, J. Zhao, and B. Zhang. 2025. Forest Aboveground Biomass for Maine, 2023. ORNL DAAC, Oak Ridge, Tennessee, USA. https://doi.org/10.3334/ORNLDAAC/2435
- Aboveground biomass for Maine, also used Lidar from the USGS 3DEP Program to derive the estimates
Wei, X., D.J. Hayes, A. Weiskittel, G. McHale, P. Howe, C. Zhang, and G. Shao. 2025. Aboveground Biomass for Howland Forest, Maine, 2012-2023. ORNL DAAC, Oak Ridge, Tennessee, USA. https://doi.org/10.3334/ORNLDAAC/2434
- Version 1 of this dataset; this Version 2 supersedes Version 1
Acknowledgement:
This research was supported by funding from NASA's Carbon Monitoring System (grant 80NSSC25K7219), USDA Forest Service Northeastern States Research Cooperative (grant 24-DG-11242311-081), Maine Space Grant Consortium (grant SG-24-30), and USDA NIFA Sustainable Agricultural Systems (grant 2023-68012-38992).
Data Characteristics
Spatial Coverage: Howland Research Forest in central Maine, USA
Spatial Resolution: 10 m
Temporal Coverage: 2012 to 2025
Temporal Resolution: Annual estimates for 2012, 2015, 2017, 2021, 2023, and 2025
| Site | Westernmost Longitude | Easternmost Longitude | Northernmost Latitude | Southernmost Latitude |
|---|---|---|---|---|
| central Maine, U.S. | -68.7578 | -68.7064 | 45.2279 | 45.1901 |
Data File Information
This dataset contains six files in cloud optimized GeoTIFF format (.tif).
- Howland_AGB_2012.tif
- Howland_AGB_2015.tif
- Howland_AGB_2017.tif
- Howland_AGB_2021.tif
- Howland_AGB_2023.tif
- Howland_AGB_2025.tif
GeoTIFF characteristics:
- Coordinate system: UTM projection, zone 19N, WGS-84 datum (EPSG 32619)
- Map units: meters
- Spatial resolution: 10 m
- Pixel values: aboveground biomass (AGB) in kg C m-2.
- Nodata value: -9999
- Number of bands: 1
Application and Derivation
Howland Research Forest is a long-term research forest located in central Maine, USA. The forest is a low elevation transitional system between temperate and boreal regions and is dominated by red spruce (Picea rubens), eastern hemlock (Tsuga canadensis), and red maple (Acer rubrum). Howland Research Forest supports numerous research projects focused on forest dynamics, carbon cycling, and ecosystem processes. Wall-to-wall biomass maps are valuable for supporting these efforts and for tracking changes in forest biomass over time.
Quality Assessment
Forest inventory data were collected from 20 plots to validate the predicted AGB. Because changes in tree biomass over a one year period are relatively small, the predicted AGB from maps derived from the 2023 and 2025 LiDAR point clouds were compared with field-measured AGB from the 2024 and 2025 inventories. The results indicate that at lower AGB levels, the predicted values are generally close to the field measurements. However, when plot-level AGB exceeds about 10 kg m-2, the model tends to underestimate AGB.This pattern may occur because, in high-biomass stands, LiDAR-derived structural metrics become less responsive to additional increases in biomass. As canopy height and cover approach saturation, further gains in biomass are not proportionally reflected in height percentiles or canopy cover metrics, making structural differences among dense stands more difficult to distinguish. (Figure 2).
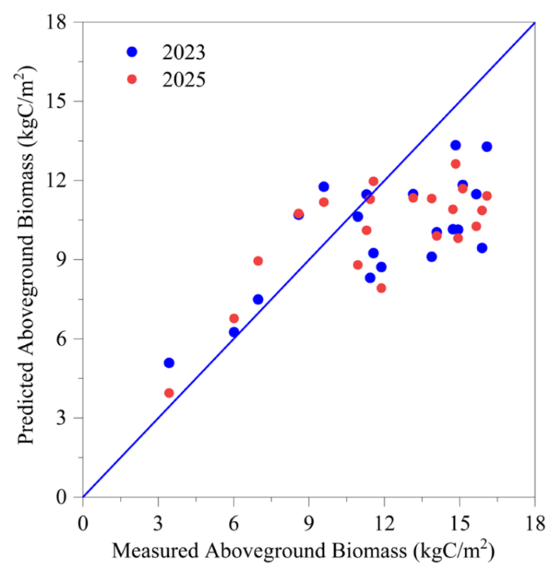
Figure 2. Predicted aboveground biomass (2023 and 2025) versus field-measured AGB (2024 and 2025) for 20 validation plots.
The LiDAR datasets were acquired from different sources and under different seasonal conditions. The USGS 3DEP data were collected during the leaf-off season, whereas the NASA G-LiHT and Phoenix datasets were collected during the leaf-on season. Leaf-on and leaf-off conditions can strongly influence biomass mapping results. Leaf-on data tend to produce higher AGB estimates, because foliage increases canopy returns and affects height and canopy cover metrics derived from the point cloud. The Random Forest model was calibrated separately for leaf-on and leaf-off datasets, but the leaf-on model still produced higher AGB estimates. Additionally, the point density of these LiDAR datasets varies substantially. Average point densities range from approximately 5 points m-2 for the USGS 3DEP data (2015), to about 35 points m-2 for the NASA G-LiHT data (2021), and up to around 100 points m-2 for the Phoenix data (2025). Higher point density generally provides a more detailed representation of canopy structure and can lead to higher or more stable AGB estimates. Therefore, when comparing biomass estimates derived from different LiDAR sources, the combined influence of seasonality, point density, and sensor characteristics should be considered (Figure 3).
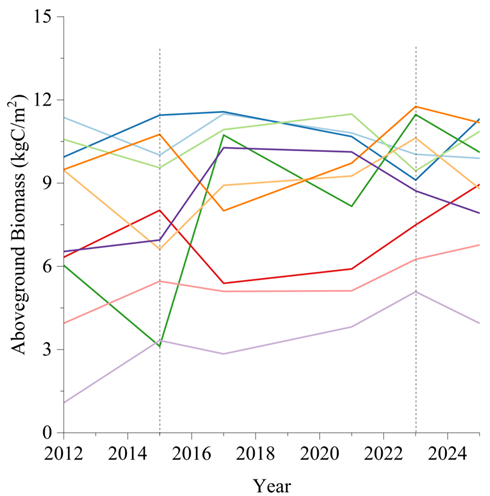
Figure 3. Aboveground biomass changes for ten field inventory plots used for validation from 2012 to 2025.
Data Acquisition, Materials, and Methods
Forest inventories were conducted during the summers of 2024 and 2025 using 38 fixed-area plots. Each plot was established as a circular plot with a radius of 8.92 m (area = 250 m2). Plots were systematically and uniformly distributed to capture spatial variability in stand structure and species composition within the study area. Within each plot, all live trees with diameter at breast height (DBH) ≥10 cm were measured and recorded, including species and DBH. To accurately measure plot center coordinates, a Trimble Geo7x handheld Global Navigation Satellite Systems (GNSS) receiver connected to a Trimble Zephyr Model 2 antenna mounted on a survey tripod was used. An individual-tree growth model developed by Weiskittel et al. (2016) was used to infer tree-level DBH for 2023 and 2025. Species-specific allometric equations from Jenkins et al. (2003), which include the stump component, were applied to estimate individual tree AGB. Tree-level biomass was then aggregated to obtain plot-level AGB.
The airborne LiDAR data collected by the USGS 3DEP project in 2015 and 2023 (leaf-off data), and by the NASA G-LiHT project in 2012, 2017, and 2021 (leaf-on data) (Cook et al., 2013) were used in this study. In addition, LiDAR data were collected on August 13, 2025, using the Phoenix RANGER-U580 system (Riegl VQ-580II-S laser scanner). The USGS 3DEP LiDAR data were acquired during the leaf-off season, whereas the NASA G-LiHT and Phoenix datasets were collected during the leaf-on season. These LiDAR datasets differ in pulse density and point density. The USGS 3DEP and Phoenix datasets provide full coverage of the Howland Research Forest, while the NASA G-LiHT data cover only the eastern portion of the forest.
An area-based approach (White et al., 2017) was used to calibrate the two random forest models using plot-level LiDAR structural metrics and corresponding inventory-based AGB estimates for 2023 and 2025. The calibrated models were then applied to predict AGB across all LiDAR acquisition years. For each plot, co-located airborne LiDAR metrics were extracted, including maximum height, mean height, height percentiles (50th, 75th, and 90th), and canopy cover fraction. These LiDAR-derived structural metrics were used as predictor variables, while the corresponding plot-level AGB values derived from field measurements and growth-adjusted estimates served as response variables for model training (leaf-off mode: R2 = 0.63, RMSE = 2.18, leaf-on mode: R2 = 0.51, RMSE = 2.64). The LiDAR point clouds were rasterized at a spatial resolution of 10 m × 10 m, and the same structural metrics were computed for each grid cell. The calibrated model was then used to predict AGB for all grid cells, producing wall-to-wall biomass maps for the entire Howland Research Forest for each LiDAR acquisition year (Figure 1).
Additional forest inventory data were collected from 20 plots using the same field protocol to validate the predicted AGB. Because changes in tree biomass over a one-year period are relatively small, the predicted AGB from maps derived from the 2023 and 2025 LiDAR point clouds was compared with field-measured AGB from the 2024 and 2025 inventories (Figure 2).
Data Access
These data are available through the Oak Ridge National Laboratory (ORNL) Distributed Active Archive Center (DAAC).
Aboveground Biomass Maps for Howland Research Forest, Maine, 2012-2025
Contact for Data Center Access Information:
- E-mail: uso@daac.ornl.gov
- Telephone: +1 (865) 241-3952
References
Ayrey, E., D.J. Hayes, X. Wei, G. Shao, A. Weiskittel, S. Fei, J. Zhao, and B. Zhang. 2025. Forest Aboveground Biomass for Maine, 2023. ORNL DAAC, Oak Ridge, Tennessee, USA. https://doi.org/10.3334/ORNLDAAC/2435
Cook, B. D., L. W. Corp, R. F. Nelson, E. M. Middleton, D. C. Morton, J. T. McCorkel, J. G. Masek, K. J. Ranson, V. Ly, and P. M. Montesano. 2013. NASA Goddard's Lidar, Hyperspectral and Thermal (G-LiHT) airborne imager. Remote Sensing 5:4045-4066. https://doi.org/10.3390/rs5084045.
Jenkins, J.C., D.C. Chojnacky, L.S. Heath, and R.A. Birdsey. 2003. National-scale biomass estimators for United States tree species. Forest Science 49:12-35. https://doi.org/10.1093/forestscience/49.1.12
Weiskittel, A., C. Kuehne, T.P. McTague, and M. Oppenheimer. 2016. Development and evaluation of an individual tree growth and yield model for the mixed species forest of the Adirondacks Region of New York, USA. Forest Ecosystems 3:26. https://doi.org/10.1186/s40663-016-0086-3
Wei, X., D.J. Hayes, A. Weiskittel, G. McHale, P. Howe, C. Zhang, and G. Shao. 2025. Aboveground Biomass for Howland Forest, Maine, 2012-2023. ORNL DAAC, Oak Ridge, Tennessee, USA. https://doi.org/10.3334/ORNLDAAC/2434
White, J.C., P. Tompalski, M. Vastaranta, M. Wulder, N. Saarinen, C. Stepper, and N. Coops. 2017. A model development and application guide for generating an enhanced forest inventory using airborne laser scanning data and an area-based approach. CWFC Information Report FI-X-018. Natural Resources Canada, Canadian Forest Service; Victoria, British Columbia, Canada. https://ostrnrcan-dostrncan.canada.ca/handle/1845/229341
Dataset Revisions
| Version | Release Date | Revision Notes |
|---|---|---|
| 2 | 2026-03-20 | Data has been extended to include biomass estimates for year 2025 |
| 1 | 2025-06-10 | Initial publication as https://doi.org/10.3334/ORNLDAAC/2434 |