Documentation Revision Date: 2025-06-10
Dataset Version: 1
Summary
This dataset holds five files in cloud optimized GeoTIFF format.
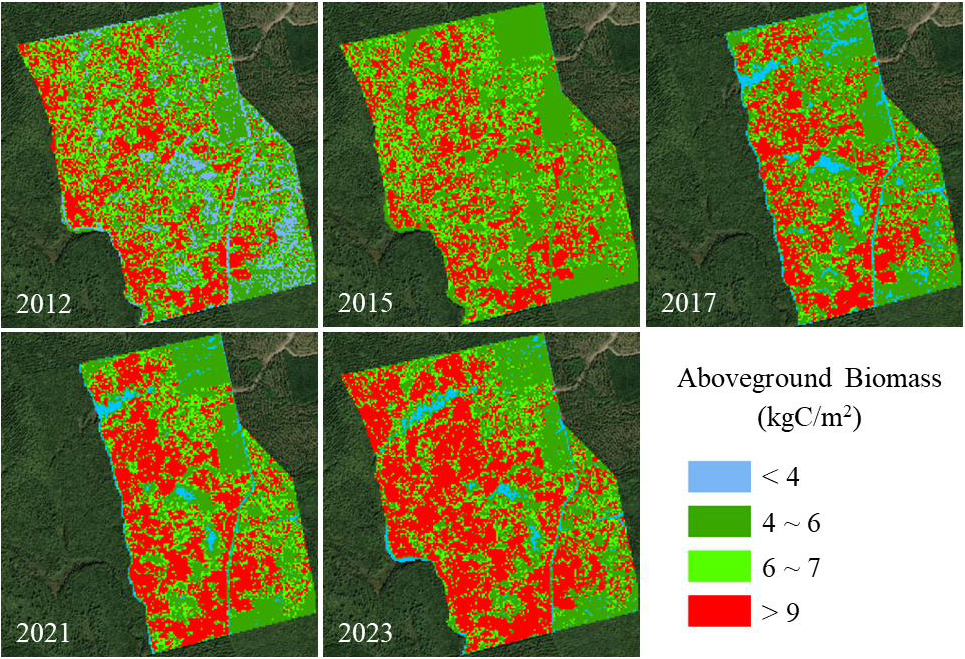
Figure 1. Aboveground biomass maps for the Howland Research Forest for 2012, 2015, 2017, 2021, and 2023. Howland Forest is located in central Maine, USA (approximately 45.208 latitude, -68.743 longitude).
Citation
Wei, X., D.J. Hayes, A. Weiskittel, G. McHale, P. Howe, C. Zhang, and G. Shao. 2025. Aboveground Biomass for Howland Forest, Maine, 2012-2023. ORNL DAAC, Oak Ridge, Tennessee, USA. https://doi.org/10.3334/ORNLDAAC/2434
Table of Contents
- Dataset Overview
- Data Characteristics
- Application and Derivation
- Quality Assessment
- Data Acquisition, Materials, and Methods
- Data Access
- References
Dataset Overview
This dataset holds aboveground biomass (AGB) estimates at 10-m spatial resolution for the Howland Research Forest in central Maine for 2012, 2015, 2017, 2021, and 2023. Forest inventory data were collected using 50 fixed-area plot sampling during the summers of 2021, 2023, and 2024. Plots included permanent inventory plots around existing flux towers and additional plots to ensure representation of various forest conditions. Each plot had a radius of 7.98 m. In addition, leaf-off airborne LiDAR data were collected by the USGS 3DEP project in 2012, 2015, and 2023, and leaf-on data were obtained from the NASA G-LiHT project for 2017 and 2021. The LANDIS-II forest landscape model along with its Biomass Succession extension was used to simulate ecosystem dynamics in Howland Forest. Then, a random forest (RF) model was used to generate wall-to-wall biomass maps for the research forest from the LiDAR data. The RF model was calibrated from in situ AGB measurements from plots and simulated AGB values for the LiDAR acquisition years. Howland Research Forest is a low-elevation transitional forest dominated by spruce and hemlock, with conifer and northern hardwood species.
Project: Carbon Monitoring System
The NASA Carbon Monitoring System (CMS) program is designed to make significant contributions in characterizing, quantifying, understanding, and predicting the evolution of global carbon sources and sinks through improved monitoring of carbon stocks and fluxes. The System uses NASA satellite observations and modeling/analysis capabilities to establish the accuracy, quantitative uncertainties, and utility of products for supporting national and international policy, regulatory, and management activities. CMS data products are designed to inform near-term policy development and planning.
Related Dataset:
Ayrey, E., D.J. Hayes, X. Wei, G. Shao, A. Weiskittel, S. Fei, J. Zhao, and B. Zhang. 2025. Forest Aboveground Biomass for Maine, 2023. ORNL DAAC, Oak Ridge, Tennessee, USA. https://doi.org/10.3334/ORNLDAAC/2435
Acknowledgement:
This research was supported by funding from NASA's Carbon Monitoring System (grants 80NSSC21K0966, 80NSSC25K7219), USDA Forest Service Northeastern States Research Cooperative (grant 20-DG-11242307-025), Maine Space Grant Consortium grant (SG-24-30), USDA NIFA Sustainable Agricultural Systems (grant 2023-68012-38992), and the McIntire-Stennis project (award ME-041907) from the USDA National Institute of Food and Agriculture.
Data Characteristics
Spatial Coverage: Howland Forest in central Maine, USA
Spatial Resolution: 10 m
Temporal Coverage: 2012 to 2023
Temporal Resolution: Annual estimates for 2012, 2015, 2017, 2021, and 2023
Site Boundaries: Latitude and longitude are given in decimal degrees.
| Site | Westernmost Longitude | Easternmost Longitude | Northernmost Latitude | Southernmost Latitude |
|---|---|---|---|---|
| central Maine | -68.7561 | -68.7325 | 45.2144 | 45.1961 |
Data File Information
This dataset holds five files in cloud optimized GeoTIFF format:
- 2012_Howland_Forest_Biomass.tif
- 2015_Howland_Forest_Biomass.tif
- 2017_Howland_Forest_Biomass.tif
- 2021_Howland_Forest_Biomass.tif
- 2023_Howland_Forest_Biomass.tif
GeoTIFF characteristics:
- Coordinate system: UTM projection, zone 19N, WGS-84 datum (EPSG 32619), units in meters
- Spatial resolution: 10 m
- Pixel values: aboveground biomass in kg carbon per square meter (kg C m-2)
- Nodata value: -9999
- Data type: Float32
Application and Derivation
These data are useful for studies of carbon cycling and storage in forest ecosystems.
Quality Assessment
Model estimates were calibrated from in situ measurements of aboveground biomass in 50 forest plots.
Data Acquisition, Materials, and Methods
Howland Research Forest is an ecosystem research site located in central Maine, characterized as a low-elevation transitional forest dominated by spruce and hemlock, with conifer and northern hardwood species (Figure 2). To map forest biomass in Howland Forest, forest inventory data were collected using fixed-area plot sampling during the summers of 2021, 2023, and 2024. The inventory included 13 plots in 2021, 11 plots in 2023, and 26 plots in 2024, totaling 50 plots (Figure 2, Table 1). Plots included used permanent inventory plots around existing flux towers and additional plots to ensure representation of various forest conditions. Each plot had a radius of 7.98 m, resulting in an area of 200 m2. Geographic coordinates for the center of each inventory plot were obtained using a Trimble GPS receiver. Within each plot, all individual trees with a diameter at breast height (DBH) >10 cm were measured, recording species, azimuth, DBH (in cm), distance from the plot center (in m), and tree status (living or dead). No timber harvesting occurred within the study area from 2012 to 2024; however, some trees were damaged or lost due to storm events. Aboveground biomass (AGB) for each tree (kilograms of carbon, kg C), was calculated using species-specific allometric equations developed by Young et al. (1980). Subsequently, plot-level AGB density (kg C m-2) was determined by summing the biomass of all trees within each plot and dividing by the plot area.
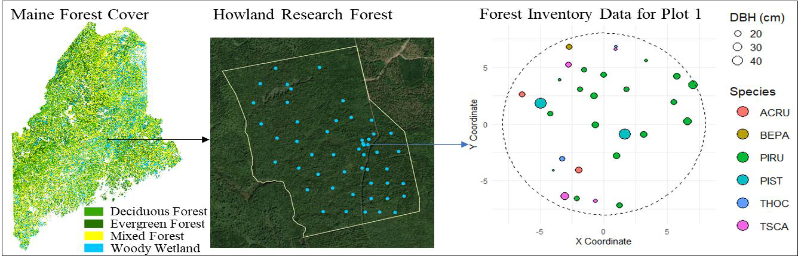
Figure 2. Location of the Howland Research Forest in central Maine and the distribution of 50 fixed-area forest inventory plots. The example from Plot 1 illustrates the spatial arrangement of individual trees within the plot, with symbol size proportional to diameter at breast height (DBH) and color representing tree species (ACRU: Red Maple, Acer rubrum; BEPA: Paper Birch, Betula papyrifera; PIRU: Red Spruce, Picea rubens; PIST: Eastern White Pine, Pinus strobus; THOC: Northern White-Cedar, Thuja occidentalis; TSCA: Eastern Hemlock, Tsuga canadensis).
Airborne LiDAR data were collected by the USGS 3DEP project (https://www.usgs.gov/3d-elevation-program) in 2012, 2015, and 2023, and the NASA G-LiHT project (https://gliht.gsfc.nasa.gov) in 2017 and 2021. The USGS 3DEP LiDAR data were collected during the leaf-off season, while NASA G-LiHT collected data during the leaf-on season. These LiDAR datasets varied in pulse densities and point densities. The USGS 3DEP data cover the entire Howland Forest, whereas the NASA G-LiHT data cover only the eastern region. Pulse density ranged from 4.76 pulses m-2 in 2015 to 25.36 pulses m-2 in 2021, and point density ranged from 4.15 points m-2 in 2015 to 36.14 points m-2 in 2021.
Table 1. Forest inventory plot data used for calibrating the Random Forest model.
| Year | Number of Plots | Howland Forests Locations |
|---|---|---|
| 2021 | 13 | East Tower |
| 2023 | 11 | Main Tower |
| 2024 | 26 | Southern Howland Forest |
To extend the plot-level forest biomass data over a longer temporal range, the LANDIS-II forest landscape model along with its Biomass Succession extension was applied to simulate ecosystem dynamics in Howland Forest. The simulation started with bare ground, with tree species composition initialized based on the inventory data. A forest landscape was simulated using a 10 × 10 grid, with each grid cell size of 30 × 30 meters, for a total duration of 100 years. The simulation was conducted using an annual time step. In addition, the simulation excluded harvesting activities and other natural disturbances. Simulated aboveground biomass (AGB) from LANDIS-II was used to expand biomass information to align with the LiDAR acquisition years (Figure 3). Measured plot biomass data was matched with corresponding simulated AGB values to infer historical AGB corresponding to previous LiDAR data collection years (Figure 3).
Table 2. Summary of airborne LiDAR datasets used for Howland Research Forest biomass mapping.
| Year | Pulse Density (pulses m-2) |
Point Density (points m-2) |
Number of Tiles | Data Source |
|---|---|---|---|---|
| 2012 | 18.61 | 21.61 | 8 | 3DEP |
| 2015 | 4.76 | 4.15 | 4 | 3DEP |
| 2017 | 25.23 | 34.92 | 6 | G-LiHT |
| 2021 | 25.36 | 36.14 | 6 | G-LiHT |
| 2023 | 12.96 | 24.17 | 6 | 3DEP |
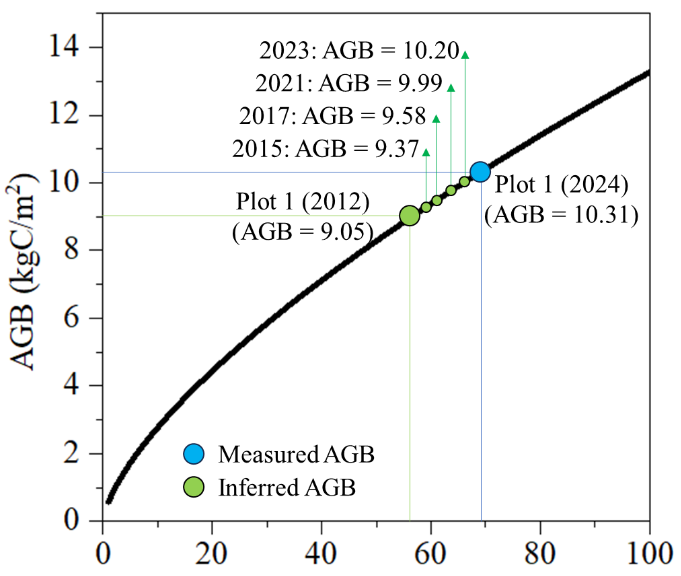
Figure 3. Simulated aboveground biomass (AGB) using the LANDIS-II model and the approach used to infer AGB values for LiDAR acquisition years. For example, the measured AGB for Plot 1 in 2024 was 10.31 kg C m-2. This value was matched with the simulated AGB trajectory to estimate AGB in previous years, resulting in inferred values of 9.05 kg C m-2 in 2012, 9.37 in 2015, 9.58 in 2017, 9.99 in 2021, and 10.20 in 2023.
A Random Forest model was used to generate wall-to-wall biomass maps for the Howland Research Forest (Figure 1). Model calibration was based on both field-derived AGB from 50 forest inventory plots and simulated AGB obtained from the LANDIS-II forest landscape model for the corresponding LiDAR acquisition years. For each plot location, co-located airborne LiDAR metrics were extracted, including maximum height, mean height, height percentiles (25th, 50th, and 75th), canopy cover, gap fraction, and vegetation density. These LiDAR-derived structural metrics were used as predictor variables, while the corresponding AGB values from either field measurements or LANDIS-II simulations served as response variables for model training. After calibration, the trained Random Forest model was applied to the full spatial extent of each LiDAR dataset. The LiDAR point clouds were rasterized at a resolution of 10 x 10 m, and the same structural metrics were computed for each grid cell. The model was then used to predict AGB across all grid cells, producing biomass maps for the entire Howland Research Forest for each year of LiDAR acquisition.
Data Access
These data are available through the Oak Ridge National Laboratory (ORNL) Distributed Active Archive Center (DAAC).
Aboveground Biomass for Howland Forest, Maine, 2012-2023
Contact for Data Center Access Information:
- E-mail: uso@daac.ornl.gov
- Telephone: +1 (865) 241-3952
References
Ayrey, E., D.J. Hayes, X. Wei, G. Shao, A. Weiskittel, S. Fei, J. Zhao, and B. Zhang. 2025. Forest Aboveground Biomass for Maine, 2023. ORNL DAAC, Oak Ridge, Tennessee, USA. https://doi.org/10.3334/ORNLDAAC/2435
Young, H.E., J.H. Ribe, and K. Wainwright. 1980. Weight tables for tree and shrub species in Maine. Life Sciences & Agriculture Experiment Station, Miscellaneous Report 230. https://digitalcommons.library.umaine.edu/aes_miscreports/19/