Documentation Revision Date: 2018-12-11
Data Set Version: 1
Summary
The 1m NAIP classification was performed in eCognition, which applies an object-oriented approach, beginning with the multi-resolution segmentation tool to isolate spectrally similar pixels as objects. Parameters for shape and compactness were set to the default values of 0.1 and 0.5, and the scale parameter, which determines segmentation size, was set by region based on trial and error. Once the segmentation was complete, the objects were classified using spectral thresholds derived from the 4 NAIP bands -- NDVI, the Normalized Difference Water Index (NDWI), and mean brightness.
There are a total of 12 files in *.zip format (compressed shapefiles *.shp). Each of the six estuarine sites has two shapefiles: a 1m resolution map of tidal marsh area classified as green vegetation, non-vegetation, or open water, and a 30m resolution map of study area boundaries as aggregated by C-CAP wetland types. All shapefiles are also provided as companion *.kmz files for convenient preview in Google Earth.
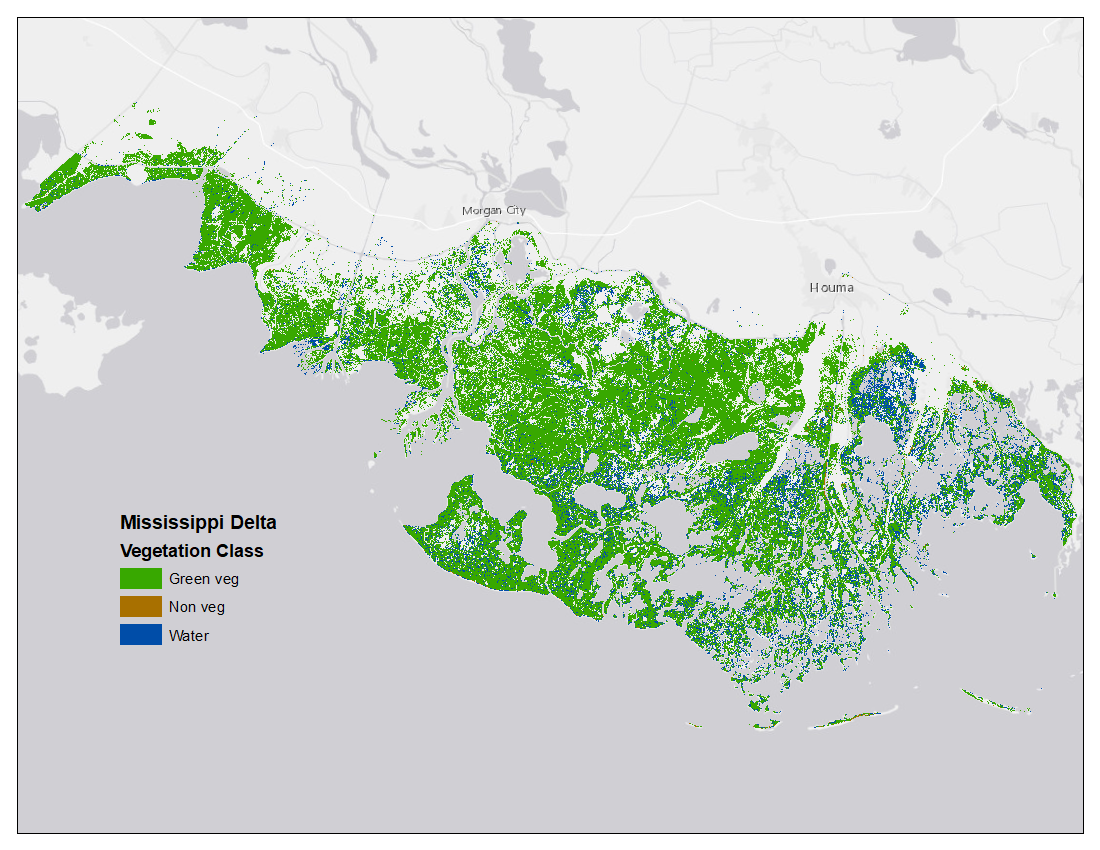
Figure 1. Map of tidal marsh green vegetation, non-vegetation, and open water at 1m resolution for the Mississippi River Delta site in Terrebonne and St. Mary Parishes, Louisiana. Source file: mississippidelta_Veg_1m.zip
Citation
Ballanti, L., and K.B. Byrd. 2018. Vegetation and Open Water High-Resolution Maps for Selected US Tidal Marshes, 2015. ORNL DAAC, Oak Ridge, Tennessee, USA. https://doi.org/10.3334/ORNLDAAC/1609
Table of Contents
- Data Set Overview
- Data Characteristics
- Application and Derivation
- Quality Assessment
- Data Acquisition, Materials, and Methods
- Data Access
- References
Data Set Overview
This dataset provides maps of tidal marsh green vegetation, non-vegetation, and open water for six estuarine regions of the conterminous United States: Cape Cod, MA; Chesapeake Bay, MD, Everglades, FL; Mississippi Delta, LA; San Francisco Bay, CA; and Puget Sound, WA. Maps were derived from current National Agriculture Imagery Program data (2013-2015) using object-based classification for estuarine and palustrine emergent tidal marshes as indicated by a modified NOAA Coastal Change Analysis Program (C-CAP) map. These 1m resolution maps were used to calculate the fraction of green vegetation within 30m Landsat pixels for the same tidal marsh regions and these data are provided in a related dataset.
Project: Carbon Monitoring System
The NASA Carbon Monitoring System (CMS) is designed to make significant contributions in characterizing, quantifying, understanding, and predicting the evolution of global carbon sources and sinks through improved monitoring of carbon stocks and fluxes. The System will use the full range of NASA satellite observations and modeling/analysis capabilities to establish the accuracy, quantitative uncertainties, and utility of products for supporting national and international policy, regulatory, and management activities. CMS will maintain a global emphasis while providing finer scale regional information, utilizing space-based and surface-based data and will rapidly initiate generation and distribution of products both for user evaluation and to inform near-term policy development and planning.
Related Publication:
Byrd, K. B., Ballanti, L., Thomas, N., Nguyen, D., Holmquist, J. R., Simard, M., Windham-Myers, L. 2018. A remote sensing-based model of tidal marsh aboveground carbon stocks for the conterminous United States. ISPRS Journal of Photogrammetry and Remote Sensing. 139, 255-271. https://doi.org/10.1016/j.isprsjprs.2018.03.019
Related Dataset:
Ballanti, L., and K.B. Byrd. 2018. Green Vegetation Fraction High-Resolution Maps for Selected US Tidal Marshes, 2015. ORNL DAAC, Oak Ridge, Tennessee, USA. https://doi.org/10.3334/ORNLDAAC/1608
Byrd, K.B., Ballanti, L.R., Thomas, N.M., Holmquist, J.R., Simard, M., Windham-Myers, L. 2018. Aboveground Biomass High-Resolution Maps for Selected US Tidal Marshes, 2015. ORNL DAAC, Oak Ridge, Tennessee, USA. https://doi.org/10.3334/ORNLDAAC/1610
Acknowledgement: This work was funded by NASA CMS Grant NNH14AY671 and the U.S. Geological Survey Land Change Science Program and LandCarbon Program.
Data Characteristics
Spatial Coverage: Six estuarine study regions across the conterminous US.
Spatial resolution: 1m and 30m resolution
Temporal coverage: The data covers the period 2013-09-25 to 2015-08-27.
Temporal resolution: One-time estimate.
Study Areas (All latitude and longitude given in decimal degrees)
| Sites | Westernmost Longitude | Easternmost Longitude | Northernmost Latitude | Southernmost Latitude |
|---|---|---|---|---|
| Cape Cod | -70.702069 | -69.926677 | 42.085077 | 41.515281 |
| Chesapeake Bay | -76.781782 | -76.388616 | 39.238401 | 38.710581 |
| Everglades | -81.463655 | -80.394194 | 25.890658 | 24.916581 |
| Louisiana | -91.88786 | -90.360627 | 29.940082 | 29.037493 |
| Puget Sound | -122.732579 | -122.665894 | 47.117398 | 47.067822 |
| San Francisco Bay | -122.616322 | -121.226056 | 38.58976 | 37.660531 |
Data File Information
Each of the six estuarine sites has two shapefiles, for a total of 12 files: a 1m resolution map of tidal marsh area classified as green vegetation, non-vegetation, or open water and a 30m resolution map of study area boundaries as aggregated by C-CAP wetland types. All shapefiles are also provided as companion *.kmz files for preview in Google Earth.
Each of the six study sites has two shapefiles provided compressed as *.zip files:
1) A 1m resolution map of the respective tidal marsh area classified as green vegetation, non-vegetation, or open water.
Naming convention: “site abbreviation”_Veg_1m.zip
Example: everglades_Veg_1m.zip
2) A 30m resolution map of study area boundaries as aggregated by C-CAP wetland types.
Naming convention: “site abbreviation”_boundary.zip
Example: everglades_boundary.zip
| Study Site | Site Abbreviation |
|---|---|
| Cape Cod | capecod |
| Chesapeake | chesapeakebay |
| Everglades | everglades |
| Louisiana | mississippidelta |
| Puget Sound | pugetsound |
| San Francisco Bay | sanfranciscobay |
Shapefile Attributes:
1) Veg_1m files
FID: Internal polygon number; sequential unique whole numbers that are automatically generated
Class_name: marsh area classified as green vegetation, non-vegetation, or open water.
2) boundary files
FID: Internal polygon number: sequential unique whole numbers that are automatically generated
gridcode: refers to wetland classes in the NOAA C-CAP land cover map
1 - estuarine emergent wetland
2 - palustrine emergent wetland
3 - estuarine scrub/shrub wetland
4 - palustrine scrub/shrub wetland
Spatial Reference System Notes:
All files are in the Universal Transverse Mercator (UTM) conformal projection system, each defined within a standard zone
1) Veg_1m files have a datum of NAD 83 because they were derived from NAIP, which has the same datum.
2) boundary files (30m) have a datum of WGS 84 because they were derived from Landsat, which has the same datum.
Application and Derivation
Remote sensing-based maps of tidal marshes, both of their extents and carbon stocks, have the potential to play a key role in conducting greenhouse gas inventories and implementing climate mitigation policies.
Remote sensing models such as described in Byrd et al. (2018) will be used to develop national GHG inventories and aid implementation of projects approved in the voluntary carbon markets. Given global coverage of Landsat, this approach can likely be expanded internationally as well. Although high resolution imagery such as NAIP is not available globally, Landsat-only models will likely provide suitable results, particularly in fully vegetated areas. Newly available global base maps of salt marshes (Mcowen et al., 2017) will also aid global implementation. While archived Landsat imagery can be used for historical estimates of aboveground C flux, moving forward, with the development of a 2015 C-CAP landcover map and continuation of Landsat satellites, future spatially explicit trends can be calculated as well.
Quality Assessment
The accuracy assessment of the NAIP classification was based on 150 random points selected for each of the six regions. Each sample point was assigned to a class based on visual interpretation of the NAIP imagery. Overall accuracy for the six regions ranged from 80.5% to 98%. The uncertainty estimates are included in the Supplemental Data attached to the Byrd et al. (2018) publication.
Data Acquisition, Materials, and Methods
Study Sites
The study regions include:
- Cape Cod peninsula, Massachusetts
- Smithsonian Environmental Research Center Global Change Research Wetland (GCReW) on Chesapeake Bay in Anne Arundel County, Maryland
- Florida Coastal Everglades Long Term Ecological Research Site in Everglades National Park, Florida
- Terrebonne and Saint Mary Parishes, Louisiana, in the Mississippi Delta
- Billy Frank Jr. Nisqually National Wildlife Refuge (NWR) in Puget Sound, Washington Washington
- San Francisco Bay, California, which was split into two sub-regions, the saline/brackish marshes and the freshwater marshes.
The specific locations of the estuarine and palustrine emergent tidal marshes in the study regions were as indicated by a modified NOAA Coastal Change Analysis Program (C-CAP) map (NOAA Office for Coastal Management, 2015).
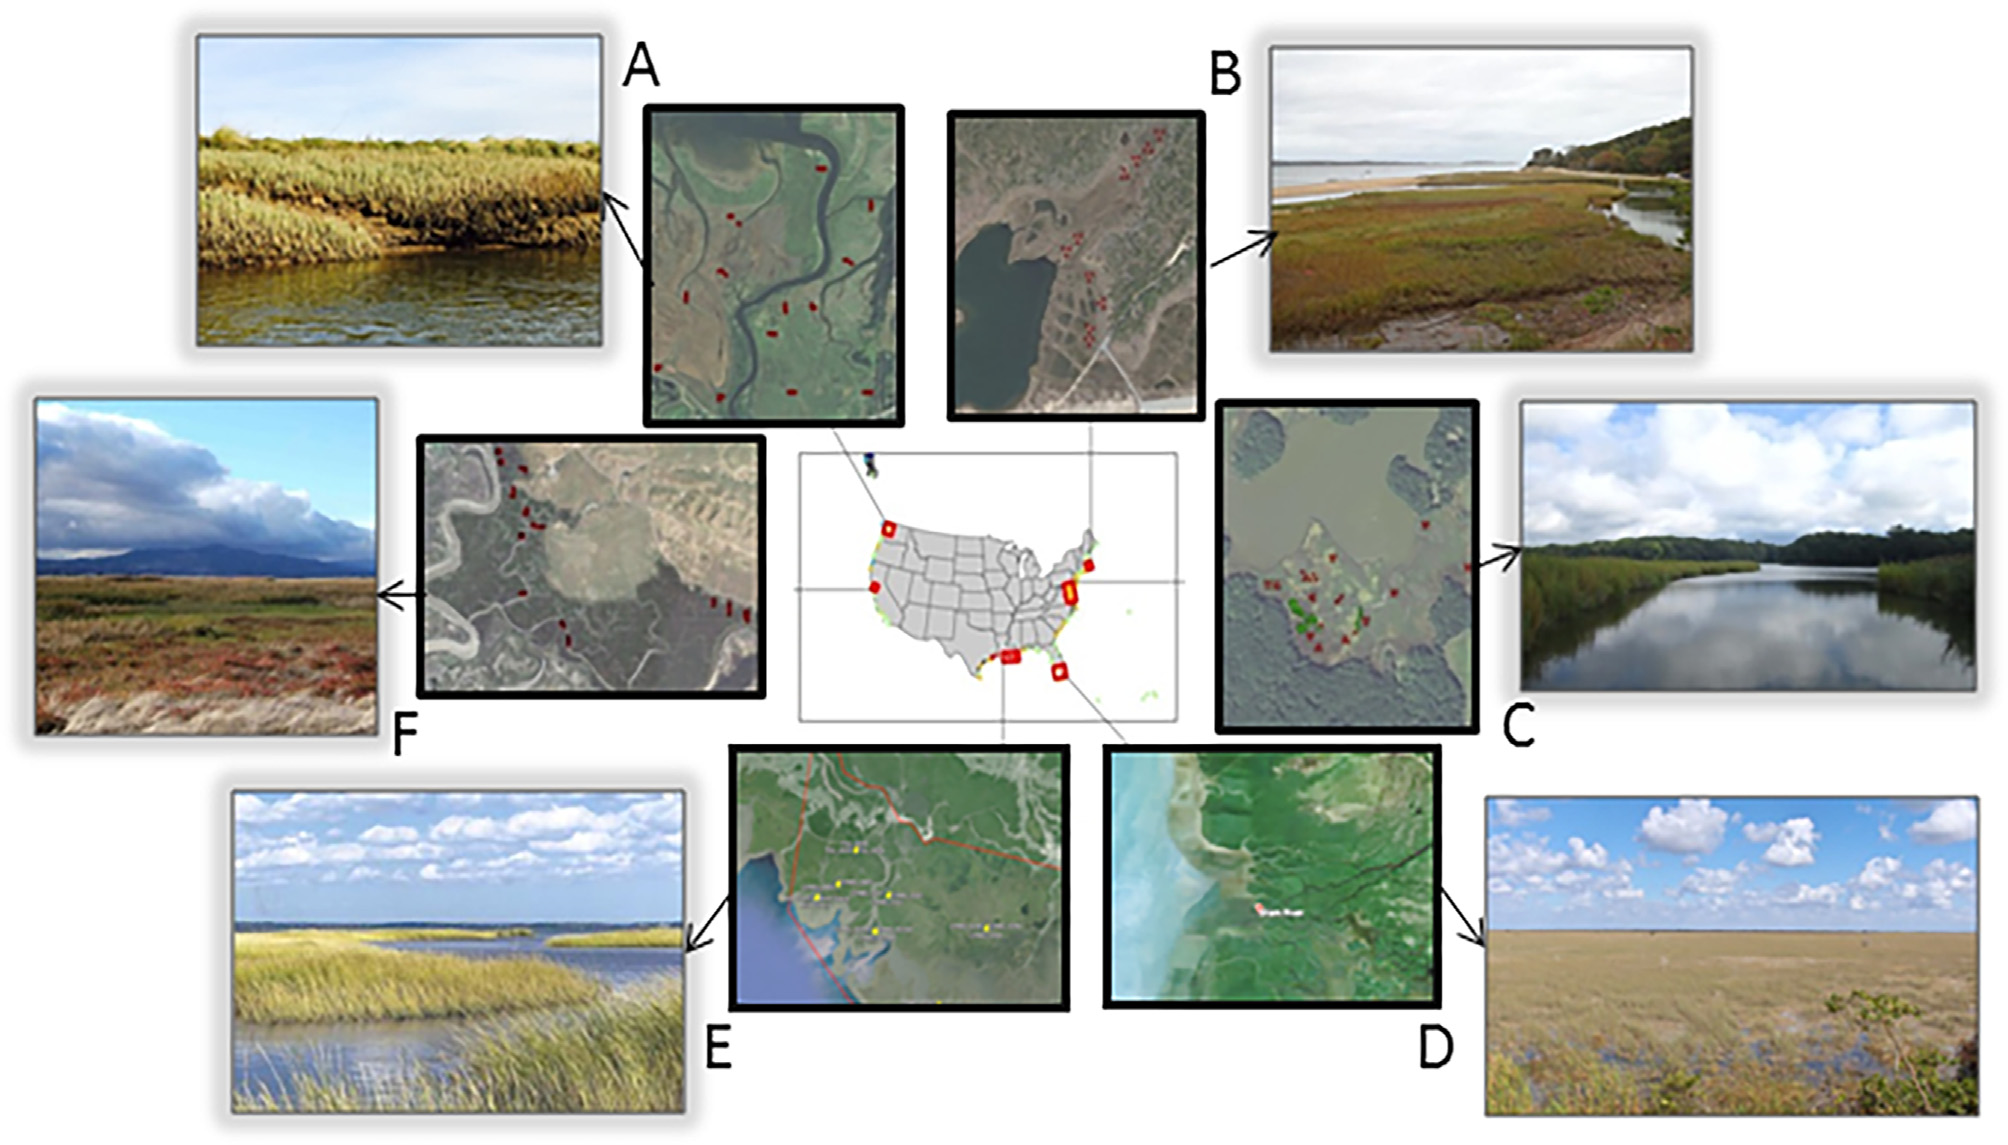
Figure 2. Photos of study regions with photo credits, from Byrd et al. (2018). (A) Puget Sound, Washington, Laurel Ballanti; (B) Cape Cod, Massachusetts, Lia McLaughlin; (C) Chesapeake Bay, Maryland, Grace Schwartz; (D) Everglades, Florida, paulsmithrj, CC BY-SA 3.0; (E) Mississippi River Delta, Louisiana, Greg Snedden; (F) San Francisco Bay, California, Jessica Schneider.
NAIP Image Classification
For each tidal marsh region, a 1m resolution map of tidal marsh green vegetation, non-vegetation, and open water from NAIP imagery was generated. NAIP images were downloaded from https://earthexplorer.usgs.gov and mosaicked in ERDAS Imagine MosaicPro using the color balance correction. The NAIP classification was performed in eCognition, which applies an object-oriented approach, beginning with the multi-resolution segmentation tool to isolate spectrally similar pixels as objects. Once the segmentation was complete, the objects were classified using spectral thresholds based on the 4 NAIP bands, NDVI, the Normalized Difference Water Index (NDWI) and mean brightness. We conducted an accuracy assessment of the NAIP classification by selecting 150 random points within each region. Each sample point was assigned to a class based on visual interpretation of the NAIP imagery [Byrd et al. (2018), Supplementary Data S3].
From this 1m resolution map of green vegetation, non-vegetation, and open water, Byrd et al. (2018) calculated the 30m fractional cover of green vegetation per Landsat pixel in estuarine and palustrine emergent tidal marshes as indicated by a modified NOAA Coastal Change Analysis Program (C-CAP) map (NOAA Office for Coastal Management, 2015) for each region. This data is available at ORNL DAAC in a related dataset.
Data Access
These data are available through the Oak Ridge National Laboratory (ORNL) Distributed Active Archive Center (DAAC).
Vegetation and Open Water High-Resolution Maps for Selected US Tidal Marshes, 2015
Contact for Data Center Access Information:
- E-mail: uso@daac.ornl.gov
- Telephone: +1 (865) 241-3952
References
Byrd, K. B., Ballanti, L., Thomas, N., Nguyen, D., Holmquist, J. R., Simard, M., Windham-Myers, L. 2018. A remote sensing-based model of tidal marsh aboveground carbon stocks for the conterminous United States. ISPRS Journal of Photogrammetry and Remote Sensing. 139, 255-271. https://doi.org/10.1016/j.isprsjprs.2018.03.019
Mcowen, C.J., Weatherdon, L.V., Bochove, J.-W.V., Sullivan, E., Blyth, S., Zockler, C., Stanwell-Smith, D., Kingston, N., Martin, C.S., Spalding, M., Fletcher, S., 2017. A global map of saltmarshes. Biodivers. Data J. 5. https://doi.org/10.3897/BDJ.5.e11764
NOAA Office for Coastal Management, 2015. NOAA Coastal Change Analysis Program (C-CAP) Regional Land Cover Database. Data collected 1995-present. Data accessed at www.coast.noaa.gov/digitalcoast/data/ccapregional, Charleston.