Documentation Revision Date: 2022-12-29
Dataset Version: 1
Summary
There are two data files in cloud-optimized GeoTIFF (.tif) format with this dataset.
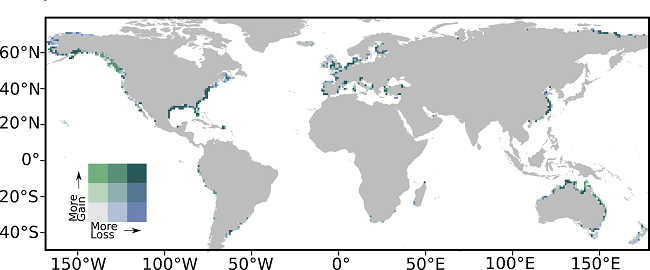
Figure 1. Global salt marsh change represented in a bivariate color scheme.
Citation
Campbell, A., T. Fatoyinbo, and L. Goldberg. 2022. Global Salt Marsh Change, 2000-2019. ORNL DAAC, Oak Ridge, Tennessee, USA. https://doi.org/10.3334/ORNLDAAC/2122
Table of Contents
- Dataset Overview
- Data Characteristics
- Application and Derivation
- Quality Assessment
- Data Acquisition, Materials, and Methods
- Data Access
- References
Dataset Overview
This dataset provides global salt marsh change, including loss and gain for five-year periods from 2000-2019. Loss and gain at a 30 m spatial resolution were estimated with Normalized Difference Vegetation Index (NDVI) anomaly algorithm using Landsat 5, 7, and 8 collections within the known extent of salt marshes. The data are provided in cloud-optimized GeoTIFF format.
Project: Carbon Monitoring System (CMS)
The NASA Carbon Monitoring System (CMS) program is designed to make significant contributions in characterizing, quantifying, understanding, and predicting the evolution of global carbon sources and sinks through improved monitoring of carbon stocks and fluxes. The System uses NASA satellite observations and modeling/analysis capabilities to establish the accuracy, quantitative uncertainties, and utility of products for supporting national and international policy, regulatory, and management activities. CMS data products are designed to inform near-term policy development and planning.
Related Publications
Campbell. A.D., T. Fatoyinbo, S.P. Charles, L.L. Bourgeau-Chavez, J. Goes, H. Gomes, M. Halabisky, J. Holmquist, S. Lohrenz, C. Mitchell, L. M. Moskal, B. Poulter, H. Qiu, C.H.R. De Sousa, M. Sayers, M. Simard, A.J. Stewart, D. Singh, C. Trettin, J. Wu, X. Zhang, and D. Lagomasino. 2022. A review of carbon monitoring in wet carbon systems using remote sensing. Environmental Research Letters 17:025009. https://doi.org/10.1088/1748-9326/ac4d4d
Campbell, A.D., Fatoyinbo, L., Goldberg, L. et al. Global hotspots of salt marsh change and carbon emissions. Nature 612, 701–706 (2022). https://doi.org/10.1038/s41586-022-05355-z
Acknowledgement
This research was supported by the NASA Carbon Monitoring System, grant number 16-CMS16-0073.
Data Characteristics
Spatial Coverage: Global extent of salt marsh ecosystms
Spatial Resolution: ~30 m
Temporal Coverage: 2000-01-01 to 2019-12-31
Temporal Resolution: 5-year epochs
Study Area: All latitudes and longitudes given in decimal degrees.
| Site | Westernmost Longitude | Easternmost Longitude | Northernmost Latitude | Southernmost Latitude |
|---|---|---|---|---|
| Global | -169.03 | 179.17 | 73.87 | -47.00 |
Data file information
There are two data files with this dataset in cloud optimized GeoTIFF format.
The files are named sm_loss.tif and sm_gain.tif, which show periods of salt marsh loss or gain, respectively.
In each file, the grid cells have values of 2000, 2005, 2010, or 2015, or 0. These values denote the time of marsh loss or gain by the starting year of five periods: 2000-2004, 2005-2009, 2010-2014, and 2015-2019. Grid cells with value 0 indicate no change in salt marsh presence during 2000-2019. Cells over open ocean and dry land have value 0.
Data are in a geographic coordinate system, WGS 84, (EPSG: 4326).
Grid cell size is 0.0002778 x 0.0002778 degrees, or approximately 30 m.
Application and Derivation
This dataset will be useful for studies of changes in coastal ecosystems and related biogeochemical cycles.
Quality Assessment
An accuracy assessment of the analyses was conducted with 12,600 validation points split evenly by 5-year epoch. The overall accuracy was 93%, 91%, 91%, and 90% in 2000-2004, 2005-2009, 2010-2014, and 2015-2019, respectively. A source of uncertainty is spatial overlap between salt marsh and mangrove.
Data Acquisition, Materials, and Methods
Trends in the global loss and gain of salt marsh ecosystems were measured for 2000 to 2019. Loss and gain at the scale of 30 m was estimated by examining changes in Normalized Difference Vegetation Index (NDVI) derived from Landsat 5, 7, and 8 collections. These collections were filtered to ensure limited cloud cover (<50%), geometric accuracy, image quality, and pixel quality; low quality scenes and pixels were removed. For validation, Google Earth Engine was used to compare a baseline NDVI for 1984-1999 to images from four 5-year periods: 2000-2004, 2005-2009, 2010-2014, and 2015-2019.
A time-series NDVI anomaly approach was used to minimize the effect of seasonal and tidal variability and to assess accuracy. Anomalies were defined as pixels that experienced greater than an absolute 0.2 magnitude of NDVI change (Goldberg et al., 2020; Lagomasino et al., 2019). Salt marsh NDVI was compared during peak biomass months of August and September for the Northern Hemisphere and February and March for the southern hemisphere.
An accuracy assessment was conducted using 12,600 stratified random points, each representative of a 30-m Landsat pixel and split into loss, gain, and stable change categories for each period. Points were selected within the known global extent of salt marsh (Mcowen et al., 2017). For each point, salt marsh status was assess using high resolution imagery from Maxar, Airbus, United States Geological Survey (USGS), and NASA via Google Earth Pro. The overall accuracy was 93%, 91%, 91%, and 90% in 2000-2004, 2005-2009, 2010-2014, and 2015-2019, respectively. A source of uncertainty is spatial overlap between salt marsh and mangrove.
Examples of the code used to process the data are available: https://github.com/campban/Global_saltmarsh
See Campbell et al. (2022, submitted) for details of project methods and findings.
Data Access
These data are available through the Oak Ridge National Laboratory (ORNL) Distributed Active Archive Center (DAAC).
Global Salt Marsh Change, 2000-2019
Contact for Data Center Access Information:
- E-mail: uso@daac.ornl.gov
- Telephone: +1 (865) 241-3952
References
Campbell. A.D., T. Fatoyinbo, S.P. Charles, L.L. Bourgeau-Chavez, J. Goes, H. Gomes, M. Halabisky, J. Holmquist, S. Lohrenz, C. Mitchell, L. M. Moskal, B. Poulter, H. Qiu, C.H.R. De Sousa, M. Sayers, M. Simard, A.J. Stewart, D. Singh, C. Trettin, J. Wu, X. Zhang, and D. Lagomasino. 2022. A review of carbon monitoring in wet carbon systems using remote sensing. Environmental Research Letters 17:025009. https://doi.org/10.1088/1748-9326/ac4d4d
Campbell, A.D., Fatoyinbo, L., Goldberg, L. et al. Global hotspots of salt marsh change and carbon emissions. Nature 612, 701–706 (2022). https://doi.org/10.1038/s41586-022-05355-z
Goldberg, L., D. Lagomasino, N. Thomas, and T. Fatoyinbo. 2020. Global declines in human-driven mangrove loss. Global Change Biology 26: 5844-5855. https://doi.org/10.1111/gcb.15275
Lagomasino, D., T. Fatoyinbo, S. Lee, E. Feliciano, C. Trettin, A. Shapiro, and M.M. Mangora. 2019. Measuring mangrove carbon loss and gain in deltas. Environmental Research Letters 14:08302. https://doi.org/10.1088/1748-9326/aaf0de
Mcowen, C.J., L.V. Weatherdon, , J. Van Bochove, E. Sullivan, S. Blyth, C. Zockler, D. Stanwell-Smith, N. Kingston, C.S. Martin, M. Spalding, and S. Fletcher. 2017. A global map of saltmarshes. Biodiversity Data Journal 5:e11764. https://doi.org/10.3897/BDJ.5.e11764