Documentation Revision Date: 2021-04-01
Dataset Version: 1
Summary
Modeled predictions were analyzed for the effects of changes over time in nitrogen inputs (i.e., fertilizer, N deposition, and manure) from terrestrial processes, climate, and atmospheric CO2 concentrations.
There are 234 files in GeoTiff (*.tif) format included in this dataset. There are 117 files from higher-order streams (≥4th order) and 117 files from headwater streams (<4th order).
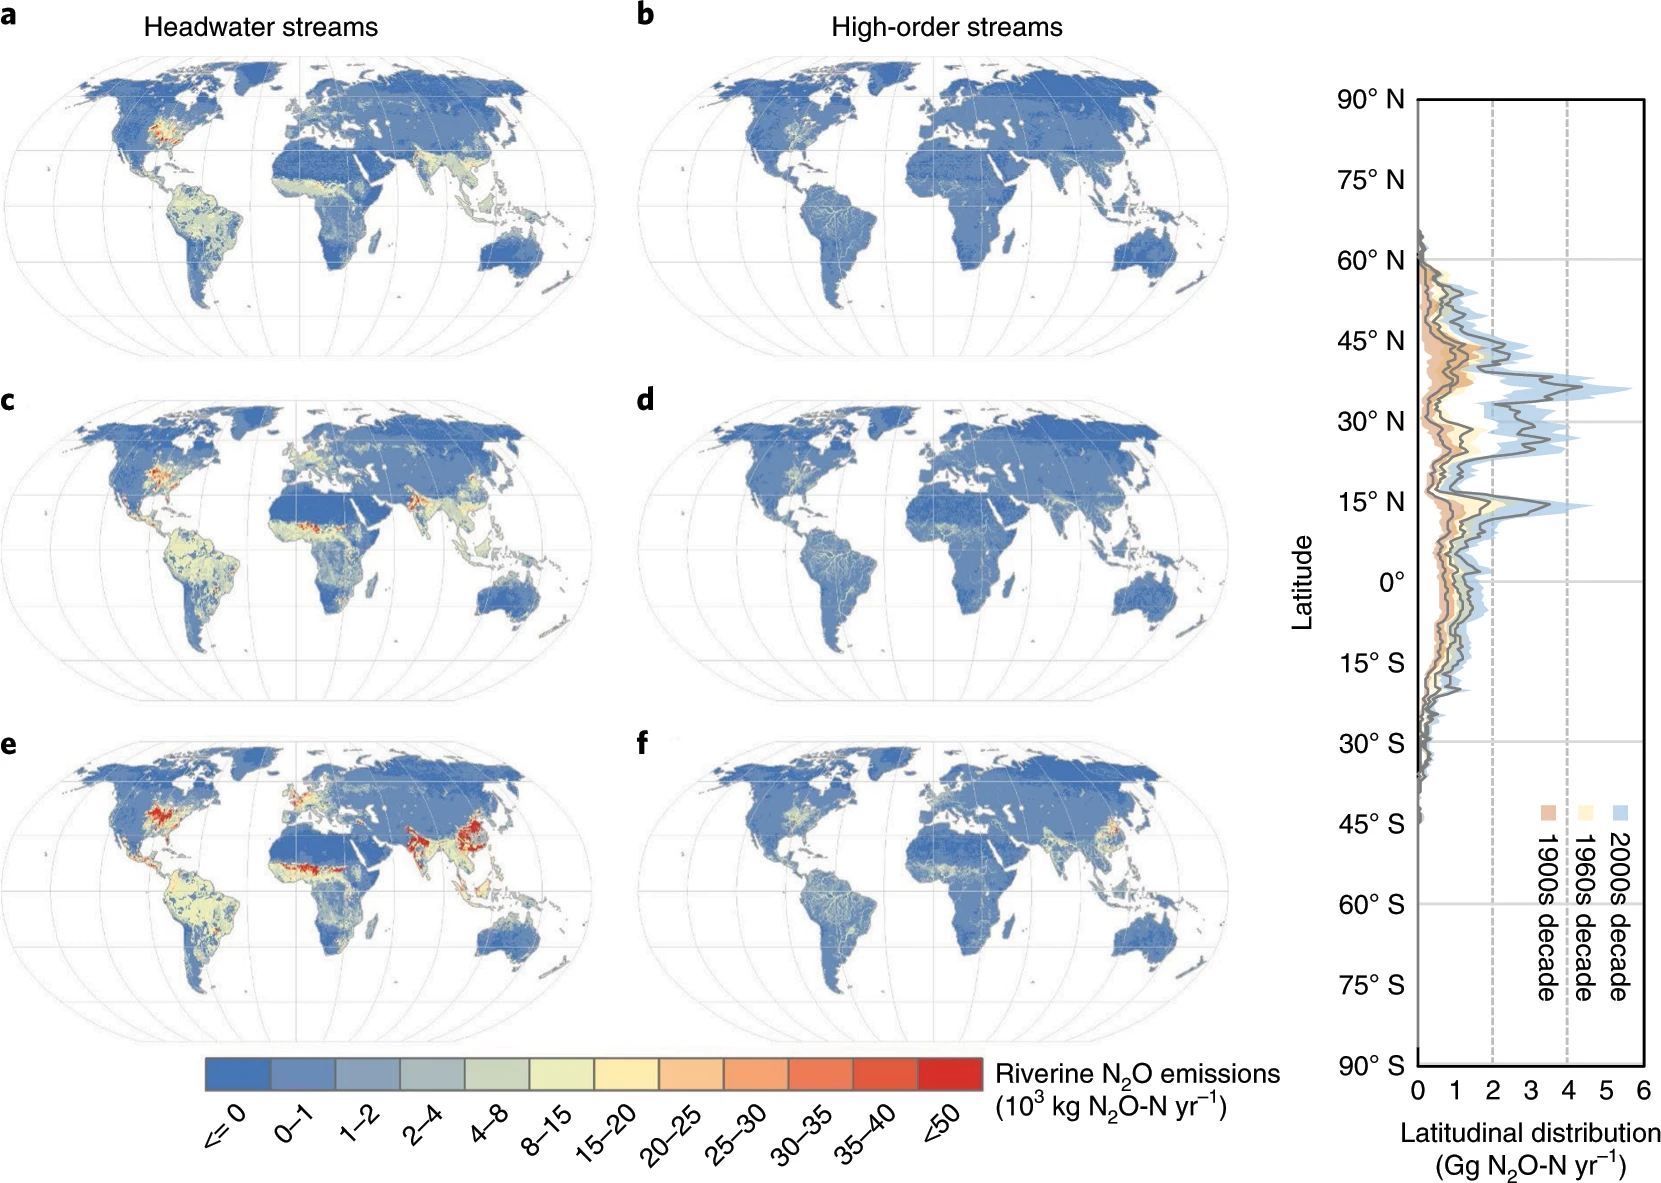
Figure 1. (a,c,e) The riverine N2O emission from headwater streams (lower than fourth stream orders) during the (a) 1900s, (c) 1960s, (e) 2000s. (b,d,f,) The riverine N2O emission from high-order rivers (higher than fourth stream order) during the (b) 1900s, (d) 1960s, (f) 2000s. The right panel shows the latitudinal distribution of riverine N2O emissions. The uncertainty range is the standard deviation (shaded areas). Source: Yao et al., 2020
Citation
Yao, Y., and H. Tian. 2021. CMS: Annual Estimates of Global Riverine Nitrous Oxide Emissions, 1900-2016. ORNL DAAC, Oak Ridge, Tennessee, USA. https://doi.org/10.3334/ORNLDAAC/1791
Table of Contents
- Dataset Overview
- Data Characteristics
- Application and Derivation
- Quality Assessment
- Data Acquisition, Materials, and Methods
- Data Access
- References
Dataset Overview
This dataset provides modeled estimates of annual nitrous oxide (N2O) emissions at a coarse geographic scale (0.5 x 0.5 degree) for two sets of global rivers and streams covering the period of 1900-2016. Emissions (g N2O-N/yr) are provided for higher-order rivers and streams (≥4th order) and headwater streams (<4th order). The estimates were derived from a water transport model, the Model for Scale Adaptive River Transport (MOSART), coupled with the Dynamic Land Ecosystem Model (DLEM) to link hydrology and ecosystem processes pertaining to N2O flux and transport. Factors driving the model included climate, land use and land cover, and nitrogen inputs (i.e., fertilizer, deposition, manure, and sewage). Nitrogen discharges from streams and rivers to the ocean were calibrated from observations from 50 river basins across the globe.
Modeled predictions were analyzed for the effects of changes over time in nitrogen inputs (i.e., fertilizer, N deposition, and manure) from terrestrial processes, climate, and atmospheric CO2 concentrations.
Project: Carbon Monitoring System
The NASA Carbon Monitoring System (CMS) is designed to make significant contributions in characterizing, quantifying, understanding, and predicting the evolution of global carbon sources and sinks through improved monitoring of carbon stocks and fluxes. The System will use the full range of NASA satellite observations and modeling/analysis capabilities to establish the accuracy, quantitative uncertainties, and utility of products for supporting national and international policy, regulatory, and management activities. CMS will maintain a global emphasis while providing finer scale regional information, utilizing space-based and surface-based data and will rapidly initiate generation and distribution of products both for user evaluation and to inform near-term policy development and planning.
Related Publication
Yao, Y., H. Tian, H. Shi, S. Pan, R. Xu, N. Pan, and J.G. Canadell. 2020. Increased global nitrous oxide emissions from streams and rivers in the Anthropocene. Nature Climate Change 10:138–142. https://doi.org/10.1038/s41558-019-0665-8
Related Dataset
Tian, H., S.E. Lohrenz, S. Pan, W.J. Cai, and R. He. 2019. Export and Leaching of Carbon and Nitrogen from Mississippi River Basin, 1901-2099. ORNL DAAC, Oak Ridge, Tennessee, USA. https://doi.org/10.3334/ORNLDAAC/1699
Acknowledgments
This work was funded by NASA Carbon Monitoring System (grants NNX14AO73G, NNX10AU06G, NNX11AD47G, and NNX14AF93G).
Data Characteristics
Spatial Coverage: Global
Spatial Resolution: 0.5 x 0.5 degrees
Temporal Coverage: 1900-01-01 to 2016-12-31
Temporal Resolution: Annual
Study Area: Latitude and longitude are given in decimal degrees.
| Site | Northernmost Latitude | Southernmost Latitude | Easternmost Longitude | Westernmost Longitude |
|---|---|---|---|---|
| Global | 88.5 | -88.5 | 180 | -180 |
Data File Information
There are 234 files in GeoTiff (*.tif) format included in this dataset 117 files with estimated emissions for higher-order streams (≥4th order) and 117 files with estimates for headwater streams (<4th order). The files are named StreamN2OyXXXX.tif and SubN2OyXXXX.tif, where XXXX represents the year of the estimate.
Table 1. File names and descriptions.
|
File Name |
Units |
Description |
|---|---|---|
|
StreamN2OyXXXX.tif |
g N2O-N/yr |
Annual N2O emission estimates* for higher-order streams (≥4th order) for the period 1900–2016. |
|
SubN2OyXXXX.tif |
g N2O-N/yr |
Annual N2O emission estimates* for headwater streams (<4th order) for the period 1900–2016. |
* There are both positive and negative N2O emission estimates. Positive values represent emissions into the atmosphere while negative values indicate that the river or stream is a sink for N2O.
Data File Details
For all files,
- CRS: "GCS_WGS_84" (EPSG: 4326)
- Datum: WGS_84
- Data Type: Float32
- Missing Data Value: -999999999
Application and Derivation
Emissions of nitrous oxide (N2O) from the world's river networks constitute a poorly constrained term in the global N2O budget. Global riverine N2O emissions account for about 3% of global terrestrial N2O emission, but the increasing rate of these riverine emissions is three times faster than terrestrial sources. The improved knowledge of the quantities, distribution, and hotspots of riverine N2O emissions can inform management strategies designed to reduce nitrogen emissions and their associated environmental impacts. Patterns in these data suggest that the reduction of nitrogen loads into headwater streams is critical (Yao et al., 2020).
Quality Assessment
Models were calibrated and validated using observations of dissolved N2O concentration, riverine N2O flux, and groundwater N2O concentration from literature and published datasets. Three sources of uncertainty were evaluated: (1) N input data-induced uncertainty, (2) river surface area-induced uncertainty, and (3) parameter-induced uncertainty. The authors performed a sensitivity analysis to evaluate key parameters, including N2O leaching from groundwater, N2O consumption rates, and rates of nitrification and denitrification. Details of the uncertainty analysis are provided in Yao et al. (2020).
Data Acquisition, Materials, and Methods
This dataset consists of modeled annual estimates of nitrous oxide (N2O) emissions (Yao et al., 2020). The authors coupled a water transport model, the Model for Scale Adaptive River Transport (MOSART), with the Dynamic Land Ecosystem Model (DLEM) to link hydrology and ecosystem processes pertaining to N2O flux and transport at a coarse geographic scale (0.5 x 0.5 degree). For model development, the global land area was divided into 10 unique regions according to their geographic and socioeconomic characteristics.
The DLEM is a fully distributed, process-based model that couples the land hydrological processes, plant physiology, soil biogeochemistry, and riverine processes. The DLEM explicitly simulates the carbon, nitrogen, and water fluxes between plants, soil, and atmosphere as driven by climate, atmospheric CO2, nitrogen deposition, and land use (e.g., N fertilizer use, irrigation, and other management practices). Terrestrial runoff and nitrogen load serve as input to the riverine model. The DLEM riverine model calculates river routing and the biogeochemical processes in the aquatic ecosystems. The simulated nitrogen loads include nitrate (NO3−), ammonium (NH4+), and dissolved organic nitrogen. The mineralization of dissolved organic nitrogen to NH4+ is mainly controlled by water temperature, while NH4+ nitrification and NO3− denitrification are primarily regulated by water temperature and flow velocity.
The aquatic model was improved through adopting a scale-adaptive river routine to quantify the physical and biogeochemical processes in small streams, which usually cannot be accounted for in most regional and global modeling research. In addition, a riverine N2O model was developed for simulating N2O emissions from river channels (Yao et al., 2020).
Model inputs included maps of potential natural vegetation map and croplands from the history database of the global environment (HYDE 3.2, ftp://ftp.pbl.nl/hyde/), daily climate variables from the CRU–NCEP dataset (https://vesg.ipsl.upmc.fr) for 1900–2016, and annual atmospheric CO2 concentration from 1900 to 2015 from the NOAA GLOBALVIEW-CO2 dataset (https://www.esrl.noaa.gov). Long-term atmospheric N2O concentration was obtained from AGAGE (https://agage.mit.edu/data/agage-data). Model simulations were driven by multiple data sources of N deposition and N fertilizer use, including two datasets of N deposition at a resolution of 0.5 × 0.5 degrees from the Atmospheric Chemistry and Climate Model Intercomparison Project (ACCMIP) and chemistry-climate model initiative (CCMI) models. Three datasets of agricultural N inputs were incorporated into the DLEM. Details of the methodology are provided in Yao et al. (2020).
Data Access
These data are available through the Oak Ridge National Laboratory (ORNL) Distributed Active Archive Center (DAAC).
CMS: Annual Estimates of Global Riverine Nitrous Oxide Emissions, 1900-2016
Contact for Data Center Access Information:
- E-mail: uso@daac.ornl.gov
- Telephone: +1 (865) 241-3952
References
Yao, Y., H. Tian, H. Shi, S. Pan, R. Xu, N. Pan, and J.G. Canadell. 2020. Increased global nitrous oxide emissions from streams and rivers in the Anthropocene. Nature Climate Change 10:138–142. https://doi.org/10.1038/s41558-019-0665-8