Documentation Revision Date: 2024-01-18
Dataset Version: 1
Summary
There are seven data files in NetCDF4 format with this dataset.
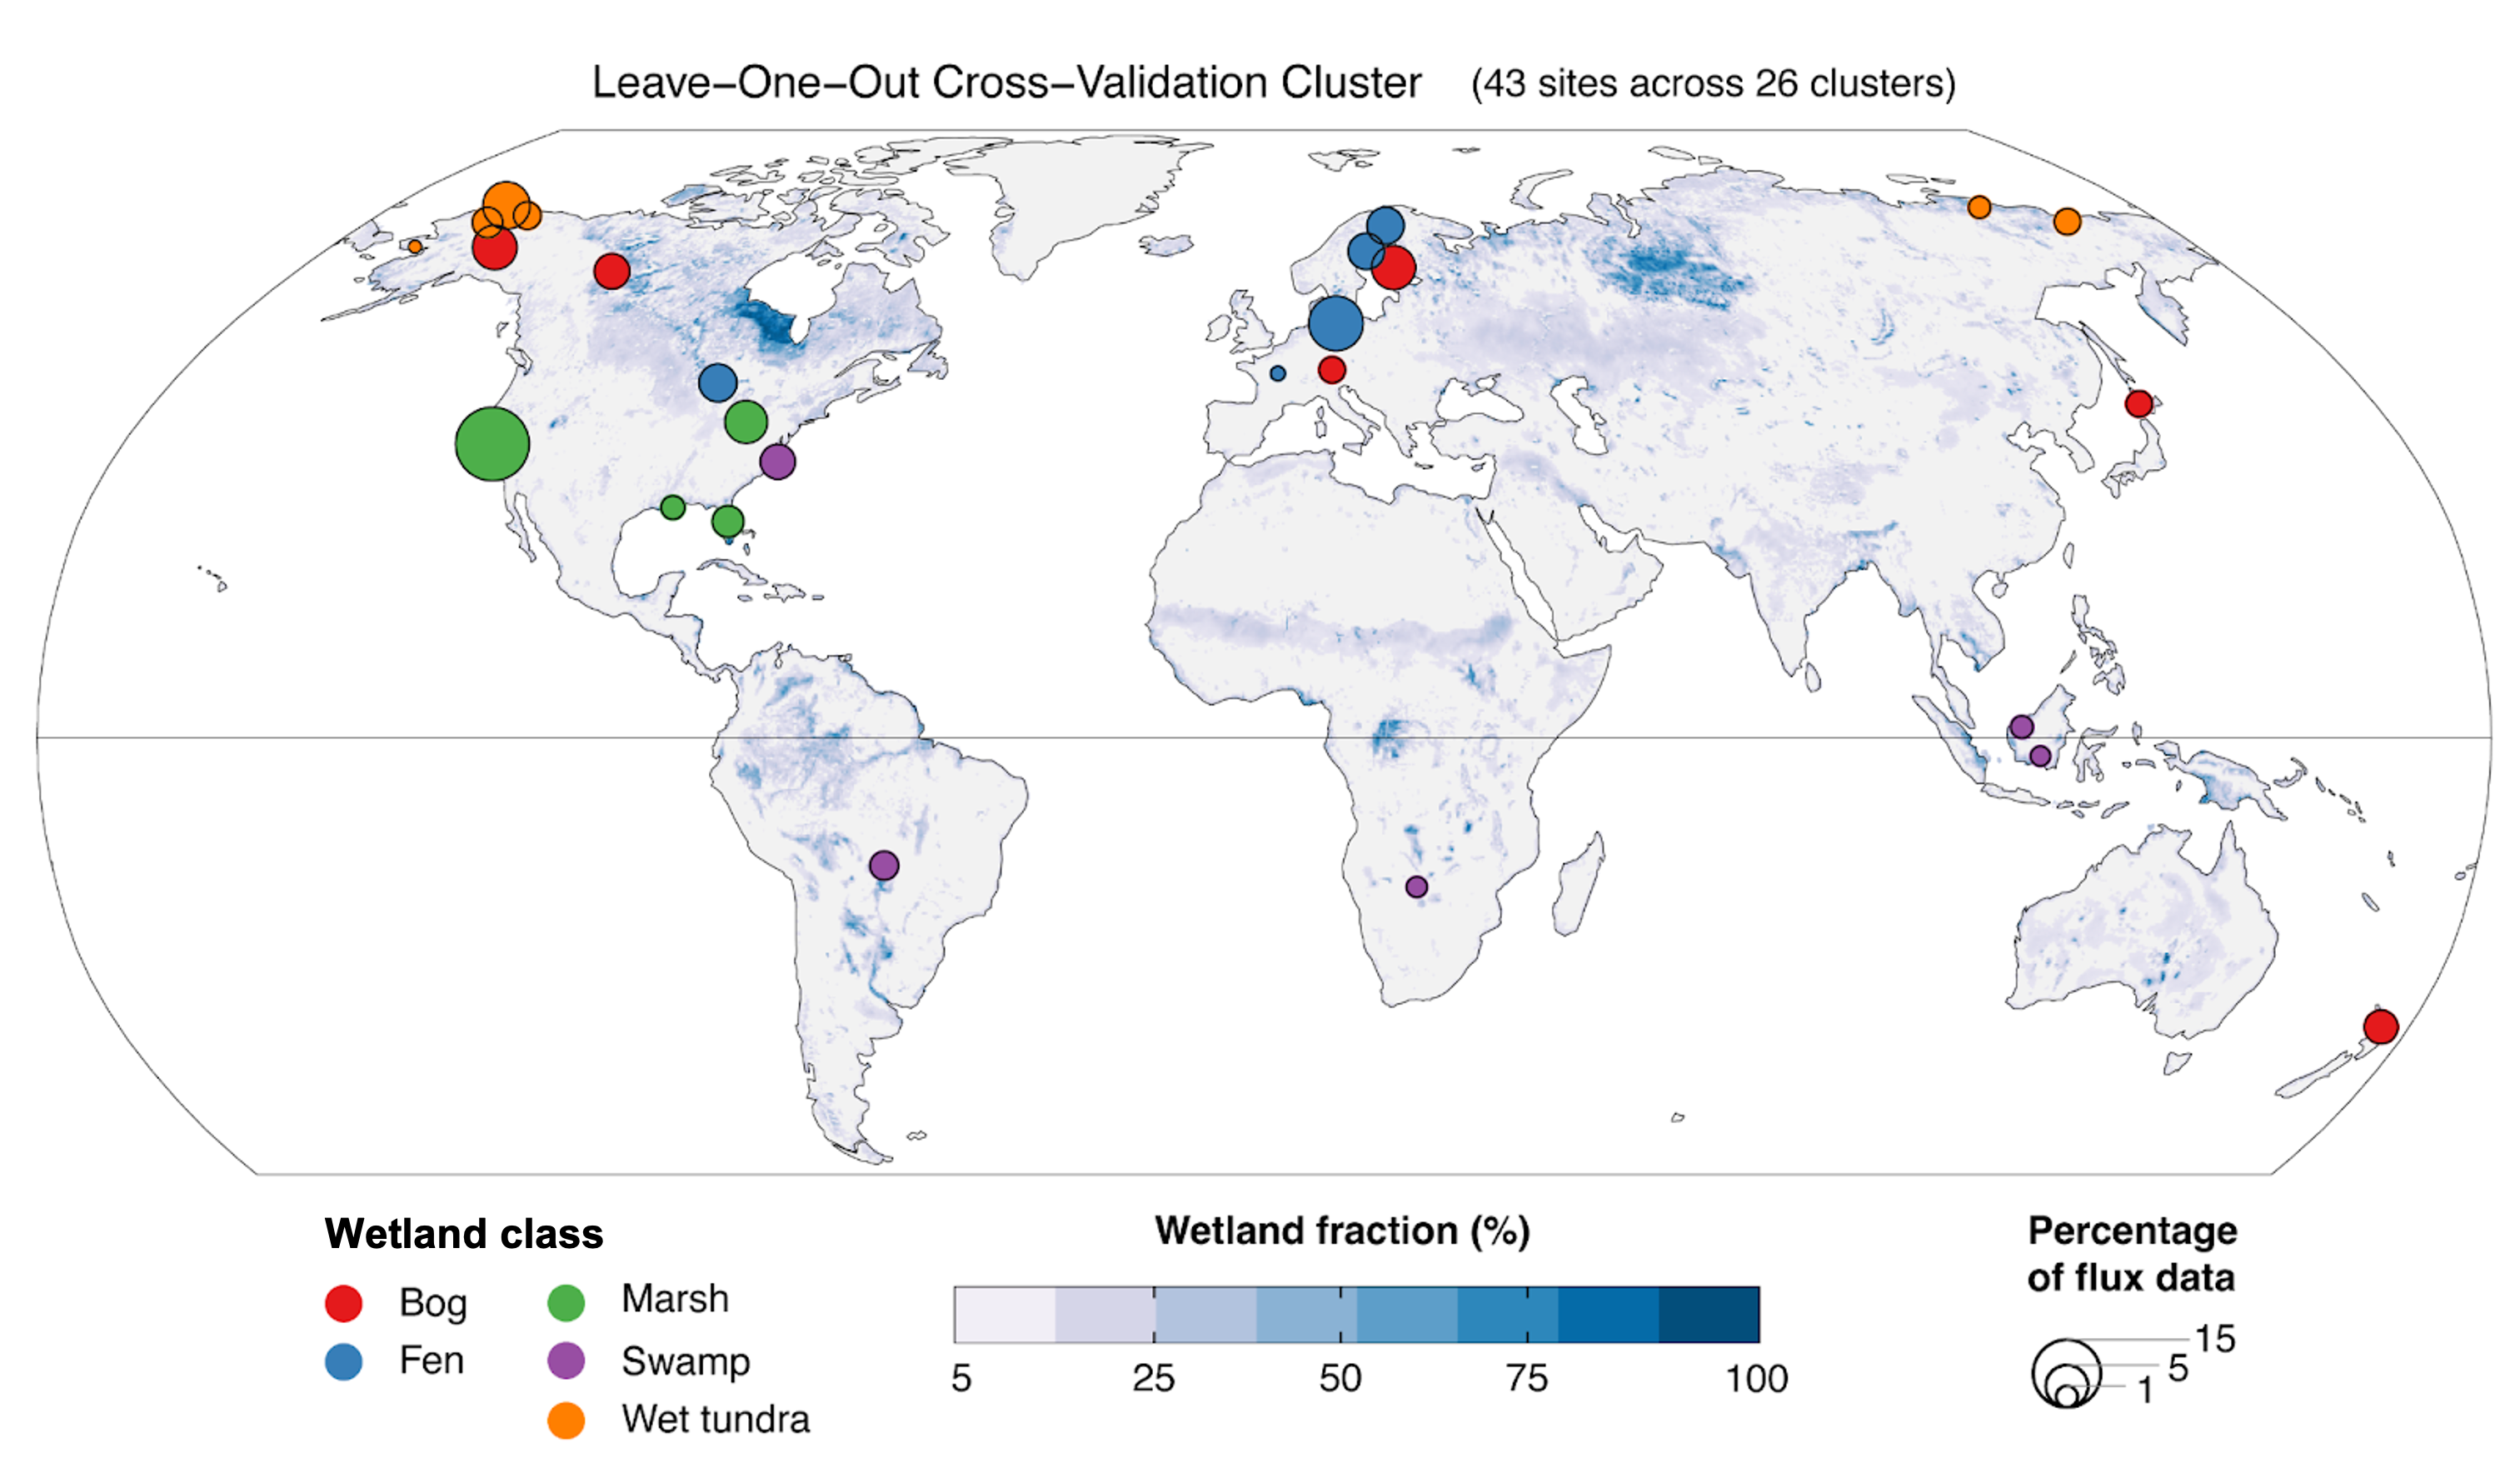
Figure 1. Location, class, and size of 26 globally distributed freshwater wetland clusters. Symbol sizes reflect the number of weekly CH4 fluxes in each cluster expressed as a percent of the total dataset considered in this study. Clusters combine data from sites that occur within 300 km of each other. At least one site was available from each major climate zone (Arctic-boreal, temperate, and tropical) and all major wetland classes were represented. Mean annual maximum wetland area fraction over 2000-2017 is shown from the Wetland Area Dynamics for Methane Modeling (WAD2M) product (Zhang et al., 2021).
Citation
McNicol, G., E. Fluet-Chouinard, Z. Ouyang, S.H. Knox, Z. Zhang, T. Aalto, S. Bansal, K.-Y. Chang, M. Chen, K. Delwiche, S.C. Feron, M. Goeckede, J. Liu, A. Malhotra, J.R. Melton, W. Riley, R. Vargas, K. Yuan, Q. Ying, Q. Zhu, P. Alekseychik, M. Aurela, D.P. Billesbach, D.I. Campbell, J. Chen, H. Chu, A.R. Desai, S.E. Euskirchen, J. Goodrich, T. Griffis, M. Helbig, T. Hirano, H. Iwata, G. Jurasinski, J. King, F. Koebsch, R. Kolka, K.W. Krauss, A. Lohila, I. Mammarella, M.B. Nilsson, A. Noormets, W. Oechel, M. Peichl, T. Sachs, A. Sakabe, C. Schulze, O. Sonnentag, R.C. Sullivan, E.S. Tuittila, M. Ueyama, T. Vesala, E.J. Ward, C. Wille, G.X. Wong, D. Zona, L. Windham-Myers, B. Poulter, and R.B. Jackson. 2023. Global Wetland Methane Emissions derived from FLUXNET and the UpCH4 Model, 2001-2018. ORNL DAAC, Oak Ridge, Tennessee, USA. https://doi.org/10.3334/ORNLDAAC/2253
Table of Contents
- Dataset Overview
- Data Characteristics
- Application and Derivation
- Quality Assessment
- Data Acquisition, Materials, and Methods
- Data Access
- References
Dataset Overview
This dataset provides monthly globally gridded freshwater wetland methane emissions from 2001-2018 in nmol CH4 m-2 s-1, g C-CH4 m-2 d-1, and TgCH4 grid cell-1 month-1. Weekly mean CH4 fluxes were computed from half-hourly FLUXNET-CH4 Version 1.0 fluxes. Each grid cell CH4 flux prediction was weighted by fractional grid cell wetland extent to estimate CH4 emissions using the primary global dataset of Wetland Area and Dynamics for Methane Modeling (WAD2M) product (Zhang et al., 2021) and an alternate Global Inundation Estimate from Multiple Satellites GIEMS version 2 (Prigent et al., 2020) global wetland map. Both WAD2M and GIEMS-2 maps were modified with several correction data layers to represent the monthly area covered by vegetated wetlands, excluding open water and coastal wetlands. The data products are: mean daily fluxes with no adjustment for wetland area (i.e., flux densities assuming hypothetical 100% wetland cover); mean daily fluxes adjusting for WAD2M or GIEMS-2 wetland area; and by-pixel monthly sum of freshwater wetland methane emissions adjusting for WAD2M or GIEMS-2 wetland area. The data are provided in NetCDF4 format.
The UpCH4 model was designed to predict CH4 fluxes globally at inundated and non-inundated (i.e., shallow water table) freshwater vegetated wetlands. Forty-five natural and restored freshwater wetland sites from the FLUXNET-CH4 database qualified for model training. The final eddy covariance tower dataset consisted of 43 freshwater wetland sites covering bog (8), fen (8), marsh (10), swamp (6), and wet tundra (11) wetland classes and distributed across Arctic-boreal (20), temperate (16), and (sub)tropical (7) climate zones.
Project: Carbon Monitoring System
The NASA Carbon Monitoring System (CMS) program is designed to make significant contributions in characterizing, quantifying, understanding, and predicting the evolution of global carbon sources and sinks through improved monitoring of carbon stocks and fluxes. The System uses NASA satellite observations and modeling/analysis capabilities to establish the accuracy, quantitative uncertainties, and utility of products for supporting national and international policy, regulatory, and management activities. CMS data products are designed to inform near-term policy development and planning.
Related Publication
McNicol, G., E. Fluet-Chouinard, Z. Ouyang, S.H. Knox, Z. Zhang, T. Aalto, S. Bansal, K.-Y. Chang, M. Chen, K. Delwiche, S.C. Feron, M. Goeckede, J. Liu, A. Malhotra, J.R. Melton, W. Riley, R. Vargas, K. Yuan, Q. Ying, Q. Zhu, P. Alekseychik, M. Aurela, D.P. Billesbach, D.I. Campbell, J. Chen, H. Chu, A.R. Desai, S.E. Euskirchen, J. Goodrich, T. Griffis, M. Helbig, T. Hirano, H. Iwata, G. Jurasinski, J. King, F. Koebsch, R. Kolka, K.W. Krauss, A. Lohila, I. Mammarella, M.B. Nilsson, A. Noormets, W. Oechel, M. Peichl, T. Sachs, A. Sakabe, C. Schulze, O. Sonnentag, R.C. Sullivan, E.S. Tuittila, M. Ueyama, T. Vesala, E.J. Ward, C. Wille, G.X. Wong, D. Zona, L. Windham-Myers, B. Poulter, and R.B. Jackson. 2023. Upscaling wetland methane emissions from the FLUXNET-CH4 eddy covariance network (UpCH4 v1.0): Model development, network assessment, and budget comparison. AGU Advances 4:e2023AV000956. https://doi.org/10.1029/2023AV000956
Acknowledgement
This study was funded by the NASA Carbon Monitoring System (NNH20ZDA001N). Additional support was provided by Gordon and Betty Moore Foundation (GBMF5439), John Wesley Powell Center for Analysis and Synthesis of the U.S. Geological Survey, ANILLO (ACT210046), CORFO (19BP-117358), and U.S. DOE (DEAC0206CH11357).
Data Characteristics
Spatial Coverage: Global
Spatial Resolution: 0.25-degree
Temporal Coverage: 2001-01-01 to 2018-12-31
Temporal Resolution: Monthly
Study Areas: Latitude and longitude are given in decimal degrees.
| Site | Westernmost Longitude | Easternmost Longitude | Northernmost Latitude | Southernmost Latitude |
|---|---|---|---|---|
| Global | -180 | 180 | 85 | -56 |
Data File Information
There are six data files in NetCDF4 format. The file names and variables are described in Table 1 and Table 2 below.
Table 1. File names and descriptions.
| File name | Units of methane emissions | Description |
|---|---|---|
| upch4_v04_m1_TgCH4month_Aw.nc | TgCH4 pixel-1 month-1 | By-pixel monthly sum of freshwater wetland methane emissions using WAD2M wetland area (Aw). |
| upch4_v04_m1_TgCH4month_Aw_giems2.nc | TgCH4 pixel-1 month-1 | By-pixel monthly sum of freshwater wetland methane emissions using GIEMS-2 wetland area (Aw) |
| upch4_v04_m1_gCm2day.nc | g C m-2 d-1 | Mean daily freshwater wetland methane fluxes (2001-2018) with no adjustment for wetland area (i.e., flux densities assuming hypothetical 100% wetland cover) |
| upch4_v04_m1_mgCH4m2day_Aw.nc | mg m-2 d-1 | Mean daily freshwater wetland methane fluxes (2001-2018) using WAD2M wetland area (Aw) |
| upch4_v04_m1_mgCH4m2day_Aw_giems2.nc | mg m-2 d-1 | Mean daily freshwater wetland methane fluxes (2001-2018) using GIEMS-2 wetland area (Aw) |
| upch4_v04_m1_nmolm2sec.nc | nmol m-2 s-1 | Mean freshwater wetland methane fluxes (2001-2018) with no adjustment for wetland area (i.e., flux densities assuming hypothetical 100% wetland cover) |
Note: All products use a 0.25-degree global grid.
Table 2. Variables in all data files. Units for for *_ch4 variables are listed in Table 1.
| Variable | Description |
|---|---|
| time | Time in months since 2001-01 |
| longitude | degrees_east |
| latitude | degrees_north |
| mean_ch4 | Mean methane emissions |
| sd_ch4 | Standard deviation methane emissions |
| var_ch4 | variance in methane emissions |
Application and Derivation
Wetlands are responsible for 20-31% of global methane (CH4) emissions and account for a large source of uncertainty in the global CH4 budget. Data-driven upscaling of CH4 fluxes from eddy covariance measurements can provide new and independent bottom-up estimates of wetland CH4 emissions.
Quality Assessment
A random forest model ensemble was trained to propagate uncertainties in training data to a gridded product.
Model performance was evaluated by comparing predicted and observed CH4 fluxes using the coefficient of determination (R2), MAE normalized by flux standard deviation (nMAE), and bias, computed as the mean of residuals. Nash-Sutcliffe Efficiency (NSE) was also computed as an integrative measure of model performance. NSE is equal to R2 when model bias is zero, and a NSE > 0 corresponds to a model performance better than simply taking the average of the data. Performance was evaluated with respect to three dataset components: site mean flux, mean seasonal cycle (MSC) calculated as the average monthly anomaly from site mean, and interannual monthly anomalies from the MSC (Tramontana et al., 2016; Jung et al., 2020; Peltola et al., 2019).
Refer to McNicol et al. (2023) for additional details.
Data Acquisition, Materials, and Methods
Predictive Modeling
Data were derived with a six-predictor random forest upscaling model (UpCH4), trained on 119 site-years of eddy covariance CH4 flux data from 43 freshwater wetland sites in the FLUXNET-CH4 Community Product. The final eddy covariance tower dataset consisted of 43 freshwater wetland sites covering bog (8), fen (8), marsh (10), swamp (6), and wet tundra (11) wetland classes and distributed across Arctic-boreal (20), temperate (16), and (sub)tropical (7) climate zones.
Weekly mean CH4 fluxes were computed from half-hourly FLUXNET-CH4 Version 1.0 fluxes, which are available as a standardized gap-filled product (Delwiche et al., 2021). Weekly fluxes were only retained when there was a minimum of 1 day (48 half-hours or ~14%) of CH4 observations.
Sites within 300 km of each other were grouped together, resulting in 26 clusters that were used for spatial leave-one-out cross-validation (LOOCV) of the machine learning model, where each training/validation fold consisted of all data except one hold-out cluster (Meyer et al., 2019).
A total of 140 candidate predictors were considered for data-driven upscaling. These candidate predictors were organized into five broad classes: climatic (e.g., temperature, precipitation), biometeorological (i.e., flux tower-measured air temperature, and ecosystem carbon and energy fluxes), land cover class and properties (e.g., vegetation class), soil physical and chemical properties (e.g., clay content), topography (e.g., slope), and vegetation indices (e.g., vegetation greenness). Each predictor class contains data from different sources (e.g., models, tower-observations, and/or remote sensing) and information content (e.g., spatial only, temporal only, or spatio-temporal). Gridded data products were extracted at pixels corresponding to tower locations and used directly in model development whereas tower-measured data, when available, were used preferentially in model training and then substituted by a globally gridded product to force the model during upscaling runs (e.g., tower-measured air temperature was mapped to the MERRA-2 reanalysis air temperature gridded product).
Lead and lag times of one, two, or three weeks or months (for weekly and monthly data, respectively) were imposed on all temporally-resolved predictors, corresponding to multi-day and seasonal lead and lag timescales identified between wetland CH4 fluxes, and temperature, eddy covariance-derived gross primary production (GPP), and soil moisture-related drivers (Delwiche et al., 2021; Knox et al., 2021). For MODIS data, monthly mean seasonal cycles (MSC) and other annual metrics (e.g., site-year mean, minimum, maximum, amplitude) were also derived. A total of 273 predictors were available for model training.
Forward feature selection (FFS) was used to identify the optimal predictor subset from across all possible predictors to use in the final model (Gregorutti et al., 2017; Meyer et al., 2018). After FFS, random forest models were re-trained using the final predictor set, and their predictive performance was evaluated using leave one (cluster) out cross validation (cross validation, hereafter) (Meyer et al., 2018).
Upscaling Global CH4 Flux-Final Model Ensemble
A final random forest model ensemble was trained to propagate uncertainties in training data to a gridded product.
The 500-member final model ensemble was applied to an 18-year (216-month) time series of global grids of final predictor variables covering 2001-2018 from which the mean and standard deviation of predictions at each pixel globally was used as mean CH4 flux and data-driven uncertainty. The reconstruction period (2001-2018) aligns with the current Global Carbon Project CH4 modeling protocol and the monthly timestep of the WAD2M wetland extent product (Saunois et al., 2020; Zhang et al., 2021), though weekly data were used to train the machine learning model. For MODIS data, Google Earth Engine (Gorelick et al., 2017) was first used to prepare global monthly grids at 10-km resolution, excluding low quality observations, aggregating from 8-day values to monthly averages using the average of all good 8-day observations within a month, and aggregating from 500-m resolution to 10-km resolution using the average of all good quality 500-m or 1000-m observations within the 10-km pixel. Gaps of time-series of MODIS images were filled using the same methods as for site-based MODIS time series. All global grids were then resampled to a common 0.25° resolution and cropped to exclude Antarctica. Data were reprojected to WGS-84 geographic coordinates. Monthly positive and negative lags were imposed on grid stacks by shifting the stack by whole-month time steps, and linear interpolation between these shifts was used to create weekly time shifts. For each temporal predictor, a mean seasonal cycle stack was created by averaging rasters for each month across all available years for use in the global dissimilarity and tower constituency analyses.
Wetland Area Products
Each grid cell CH4 flux prediction was weighted by fractional grid cell wetland extent to estimate CH4 emissions using the primary WAD2M (Zhang et al., 2021) product and an alternate Global Inundation Estimate from Multiple Satellites GIEMS version 2 (Prigent et al., 2020) global wetland map. Both WAD2M and GIEMS-2 maps were modified with several correction data layers to represent the monthly area covered by vegetated wetlands, excluding open water and coastal wetlands. The maps were generated based on distinct multi-sensor methodologies estimating monthly inundated wetland area, to which a set of tailored correction layers and steps were applied to isolate only vegetated wetland area, following the methodology of Zhang et al. (2021).
Global Applicability and Tower Constituency
Upscaled model predictions were extrapolated across a much larger spatial (Stell et al., 2021) and temporal (Chu et al., 2017) domain than that captured in the training data. To measure extrapolation during CH4 upscaling, computed point-based dissimilarity was computed (Hoffman et al., 2013) globally, defined as the minimum Euclidean distance between each grid cell-to-flux tower pair in predictor space, normalized by the mean distance among flux towers (Meyer et al., 2018, 2019). The dissimilarity map was then used to define a monthly, global area of model applicability (AOA) and corresponding area of extrapolation, using a dissimilarity threshold (Meyer and Pebesma, 2022). Finally, the global constituency of each site cluster was defined to identify which training conditions dominate global predictions and further evaluate the plausibility of global extrapolations.
See McNicol et al. (2023) for additional details.
Data Access
These data are available through the Oak Ridge National Laboratory (ORNL) Distributed Active Archive Center (DAAC).
Global Wetland Methane Emissions derived from FLUXNET and the UpCH4 Model, 2001-2018
Contact for Data Center Access Information:
- E-mail: uso@daac.ornl.gov
- Telephone: +1 (865) 241-3952
References
Chu, H., D.D. Baldocchi, R. John, S. Wolf, and M. Reichstein. 2017. Fluxes all of the time? A primer on the temporal representativeness of FLUXNET. Journal of Geophysical Research: Biogeosciences 122:289–307. https://doi.org/10.1002/2016JG003576
Delwiche, K.B., S.H. Knox, A. Malhotra, E. Fluet-Chouinard, G. McNicol, S. Feron, Z. Ouyang, D. Papale, C. Trotta, E. Canfora, Y.-W. Cheah, D. Christianson, Ma. C.R. Alberto, P. Alekseychik, M. Aurela, D. Baldocchi, S. Bansal, D.P. Billesbach, G. Bohrer, R. Bracho, N. Buchmann, D.I. Campbell, G. Celis, J. Chen, W. Chen, H. Chu, H.J. Dalmagro, S. Dengel, A.R. Desai, M. Detto, H. Dolman, E. Eichelmann, E. Euskirchen, D. Famulari, K. Fuchs, M. Goeckede, S. Gogo, M.J. Gondwe, J.P. Goodrich, P. Gottschalk, S.L. Graham, M. Heimann, M. Helbig, C. Helfter, K.S. Hemes, T. Hirano, D. Hollinger, L. Hörtnagl, H. Iwata, A. Jacotot, G. Jurasinski, M. Kang, K. Kasak, J. King, J. Klatt, F. Koebsch, K.W. Krauss, D.Y. F. Lai, A. Lohila, I. Mammarella, L. Belelli Marchesini, G. Manca, J.H. Matthes, T. Maximov, L. Merbold, B. Mitra, T.H. Morin, E. Nemitz, M.B. Nilsson, S. Niu, W.C. Oechel, P.Y. Oikawa, K. Ono, M. Peichl, O. Peltola, M.L. Reba, A.D. Richardson, W. Riley, B.R. K. Runkle, Y. Ryu, T. Sachs, A. Sakabe, C.R. Sanchez, E.A. Schuur, K.V. R. Schäfer, O. Sonnentag, J.P. Sparks, E. Stuart-Haëntjens, C. Sturtevant, R.C. Sullivan, D.J. Szutu, J.E. Thom, M.S. Torn, E.-S. Tuittila, J. Turner, M. Ueyama, A.C. Valach, R. Vargas, A. Varlagin, A. Vazquez-Lule, J.G. Verfaillie, T. Vesala, G.L. Vourlitis, E.J. Ward, C. Wille, G. Wohlfahrt, G.X. Wong, Z. Zhang, D. Zona, L. Windham-Myers, B. Poulter, and R.B. Jackson. 2021. FLUXNET-CH4: a global, multi-ecosystem dataset and analysis of methane seasonality from freshwater wetlands. Earth System Science Data 13:3607–3689. https://doi.org/10.5194/essd-13-3607-2021
Gorelick, N., M. Hancher, M. Dixon, S. Ilyushchenko, D. Thau, and R. Moore. 2017. Google Earth Engine: Planetary-scale geospatial analysis for everyone.
Gregorutti, B., B. Michel, and P. Saint-Pierre. 2017. Correlation and variable importance in random forests. Statistics and Computing 27:659–678. https://doi.org/10.1007/s11222-016-9646-1
Hoffman, F.M., J. Kumar, R.T. Mills, and W.W. Hargrove. 2013. Representativeness-based sampling network design for the State of Alaska. Landscape Ecology 28:1567–1586. https://doi.org/10.1007/s10980-013-9902-0
Jung, M., C. Schwalm, M. Migliavacca, S. Walther, G. Camps-Valls, S. Koirala, P. Anthoni, S. Besnard, P. Bodesheim, N. Carvalhais, F. Chevallier, F. Gans, D.S. Goll, V. Haverd, P. Köhler, K. Ichii, A.K. Jain, J. Liu, D. Lombardozzi, J.E. M.S. Nabel, J.A. Nelson, M. O’Sullivan, M. Pallandt, D. Papale, W. Peters, J. Pongratz, C. Rödenbeck, S. Sitch, G. Tramontana, A. Walker, U. Weber, and M. Reichstein. 2020. Scaling carbon fluxes from eddy covariance sites to globe: synthesis and evaluation of the FLUXCOM approach. Biogeosciences 17:1343–1365. https://doi.org/10.5194/bg-17-1343-2020
Knox, S.H., S. Bansal, G. McNicol, K. Schafer, C. Sturtevant, M. Ueyama, A.C. Valach, D. Baldocchi, K. Delwiche, A.R. Desai, E. Euskirchen, J. Liu, A. Lohila, A. Malhotra, L. Melling, W. Riley, B.R. K. Runkle, J. Turner, R. Vargas, Q. Zhu, T. Alto, E. FluetâÂÂÂÂÂÂÂÂÂÂÂÂChouinard, M. Goeckede, J.R. Melton, O. Sonnentag, T. Vesala, E. Ward, Z. Zhang, S. Feron, Z. Ouyang, P. Alekseychik, M. Aurela, G. Bohrer, D.I. Campbell, J. Chen, H. Chu, H.J. Dalmagro, J.P. Goodrich, P. Gottschalk, T. Hirano, H. Iwata, G. Jurasinski, M. Kang, F. Koebsch, I. Mammarella, M.B. Nilsson, K. Ono, M. Peichl, O. Peltola, Y. Ryu, T. Sachs, A. Sakabe, J.P. Sparks, E. Tuittila, G.L. Vourlitis, G.X. Wong, L. WindhamâÂÂÂÂÂÂÂÂÂÂÂÂMyers, B. Poulter, and R.B. Jackson. 2021. Identifying dominant environmental predictors of freshwater wetland methane fluxes across diurnal to seasonal time scales. Global Change Biology 27:3582–3604. https://doi.org/10.1111/gcb.15661
McNicol, G., E. Fluet-Chouinard, Z. Ouyang, S.H. Knox, Z. Zhang, T. Aalto, S. Bansal, K.-Y. Chang, M. Chen, K. Delwiche, S.C. Feron, M. Goeckede, J. Liu, A. Malhotra, J.R. Melton, W. Riley, R. Vargas, K. Yuan, Q. Ying, Q. Zhu, P. Alekseychik, M. Aurela, D.P. Billesbach, D.I. Campbell, J. Chen, H. Chu, A.R. Desai, S.E. Euskirchen, J. Goodrich, T. Griffis, M. Helbig, T. Hirano, H. Iwata, G. Jurasinski, J. King, F. Koebsch, R. Kolka, K.W. Krauss, A. Lohila, I. Mammarella, M.B. Nilsson, A. Noormets, W. Oechel, M. Peichl, T. Sachs, A. Sakabe, C. Schulze, O. Sonnentag, R.C. Sullivan, E.S. Tuittila, M. Ueyama, T. Vesala, E.J. Ward, C. Wille, G.X. Wong, D. Zona, L. Windham-Myers, B. Poulter, and R.B. Jackson. 2023. Upscaling wetland methane emissions from the FLUXNET-CH4 eddy covariance network (UpCH4 v1.0): Model development, network assessment, and budget comparison. AGU Advances 4:e2023AV000956. https://doi.org/10.1029/2023AV000956
Meyer, H., and E. Pebesma. 2022. Machine learning-based global maps of ecological variables and the challenge of assessing them. Nature Communications 131:2208. https://doi.org/10.1038/s41467-022-29838-9
Meyer, H., C. Reudenbach, T. Hengl, M. Katurji, and T. Nauss. 2018. Improving performance of spatio-temporal machine learning models using forward feature selection and target-oriented validation. Environmental Modelling & Software 101:1-1273. https://dx.doi.org/10.1016/j.envsoft.2017.12.001
Meyer, H., C. Reudenbach, S. Wöllauer, S and T. Nauss. 2019. Importance of spatial predictor variable selection in machine learning applications -- Moving from data reproduction to spatial prediction. Ecological Modelling 411:108815. https://doi.org/10.1016/j.ecolmodel.2019.108815
Peltola, O., T. Vesala, Y. Gao, O. Räty, P. Alekseychik, M. Aurela, B. Chojnicki, A.R. Desai, A.J. Dolman, E.S. Euskirchen, T. Friborg, M. Göckede, M. Helbig, E. Humphreys, R.B. Jackson, G. Jocher, F. Joos, J. Klatt, S.H. Knox, N. Kowalska, L. Kutzbach, S. Lienert, A. Lohila, I. Mammarella, D.F. Nadeau, M.B. Nilsson, W.C. Oechel, M. Peichl, T. Pypker, W. Quinton, J. Rinne, T. Sachs, M. Samson, H.P. Schmid, O. Sonnentag, C. Wille, D. Zona, and T. Aalto. 2019. Monthly gridded data product of northern wetland methane emissions based on upscaling eddy covariance observations. Earth System Science Data 11:1263–1289. https://doi.org/10.5194/essd-11-1263-2019
Prigent, C., C. Jimenez, and P. Bousquet, P. 2020. Satellite-derived global surface water extent and dynamics over the last 25 years (GIEMS-2). Journal of Geophysical Research: Atmospheres 125:e2019JD030711. https://doi.org/10.1029/2019jd030711
Saunois, M., A.R. Stavert, B. Poulter, P. Bousquet, J.G. Canadell, R.B. Jackson, P.A. Raymond, E.J. Dlugokencky, S. Houweling, P.K. Patra, P. Ciais, V.K. Arora, D. Bastviken, P. Bergamaschi, D.R. Blake, G. Brailsford, L. Bruhwiler, K.M. Carlson, M. Carrol, S. Castaldi, N. Chandra, C. Crevoisier, P.M. Crill, K. Covey, C.L. Curry, G. Etiope, C. Frankenberg, N. Gedney, M.I. Hegglin, L. Höglund-Isaksson, G. Hugelius, M. Ishizawa, A. Ito, G. Janssens-Maenhout, K.M. Jensen, F. Joos, T. Kleinen, P.B. Krummel, R.L. Langenfelds, G.G. Laruelle, L. Liu, T. Machida, S. Maksyutov, K.C. McDonald, J. McNorton, P.A. Miller, J.R. Melton, I. Morino, J. Müller, F. Murguia-Flores, V. Naik, Y. Niwa, S. Noce, S. O’Doherty, R.J. Parker, C. Peng, S. Peng, G.P. Peters, C. Prigent, R. Prinn, M. Ramonet, P. Regnier, W.J. Riley, J.A. Rosentreter, A. Segers, I.J. Simpson, H. Shi, S.J. Smith, L.P. Steele, B.F. Thornton, H. Tian, Y. Tohjima, F.N. Tubiello, A. Tsuruta, N. Viovy, A. Voulgarakis, T.S. Weber, M. van Weele, G.R. van der Werf, R.F. Weiss, D. Worthy, D. Wunch, Y. Yin, Y. Yoshida, W. Zhang, Z. Zhang, Y. Zhao, B. Zheng, Q. Zhu, Q. Zhu, and Q. Zhuang. 2020. The Global Methane Budget 2000–2017. Earth System Science Data 12:1561–1623. https://doi.org/10.5194/essd-12-1561-2020
Stell, E., D. Warner, J. Jian, B. Bond-Lamberty, and R. Vargas. 2021. Spatial biases of information influence global estimates of soil respiration: How can we improve global predictions? Global Change Biology 27:3923–3938. https://doi.org/10.1111/gcb.15666.
Tramontana, G., M. Jung, C.R. Schwalm, K. Ichii, G. Camps-Valls, B. Ráduly, M. Reichstein, M.A. Arain, A. Cescatti, G. Kiely, L. Merbold, P. Serrano-Ortiz, S. Sickert, S. Wolf, and D. Papale. 2016. Predicting carbon dioxide and energy fluxes across global FLUXNET sites with regression algorithms. Biogeosciences 13:4291–4313. https://doi.org/10.5194/bg-13-4291-2016.
Zhang, Z., E. Fluet-Chouinard, K. Jensen, K. McDonald, G. Hugelius, T. Gumbricht, M. Carroll, C. Prigent, A. Bartsch, and B. Poulter. 2021. Development of the global dataset of Wetland Area and Dynamics for Methane Modeling WAD2M. Earth System Science Data 13:2001–2023. https://doi.org/10.5194/essd-13-2001-2021