Documentation Revision Date: 2022-04-07
Dataset Version: 1
Summary
There are 1,339 data files in netCDF format (*.nc4) included in this dataset. Also included is one companion file in media (*.mp4) format.
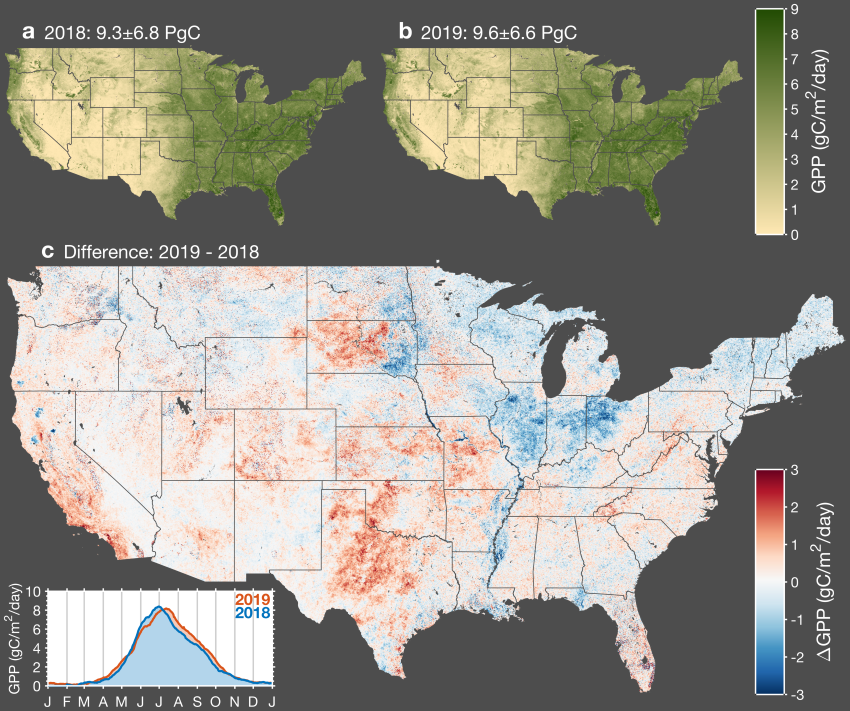
Figure 1. Interannual variation in gross primary productivity (GPP) across conterminous United States. Map of annual mean GPP for 2018 (a) and 2019 (b). Map of the difference in annual mean GPP between 2019 and 2018 (c) wherein red indicates higher GPP in 2019 and blue indicates higher GPP in 2018. The inset in the bottom left corner shows a time series of the average GPP across CONUS for 2018 and 2019. Source: Turner et al. (2021)
Citation
Turner, A.J., P. Koehler, T. Magney, C. Frankenberg, I. Fung, and R.C. Cohen. 2021. CMS: Daily Gross Primary Productivity over CONUS from TROPOMI SIF, 2018-2021. ORNL DAAC, Oak Ridge, Tennessee, USA. https://doi.org/10.3334/ORNLDAAC/1875
Table of Contents
- Dataset Overview
- Data Characteristics
- Application and Derivation
- Quality Assessment
- Data Acquisition, Materials, and Methods
- Data Access
- References
Dataset Overview
This dataset includes estimates of gross primary production (GPP) for the conterminous U.S., for 2018-02-15 to 2021-10-15, based on measurements of solar-induced chlorophyll fluorescence from the TROPOspheric Monitoring Instrument (TROPOMI) on the Sentinel-5P satellite platform. GPP was estimated from rates of photosynthesis inferred from SIF using a linear model and ecosystem scaling factors from 102 AmeriFlux sites. Knowledge of the spatiotemporal patterns of GPP is necessary for understanding regional and global carbon budgets. Broad-scale estimates of GPP have typically relied upon carbon cycle models linking spatial patterns of vegetation with remotely sensed environmental data. SIF provides a means to directly estimate photosynthetic activity, and therefore, GPP. Recent deployments of satellite platforms that measure SIF provide near-real-time measurements and represent a breakthrough in measuring GPP on a global scale. Regular SIF measurements can detect spatially explicit ecosystem-level responses to climate events such as drought and flooding. This dataset includes spatially explicit estimates of GPP (g m-2 d-1), uncertainty in GPP, and related TROPOMI SIF measurements (mW m-2 sr-1 nm-1) at 500-m resolution.
Project: Carbon Monitoring System
The NASA Carbon Monitoring System (CMS) program is designed to make significant contributions in characterizing, quantifying, understanding, and predicting the evolution of global carbon sources and sinks through improved monitoring of carbon stocks and fluxes. The System uses NASA satellite observations and modeling/analysis capabilities to establish the accuracy, quantitative uncertainties, and utility of products for supporting national and international policy, regulatory, and management activities. CMS data products are designed to inform near-term policy development and planning.
Related Publications
Turner, A. J., P. Köhler, T.S. Magney, C. Frankenberg, I. Fung, and R.C. Cohen. 2020. A double peak in the seasonality of California's photosynthesis as observed from space. Biogeosciences 17:405–422. https://doi.org/10.5194/bg-17-405-2020
Turner, A. J P. Köhler, T.S. Magney, C. Frankenberg, I. Fung, and R.C. Cohen. 2021. Extreme events driving year-to-year differences in gross primary productivity across the US. Biogeosciences 18:6579-6599. https://doi.org/10.5194/bg-18-6579-2021
Related Datasets
Feagin, R.A., I. Forbrich, T.P. Huff, J.G. Barr, J. Ruiz-plancarte, J.D Fuentes, R.G. Najjar, R. Vargas, A. Vazquez-lule, L. Windham-Myers, K. Kroeger, E.J. Ward, G.W. Moore, M. Leclerc, K.W. Krauss, C.L. Stagg, M. Alber, S.H. Knox, K.V.R. Schafer, T.S. Bianchi, J.A. Hutchings, H.B. Nahrawi, A. Noormets, B. Mitra, A. Jaimes, A.L. Hinson, B. Bergamaschi, J. King, and G. Miao. 2020. Gross Primary Production Maps of Tidal Wetlands across Conterminous USA, 2000-2019. ORNL DAAC, Oak Ridge, Tennessee, USA. https://doi.org/10.3334/ORNLDAAC/1792
Wang, C., K. Guan, B. Peng, C. Jiang, J. Peng, G. Wu, C. Frankenberg, P. Koehler, X. Yang, Y. Cai, and Y. Huang. 2021. High Resolution Land Cover-Specific Solar-Induced Fluorescence, Midwestern USA, 2018. ORNL DAAC, Oak Ridge, Tennessee, USA. https://doi.org/10.3334/ORNLDAAC/1813
Acknowledgments
This project received financial support from NASA’s Shared Services Center (grant 80NSSC19K0945), Carbon Cycle Science (grant NNX17AE14G), and Earth Science U.S. Participating Investigator (grant NNX15AH95G) programs. Additional support was provided by Basic Research in Science at UC Berkeley and the Koret Foundation.
Data Characteristics
Spatial Coverage: Conterminous United States
Spatial Resolution: 500 meters
Temporal Coverage: 2018-02-15 to 2021-10-15
Temporal Resolution: Daily
Study Area: All latitudes and longitudes given in decimal degrees.
| Site | Westernmost Longitude | Easternmost Longitude | Northernmost Latitude | Southernmost Latitude |
|---|---|---|---|---|
| Conterminous U.S. | -125.003 | -64.999 | 50.000 | 23.997 |
Data File Information
There are 1,339 data files in netCDF format (*.nc4) included in this dataset. The data files provide daily estimates of gross primary productivity (GPP) and conform to CF Conventions. Also included is one companion file in media (*.mp4) format, M01_CONUS.mp4, that provides an animation of seasonal change in GPP over 2018–2019.
The data files are named TROPOMI_YYYYMMDD.nc4, where YYYYMMDD is the sampling date.
Data File Details
The files use the geographic coordinate system (WGS 84). There are 5778 rows and 13,334 columns of 500-m grid cells covering the conterminous U.S.
Table 1. Variables names and descriptions.
| Variable | Units | Description |
|---|---|---|
| GPP | g m-2 d-1 | Gross primary production in grams carbon |
| SIF | mW m-2 sr-1 nm-1 | Solar-induced fluorescence |
| sigma | g m-2 d-1 | Uncertainty in GPP estimates in grams carbon |
Application and Derivation
Knowledge of the spatiotemporal patterns of gross primary production (GPP) is necessary for understanding regional and global carbon budgets. Broad-scale estimates of GPP have typically relied upon carbon cycle models linking spatial patterns of vegetation with remotely sensed environmental data. Solar-induced chlorophyll fluorescence (SIF) provides a means to directly estimate photosynthetic activity, and therefore, GPP. Recent deployments of satellite platforms that measure SIF provide near-real-time measurements and represent a breakthrough in measuring GPP on a global scale (e.g., Frankenberg et al., 2011; Magney et al., 2019). This dataset includes spatially explicit estimates of GPP based on SIF measurements from the TROPOspheric Monitoring Instrument (TROPOMI) on the Sentinel-5P Platform (Turner et al., 2020; 2021). Regular SIF measurements can detect spatially explicit ecosystem-level responses to climate events such as drought and flooding (Turner et al., 2021).
Quality Assessment
Estimates of gross primary production (GPP) were calibrated against field-based measurements of photosynthesis and carbon uptake from 82 AmeriFlux sites, a network of eddy flux towers across a range of vegetation types. GPP was best predicted from SIF using a linear model. While these data are daily, the best model used a 16-day moving window to estimate GPP from SIF. Across all ecosystems, the correlation between Ameriflux measures of GPP and TROPOMI SIF was 0.66. In some ecosystems (i.e., closed shrubland, open shrubland, and savanna ecosystems) the estimation power was limited due to the low signal-to-noise ratio between GPP and SIF (Turner et al., 2021).
Data Acquisition, Materials, and Methods
Daily values of gross primary production (GPP; gC m-2 d-1) were estimated for the conterminous US from measurements of solar-induced fluorescence (SIF) taken by the TROPOspheric Monitoring Instrument (TROPOMI) hosted on the Sentinel-SP satellite platform. The nominal resolution of TROPOMI is 3.5 km x 7 km, but there are multiple overflights per day. A given 500 m cell is sampled approximately 8 times over a 14-day period. Turner et al. (2020) demonstrate how this temporal oversampling can be used to downscale TROPOMI data from its native resolution to a finer 500 m scale.
The GPP-SIF relationship was determined by comparing daily field-based estimates of GPP obtained from 82 AmeriFlux sites, a network of eddy flux towers across 10 ecosystem types, with concurrent measures of SIF from TROPOMI. GPP was assumed to vary linearly with SIF:
GPP = SIF*γ*si*qi
where γ is unit conversion from μmol to grams carbon, s is the coefficient to convert SIF to GPP, and q is a factor to correct SIF for time-location specific variation in photosynthetically active radiation (PAR) due to changes in solar incidence angle and time of day (see Turner et al., 2021 for details). The subscript i denotes different parameter values for different vegetation types. The s and q parameters were estimated using linear regression with bisquare weighting of residuals. Overall, parameter values were similar for locations where the dominant vegetation type was wetlands, evergreen needleleaf forest, deciduous broadleaf forest, mixed forest, cropland, or woody savannah (mean s=16.4±0.4) (Turner et al., 2021).
Estimates of GPP are proportional to SIF and the regression coefficients. Uncertainty in GPP estimates (variable sigma; gC m-2 d-1) was estimated by ...
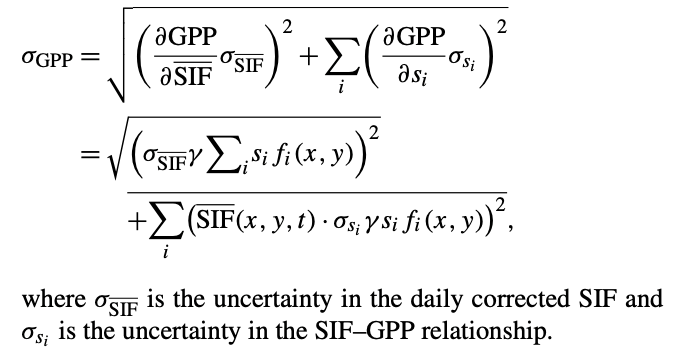
Details of methods are available in Turner et al. (2021).
Data Access
These data are available through the Oak Ridge National Laboratory (ORNL) Distributed Active Archive Center (DAAC).
CMS: Daily Gross Primary Productivity over CONUS from TROPOMI SIF, 2018-2021
Contact for Data Center Access Information:
- E-mail: uso@daac.ornl.gov
- Telephone: +1 (865) 241-3952
References
Frankenberg, C., J.B. Fisher, J. Worden, G. Badgley, S. S. Saatchi, J.-E. Lee, G.C. Toon, A. Butz, M. Jung, M., A. Kuze, and T. Yokota. 2011. New global observations of the terrestrial carbon cycle from GOSAT: Patterns of plant fluorescence with gross primary productivity. Geophysical Research Letters 38:L17706. https://doi.org/10.1029/2011gl048738
Magney, T. S., D.R. Bowling, B.A. Logan, K. Grossmann, J. Stutz, P.D. Blanken, S. P. Burns, R. Cheng, M.A. Garcia, P. Köhler, S. Lopez, N.C. Parazoo, B. Raczka, D. Schimel, and C. Frankenberg. 2019, Mechanistic evidence for tracking the seasonality of photosynthesis with solar-induced fluorescence. PNAS 116:11640–11645. https://doi.org/10.1073/pnas.1900278116
Turner, A. J., P. Köhler, T.S. Magney, C. Frankenberg, I. Fung, and R.C. Cohen. 2020. A double peak in the seasonality of California's photosynthesis as observed from space. Biogeosciences 17:405–422. https://doi.org/10.5194/bg-17-405-2020
Turner, A. J P. Köhler, T.S. Magney, C. Frankenberg, I. Fung, and R.C. Cohen. 2021. Extreme events driving year-to-year differences in gross primary productivity across the US. Biogeosciences 18:6579-6599. https://doi.org/10.5194/bg-18-6579-2021