Documentation Revision Date: 2019-09-10
Dataset Version: 1
Summary
Also provided are maps of the distributions of synthetic ecoregions (seven and 28 ecoregions) at 0.05 degree resolution that were derived using hierarchical K-means cluster partitioning of assembled and harmonized environmental data related to climate, topography, parent material, soil properties, ecosystem functional attributes, and ecosystem disturbances from across Mexico. Also included in this dataset are estimates of the spatial relationship (i.e., spatial representativeness) between actual and proposed environmental monitoring sites and ecosystem processes. A random forest model was used to estimate the suitability of proposed study sites and of the current distribution of MexFlux sites for adequately monitoring the dynamics of evapotranspiration (ET) and productivity (GPP) across Mexico. The proposed study sites were selected from the seven and 28 synthetic ecoregions.
There are 13 total data files in GeoTIFF (.tif) format: one file with the EFT for each pixel from 2001 to 2014 across Mexico, two files of the distribution of ecoregions, eight files for the representativeness of ET or GPP given the locations of proposed study sites, and two files for the representativeness of ET or GPP given the locations of current MexFlux sites.
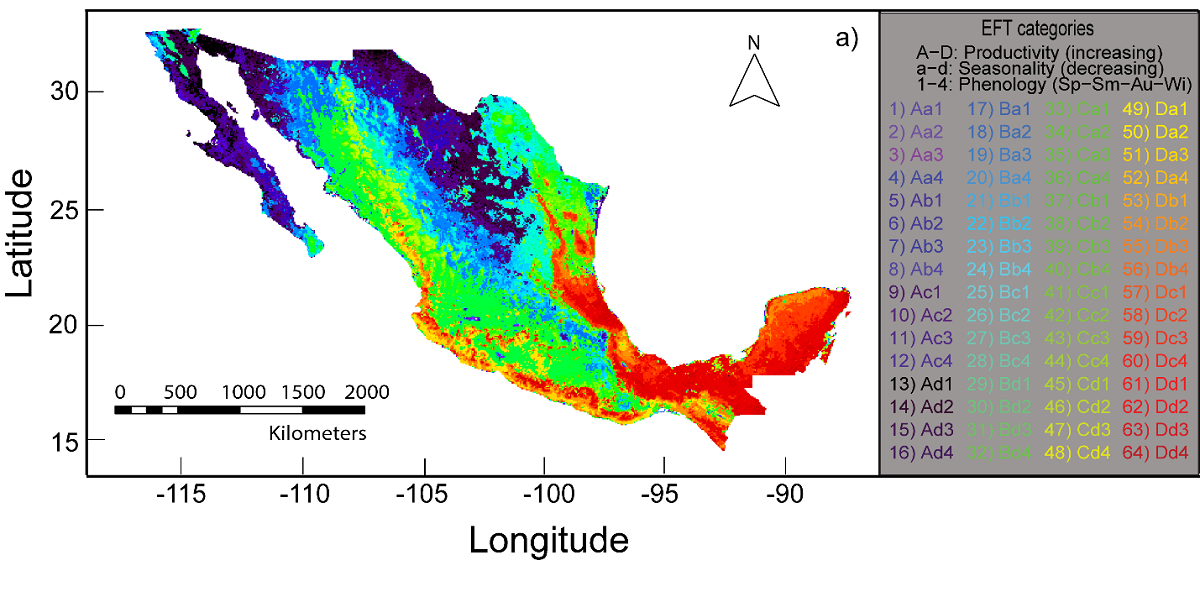
Figure 1. Spatial distribution of 64 ecosystem functional type (EFT) categories across Mexico. For each pixel, the dominant EFT is reported. The description of each EFT is described in Section 2. (Source file: EFT_diversity.tif)
Citation
Villarreal, S., D. Alcaraz-Segura, M. Guevara, and R. Vargas. 2019. Ecosystem Functional Type Distribution Map for Mexico, 2001-2014. ORNL DAAC, Oak Ridge, Tennessee, USA. https://doi.org/10.3334/ORNLDAAC/1693
Table of Contents
- Dataset Overview
- Data Characteristics
- Application and Derivation
- Quality Assessment
- Data Acquisition, Materials, and Methods
- Data Access
- References
Dataset Overview
This dataset provides a map of the distribution of ecosystem functional types (EFTs) at 0.05 degree resolution across Mexico for 2001 to 2014. EFTs are groupings of ecosystems based on their similar ecosystem functioning that are used to represent the spatial patterns and temporal variability of key ecosystem functional traits without prior knowledge of vegetation type or canopy architecture. Sixty-four EFTs were derived from the metrics of a 2001-2014 time-series of satellite images of the Enhanced Vegetation Index (EVI) from the Moderate Resolution Imaging Spectroradiometer (MODIS) product MOD13C2. EFT diversity was calculated as the modal (most repeated) EFT for each pixel.
Also provided are maps of the distributions of synthetic ecoregions (seven and 28 ecoregions) at 0.05 degree resolution that were derived using hierarchical K-means cluster partitioning of assembled and harmonized environmental data related to climate, topography, parent material, soil properties, ecosystem functional attributes, and ecosystem disturbances from across Mexico. Also included in this dataset are estimates of the spatial relationship (i.e., spatial representativeness) between actual and proposed environmental monitoring sites and ecosystem processes. A random forest model was used to estimate the suitability of proposed study sites and of the current distribution of MexFlux sites for adequately monitoring the dynamics of evapotranspiration (ET) and productivity (GPP) across Mexico. The proposed study sites were selected from the seven and 28 synthetic ecoregions.
Project: Carbon Monitoring System (CMS)
The NASA Carbon Monitoring System (CMS) is designed to make significant contributions in characterizing, quantifying, understanding, and predicting the evolution of global carbon sources and sinks through improved monitoring of carbon stocks and fluxes. The System will use the full range of NASA satellite observations and modeling/analysis capabilities to establish the accuracy, quantitative uncertainties, and utility of products for supporting national and international policy, regulatory, and management activities. CMS will maintain a global emphasis while providing finer scale regional information, utilizing space-based and surface-based data and will rapidly initiate generation and distribution of products both for user evaluation and to inform near-term policy development and planning.
Related Publication:
Villarreal, S., Guevara, M., Alcaraz-Segura, D. and Vargas, R., 2019. Optimizing an environmental observatory network design using publicly available data. Journal of Geophysical Research: Biogeosciences. https://doi.org/10.1029/2018JG004714
Related Dataset:
Villarreal, S., R. Vargas, and D. Alcaraz-Segura. 2019. Ecosystem Functional Type Distribution Map for the Conterminous USA, 2001-2014. ORNL DAAC, Oak Ridge, Tennessee, USA. https://doi.org/10.3334/ORNLDAAC/1659
Acknowledgments:
This work was funded by NASA CMS grant 80NSSC18K0173, NASA GEOBON grant 80NSSC18K0446, and ECOPOTENTIAL H2020 grant 641762.
Data Characteristics
Spatial Coverage: Mexico
Spatial Resolution: 0.05 degrees
Temporal Coverage: 2001 - 2014
Temporal Resolution: annual
Study Area: (all latitudes and longitudes given in decimal degrees)
| Site | Westernmost Longitude | Easternmost Longitude | Northernmost Latitude | Southernmost Latitude |
|---|---|---|---|---|
| Mexico | -118.4 | -86 | 33 | 14 |
Data File Information: There are 13 total data files in GeoTIFF (.tif) format:
| File Name | Description |
|---|---|
| EFT_diversity.tif | EFT diversity map, which corresponds to the mode of EFT categories for each pixel from 2001 to 2014 across Mexico |
| ecoregion_7clusters.tif | map of 7 ecoregions resulting from a K-means analysis |
| ecoregion_28clusters.tif | map of 28 ecoregions resulting from a K-means analysis |
| ET_representativeness_7sites.tif | evapotranspiration representativeness of 1 site selected for each of the 7 ecoregions |
| ET_representativeness_14sites.tif | evapotranspiration representativeness of 2 sites selected for each of the 7 ecoregions |
| ET_representativeness_28sites.tif | evapotranspiration representativeness of 1 site selected for each of the 28 ecoregions |
| ET_representativeness_84sites.tif | evapotranspiration representativeness of 3 sites selected for each of the 28 ecoregions |
| ET_representativeness_MexFlux.tif | evapotranspiration representativeness of sites affiliated with the MexFlux network |
| GPP_representativeness_7sites.tif | gross primary productivity representativeness of 1 site selected for each of the 7 ecoregions |
| GPP_representativeness_14sites.tif | gross primary productivity representativeness of 2 sites selected for each of the 7 ecoregions |
| GPP_representativeness_28sites.tif | gross primary productivity representativeness of 1 site selected for each of the 28 ecoregions |
| GPP_representativeness_84sites.tif | gross primary productivity representativeness of 3 sites selected for each of the 28 ecoregions |
| GPP_representativeness_MexFlux.tif | gross primary productivity representativeness of sites affiliated with the MexFlux network |
Data File Details
For all GeoTIFF files, the data are categorical, the projection is EPSG 4326, and there is one band.
No data values
No data is represented by 0 for the files EFT_diversity.tif, ecoregion_7clusters.tif, and ecoregion_28clusters.tif.
No data is represented by 255 in all other files.
| File Name | Value Range | Details |
|---|---|---|
| EFT_diversity.tif | 1-64 | category of EFT at a pixel (categories defined below) |
| ecoregion_7clusters.tif | 1-7 | category of 7 general ecoregions (no category definitions) |
| ecoregion_28clusters.tif | 1-28 | category of 28 sub-ecoregions, derived from the 7 ecoregions of ecoregion_7clusters.tif (no category definitions) |
| XXX_representativeness_#sites.tif | 0-1 | if ET of GPP is likely represented by the given number of sites, the pixel value will be 1 |
| XXX_representativeness_MexFlux.tif | 0-1 | if ET of GPP is likely represented by the MexFlux network, the pixel value will be 1 |
EFT Category Definitions
The file EFT_diversity.tif has 64 categories of EFTs. The EFTs are described as follows:
A-D: primary productivity (ascending order)
a-d: seasonality (descending order)
1-4: phenology (spring, summer, autumn, winter)
- Capital letters correspond to the Enhanced Vegetation Index (EVI) annual mean level, ranging from A to D for low to high productivity.
- Lowercase letters show the seasonal coefficient of variation, ranging from a to d for high to low seasonality for carbon uptake.
- Numbers indicate the season of maximum EVI: (1) spring, (2) summer, (3) autumn, (4) winter.
| EFT category in EFT_diversity.tif | EFT description |
|---|---|
| 1 | Aa1 |
| 2 | Aa2 |
| 3 | Aa3 |
| 4 | Aa4 |
| 5 | Ab1 |
| 6 | Ab2 |
| 7 | Ab3 |
| 8 | Ab4 |
| 9 | Ac1 |
| 10 | Ac2 |
| 11 | Ac3 |
| 12 | Ac4 |
| 13 | Ad1 |
| 14 | Ad2 |
| 15 | Ad3 |
| 16 | Ad4 |
| 17 | Ba1 |
| 18 | Ba2 |
| 19 | Ba3 |
| 20 | Ba4 |
| 21 | Bb1 |
| 22 | Bb2 |
| 23 | Bb3 |
| 24 | Bb4 |
| 25 | Bc1 |
| 26 | Bc2 |
| 27 | Bc3 |
| 28 | Bc4 |
| 29 | Bd1 |
| 30 | Bd2 |
| 31 | Bd3 |
| 32 | Bd4 |
| 33 | Ca1 |
| 34 | Ca2 |
| 35 | Ca3 |
| 36 | Ca4 |
| 37 | Cb1 |
| 38 | Cb2 |
| 39 | Cb3 |
| 40 | Cb4 |
| 41 | Cc1 |
| 42 | Cc2 |
| 43 | Cc3 |
| 44 | Cc4 |
| 45 | Cd1 |
| 46 | Cd2 |
| 47 | Cd3 |
| 48 | Cd4 |
| 49 | Da1 |
| 50 | Da2 |
| 51 | Da3 |
| 52 | Da4 |
| 53 | Db1 |
| 54 | Db2 |
| 55 | Db3 |
| 56 | Db4 |
| 57 | Dc1 |
| 58 | Dc2 |
| 59 | Dc3 |
| 60 | Dc4 |
| 61 | Dd1 |
| 62 | Dd2 |
| 63 | Dd3 |
| 64 | Dd4 |
Application and Derivation
Environmental observatory networks (EONs), like AmeriFLUX and NEON, are organizations that observe environmental factors across multiple study sites. The effectiveness of EON observations to represent the spatial heterogeneity of environmental factors across study sites must be assessed to inform network design. There is a need to optimize resources for large-scale environmental monitoring efforts, especially in developing countries.
These data can be used to identify potential sampling locations or study sites that could maximize the representativeness of an EON to capture targeted ecosystem processes (i.e., carbon and water fluxes) at the national-level.
Quality Assessment
Data quality was not specifically assessed.
Data Acquisition, Materials, and Methods
Ecosystem Functional Types
Ecosystem functional types (EFTs) are groupings of ecosystems based on their similar ecosystem functioning that are used to represent the spatial patterns and temporal variability of key ecosystem functional traits (e.g., primary productivity, seasonality, phenology of carbon gains). In practice, EFTs are a yearly varying land surface classification based on satellite-derived key ecosystem functional attributes. EFTs were derived from 2001 - 2014 time-series of satellite images of the Enhanced Vegetation Index (EVI, a surrogate of carbon gain dynamics) from NASA's Moderate Resolution Imaging Spectroradiometer (MODIS) product MOD13C2 with a spatial resolution of 0.05°×0.05° across Mexico. Specifically, EFTs were derived from three metrics of the EVI seasonal curve related to the dynamics of terrestrial carbon gains: (1) annual mean as an estimate of primary production; (2) EVI seasonal coefficient of variation as a descriptor of seasonality; and (3) the month of the annual maximum EVI value as an indicator of phenology. The range of values of each EVI metric was divided into four intervals, giving a potential number of 64 EFT categories, and each category is a summary of the information contained in the three EVI metrics for each 0.05°×0.05° grid pixel. Ecosystem functional type diversity (EFTmode) was calculated as the modal (most repeated) EFT within each pixel throughout the 14-year period.
Ecoregions
To identify ecoregions (i.e., Ecologically Similar Areas) from which to select potential study sites, hierarchical K-means cluster partitioning of assembled and harmonized environmental data related to climate, topography, parent material, soil properties, ecosystem functional attributes, and ecosystem disturbances from across Mexico was used to identify seven ecoregion clusters and 28 ecoregion clusters. The conditioned Latin Hypercube sampling technique was used to choose locations of potential flux sites given the following: a) one site for each of seven ecoregions; b) one site for each of 28 ecoregions; c) two sites for each of 7 ecoregions; and d) three sites for each of 28 ecoregions.
Representativeness
To assess the spatial functional heterogeneity (i.e., spatial representativeness) of proposed study sites and of the current distribution of MexFlux sites for adequately monitoring the dynamics of evapotranspiration (ET) and productivity (GPP) across Mexico, a random forest model was used. In particular, ET and GPP were represented by their annual mean (ET_mean, GPP_mean) and annual coefficient of variation (ET_cv, GPP_cv), as these metrics are known to capture most of the variability of the seasonal dynamics in a time-series of vegetation indexes derived from satellite information.
See the related publication Villarreal et al. (2019) for more information.
Data Access
These data are available through the Oak Ridge National Laboratory (ORNL) Distributed Active Archive Center (DAAC).
Ecosystem Functional Type Distribution Map for Mexico, 2001-2014
Contact for Data Center Access Information:
- E-mail: uso@daac.ornl.gov
- Telephone: +1 (865) 241-3952
References
Villarreal, S., Guevara, M., Alcaraz-Segura, D. and Vargas, R., 2019. Optimizing an environmental observatory network design using publicly available data. Journal of Geophysical Research: Biogeosciences. https://doi.org/10.1029/2018JG004714