Documentation Revision Date: 2020-02-06
Dataset Version: 1
Summary
There are 12 total data files, with two data files for each of 6 focal sites, in netCDF (*.nc) format.
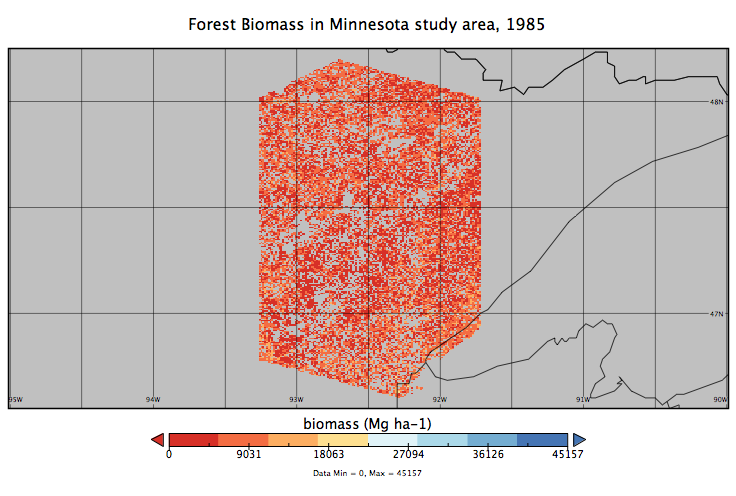
Figure 1. Biomass (Mg ha-1) for the northern Minnesota site. Source: biomass_MN.nc
Citation
Cohen, W.B., Z. Yang, S.P. Healey, and H.E. Andersen. 2019. Disturbance History and Forest Biomass from Landsat for Six US Sites, 1985-2014. ORNL DAAC, Oak Ridge, Tennessee, USA. https://doi.org/10.3334/ORNLDAAC/1679
Table of Contents
- Dataset Overview
- Data Characteristics
- Application and Derivation
- Quality Assessment
- Data Acquisition, Materials, and Methods
- Data Access
- References
Dataset Overview
This dataset provides derived disturbance history and predicted annual forest biomass maps at 30-m resolution for six selected Landsat scenes across the Conterminous United States (CONUS) for the period 1985-2014. The Landsat focus sites are in the following states: Colorado, Maine, Minnesota, Oregon, Pennsylvania, and South Carolina. These scenes were selected to represent a wide range of forest ecosystems, which ensured that a diversity of forest type groups and forest change processes (e.g., harvest, fire, insects, and urbanization) were included. Disturbance history was derived from a Landsat time-series for each site. Each disturbance is represented by year of detection, duration, and magnitude. The cause of the disturbance was not identified. Forest biomass was measured at field plots within each of the six sites and combined with airborne LiDAR data from each site to create land validation maps. Site biomass at 30-m resolution was estimated by developing Random Forest models that include site disturbance history with the land validation maps.
Project: Carbon Monitoring System (CMS)
The NASA Carbon Monitoring System (CMS) is designed to make significant contributions in characterizing, quantifying, understanding, and predicting the evolution of global carbon sources and sinks through improved monitoring of carbon stocks and fluxes. The System will use the full range of NASA satellite observations and modeling/analysis capabilities to establish the accuracy, quantitative uncertainties, and utility of products for supporting national and international policy, regulatory, and management activities. CMS will maintain a global emphasis while providing finer scale regional information, utilizing space-based and surface-based data and will rapidly initiate generation and distribution of products both for user evaluation and to inform near-term policy development and planning.
Acknowledgments
This work was funded by NASA CMS grant NNH13AW621.
Data Characteristics
Spatial Coverage: Six sites in the United States: Colorado, Maine, Minnesota, Oregon, Pennsylvania, South Carolina
Spatial Resolution: 30 m
Temporal Coverage: 1985-01-01 to 2014-12-31
Temporal Resolution: annual
Study Area: (all latitudes and longitudes given in decimal degrees)
| Site | Westernmost Longitude | Easternmost Longitude | Northernmost Latitude | Southernmost Latitude |
|---|---|---|---|---|
| Full extent | -123.2346889 | -68.48086389 | 48.28861389 | 32.26540833 |
| Colorado (CO) | -108.4012306 | -106.344375 | 41.28273056 | 39.38385 |
| Maine (ME) | -71.200375 | -68.48086388 | 47.077675 | 44.94391944 |
| Minnesota (MN) | -93.33940833 | -91.622066 | 48.28861389 | 46.60993611 |
| Oregon (OR) | -123.234688 | -120.5346166 | 44.28075278 | 42.08694444 |
| Pennsylvania (PA) | -76.1217722 | -73.6485 | 41.39416944 | 39.27103889 |
| South Carolina (SC) | -81.1655722 | -79.01473611 | 34.21445 | 32.26540833 |
Data File Information
There are 12 total data files, with two data files for each of 6 focal sites, in netCDF (*.nc) format with the file names as follows:
six files of "disturbance_XX.nc" -- provide disturbance history in each site
six files of "biomass_XX.nc" -- provide a 30 year time series of aboveground biomass in each site
Where XX is the state abbreviation (CO, ME, MN, OR, PA, SC)
Data File Details
For all netCDF files, coordinates are provided for Geographic (EPSG: 4326) and Albers Conical Equal Area projections and the no data value is -9999.
Table 1. Variable description for disturbance_XX.nc. Note there may be up to 6 disturbance events per pixel.
| variable | units | description |
|---|---|---|
| duration | years | number of years disturbance lasted |
| endYear | YYYY | year disturbance ended |
| postBrightness | mixed decimal | brightness after disturbance ended; the magnitude of change from disturbance startYear to endYear* |
| postGreenness | mixed decimal | greenness after disturbance ended; the magnitude of change from disturbance startYear to endYear |
| postWetness | mixed decimal | wetness after disturbance ended; the magnitude of change from disturbance startYear to endYear |
| preBrightness | mixed decimal | brightness before disturbance occurred; the magnitude of change from disturbance startYear to endYear |
| preGreenness | mixed decimal | greenness before disturbance occurred; the magnitude of change from disturbance startYear to endYear |
| preWetness | mixed decimal | wetness before disturbance occurred; the magnitude of change from disturbance startYear to endYear |
| startYear | YYYY | year disturbance began |
*Synthetic tasseled cap images were used to derive the disturbance magnitude: the delta change of tasseled cap brightness (TCB), greenness (TCG), and wetness (TCW) between the pre-disturbance and post-disturbance images. Disturbance history for a pixel was represented by up to six disturbances (i.e., events).
Table 2. Variable descriptions for biomass_XX.nc.
| variable | units | description |
|---|---|---|
| biomass | Mg ha-1 | aboveground forest biomass estimates |
| biomass_SD | Mg ha-1 | standard deviation of aboveground forest biomass estimates |
Application and Derivation
Much of what we know about forest disturbance comes from disparate monitoring efforts that produce estimates that are challenging to compare and synthesize across disturbance agent classes, regions, and time periods. This research uses Landsat satellite remote sensing to estimate the effects of forest disturbance. Landsat imagery is capable of quantifying diverse patterns and dynamics
of forests at sub-stand scales and at sub-annual temporal resolution over the last several decades.
Quality Assessment
Uncertainty was represented as Random Forest prediction probability.
Data Acquisition, Materials, and Methods
Study Sites
The Landsat focus sites are in the following states: Colorado, Maine, Minnesota, Oregon, Pennsylvania, and South Carolina. These scenes were selected to represent a wide range of forest ecosystems, which ensured that a diversity of forest type groups and forest change processes (e.g., harvest, fire, insects, and urbanization) were included.
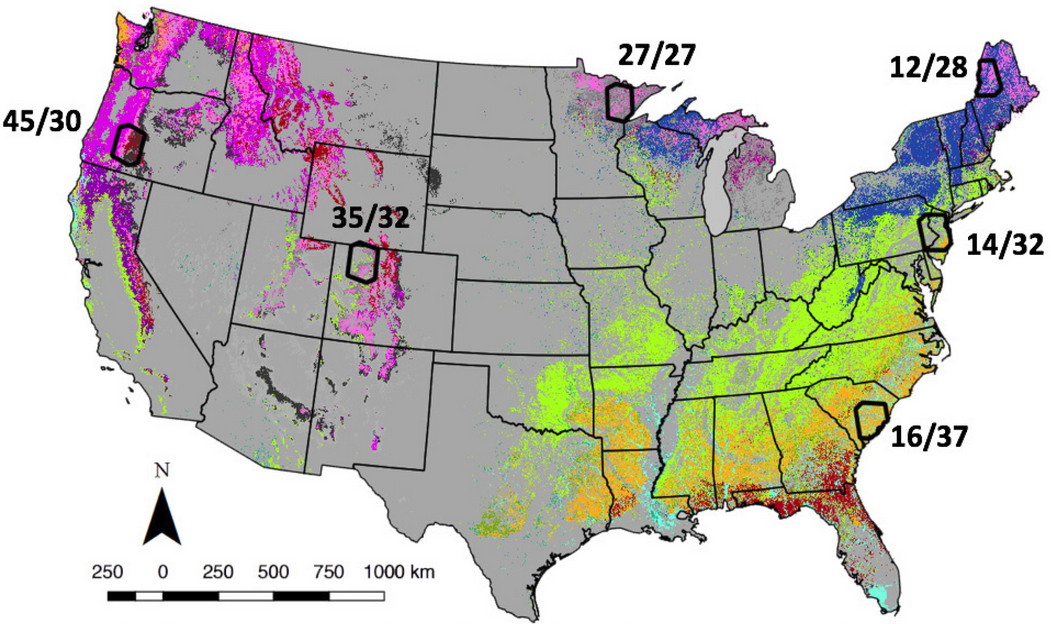
Figure 2. These areas were defined as the non-overlapping portions of six individual, Landsat frames, known as TSAs (Thiessen Scene Areas, from the second World Reference System (WRS-2) grid. The six scenes (given by numeric WRS-2 Path/Row) included: 12/28 in northern Maine; 14/32 in eastern Pennsylvania and New Jersey; 16/37 in coastal South Carolina; 27/27 in northern Minnesota; 35/32 in northwestern Colorado; and 45/30 in western Oregon (Cohen et al., 2017)
Disturbance History
Disturbance history was derived from a Landsat time-series for 1973-2015 using the method described in Cohen et al. (2018). In brief, the LandTrendr algorithm was applied separately to the six Landsat reflectance bands and seven Landsat spectral indices, then the results were combined using a Random Forest (RF) ensemble. The training data used for the RF model were collected using the TimeSync visualization and data collection tool (Cohen et al. 2010). The RF model was applied independently to each year of the Landsat time-series to detect forest disturbance. For each year of the Landsat time-series, a method composite (Flood 2013) and the 2011 National Land Cover Database (NLCD) forest cover data (USGS 2011) were used to mask non-forest areas. Any disturbance event that had an extent less than 0.5 ha in a given year was disregarded. However, to allow for detection of chronic declines in forest health, smaller patches were permitted if neighboring pixels were detected as disturbed in adjacent years and the final patch size was at least 0.5 ha. A synthetic tasseled cap image was generated using the disturbance start and end year as the vertices, then the synthetic tasseled cap images were used to derive the disturbance magnitude: the delta change of tasseled cap brightness, greenness, and wetness between the pre-disturbance and post-disturbance images. Disturbance history for a pixel was represented by up to six disturbances (i.e., events).
Biomass Estimates
Forest biomass was collected at field plots within each of the six sites and then combined with LiDAR data (Legner et. al., 2020) to create land validation maps. RF models for biomass were developed for the years 1985-2014 using the validation maps, the year since the disturbance, the tasseled cap image for the year being modeled and for the year 1984, and the NLCD forest cover data. Relative to the year being modeled, only the two most recent disturbances were included in model development. To build the RF biomass model, stratified random samples were selected from the validation maps. For each site, 10 data bins for biomass were calculated using the 5th and 95th percentile. In addition, the number of detected disturbances were combined with the biomass bins to create additional strata. Within each stratum, 500 random pixels were selected as training data. The derived RF model of biomass for each site was then applied to all years from 1985 to 2014.
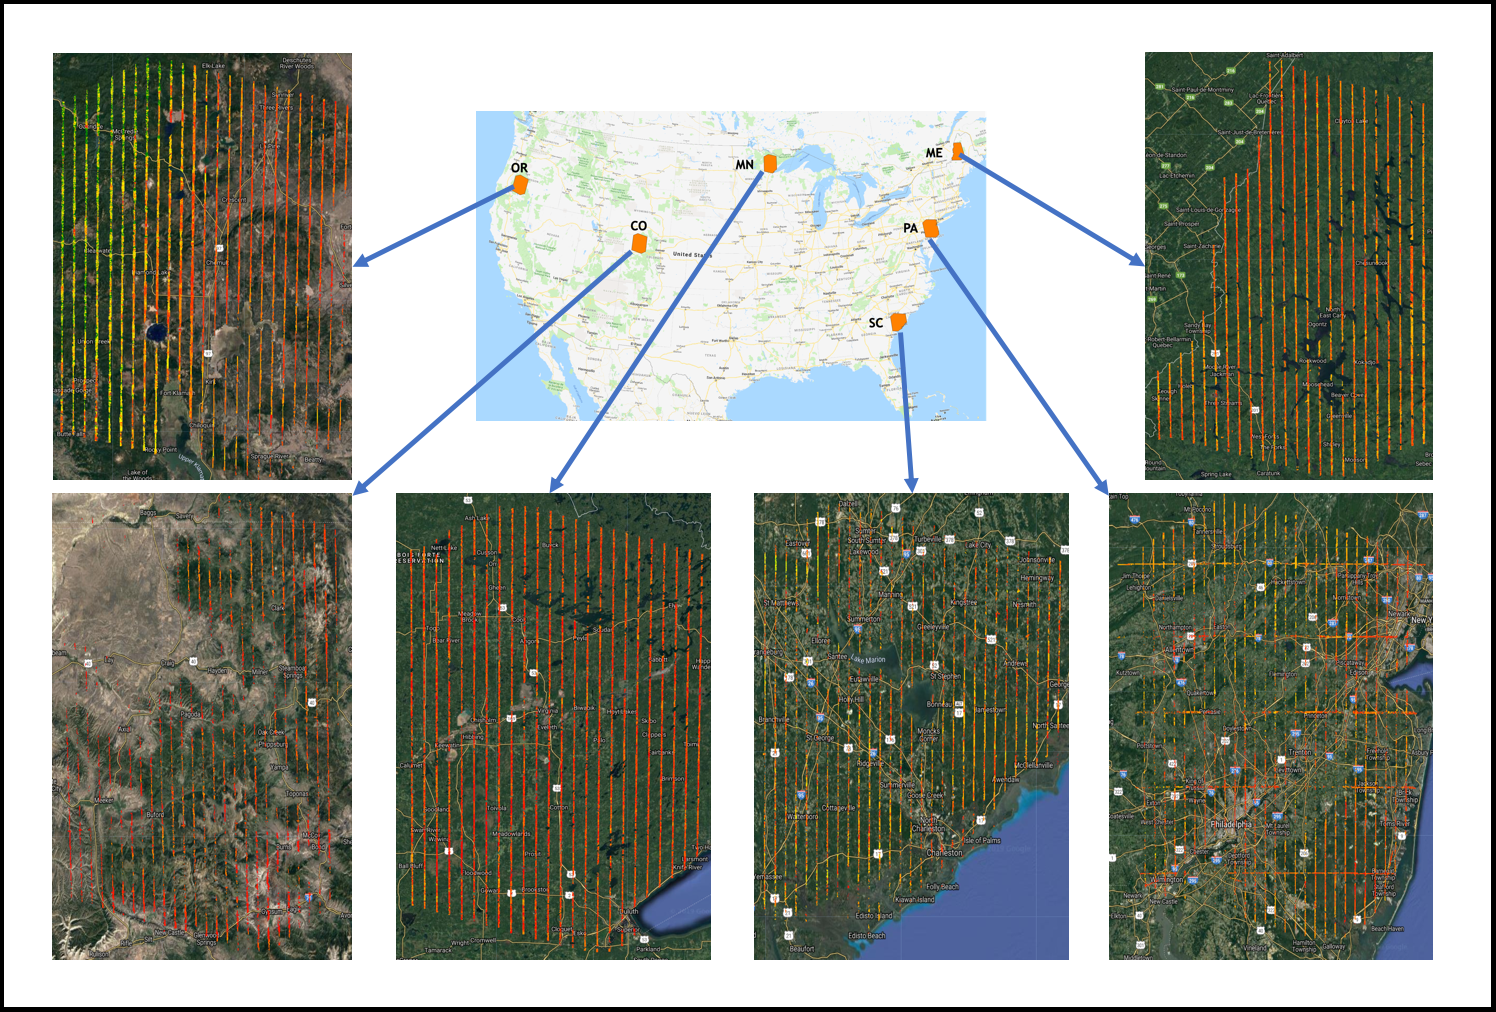
Figure 3. Example of LiDAR data retrieved for field plots at each site.
Data Access
These data are available through the Oak Ridge National Laboratory (ORNL) Distributed Active Archive Center (DAAC).
Disturbance History and Forest Biomass from Landsat for Six US Sites, 1985-2014
Contact for Data Center Access Information:
- E-mail: uso@daac.ornl.gov
- Telephone: +1 (865) 241-3952
References
Cohen, W.B., Z. Yang, and R.E. Kennedy. 2010. Detecting trends in forest disturbance and recovery using yearly Landsat time series: 1. LandTrendr — Temporal segmentation algorithms. Remote Sensing of Environment 114:2911-2924. https://doi.org/10.1016/j.rse.2010.07.008
Cohen, W.B., Z. Yang, S.V. Stehman, T.A. Schroeder, D.M. Bell, J.G. Masek, C. Huang, and G.W. Meigs. 2016.Forest disturbance across the conterminous United States from 1985–2012: The emerging dominance of forest decline. Forest Ecology and Management 360:242-252. https://doi.org/10.1016/j.foreco.2015.10.042
Cohen, W.B., Healey, S.P., Yang, Z., Stehman, S.V., Brewer, C.K., Brooks, E.B., Gorelick, N., Huang, C., Hughes, M.J., Kennedy, R.E., Loveland, T.R., Moisen, G.G., Schroeder, T.A., Vogelmann, J.E., Woodcock, C.E., Yang, L., Zhu, Z., 2017. How similar are forest disturbance maps derived from different Landsat time series algorithms? Forests 8, 98. http://dx.doi.org/10.3390/f8040098.
Cohen, W.B., Z. Yang, S.P. Healey, R.E. Kennedy, and N. Gorelick. 2018. A LandTrendr multispectral ensemble for forest disturbance detection. Remote Sensing of Environment 205:131-140. https://doi.org/10.1016/j.rse.2017.11.015
Flood, Neil. 2013. Seasonal Composite Landsat TM/ETM+ Images Using the Medoid (a Multi-Dimensional Median). Remote Sensing 5(12): 6481-6500. ttps://doi.org/10.3390/rs5126481
Legner, Kate; Andersen, Hans-Erik; Cooke, Andrew; Cohen, Warren. 2020. A cost-effective field measurement protocol to support lidar-assisted carbon monitoring programs—implementing a prototype design at six different sites in the United States. Gen. Tech. Rep. PNW-GTR-984. Portland, OR: U.S. Department of Agriculture, Forest Service, Pacific Northwest Research Station. 66 p.
US Geological Survey. 2011. National Land Cover Database 2011. Available at: https://www.mrlc.gov/data/nlcd-2011-land-cover-conus-0