Documentation Revision Date: 2023-03-17
Dataset Version: 1
Summary
There is one data file in comma-separated values format (.csv) with this dataset.
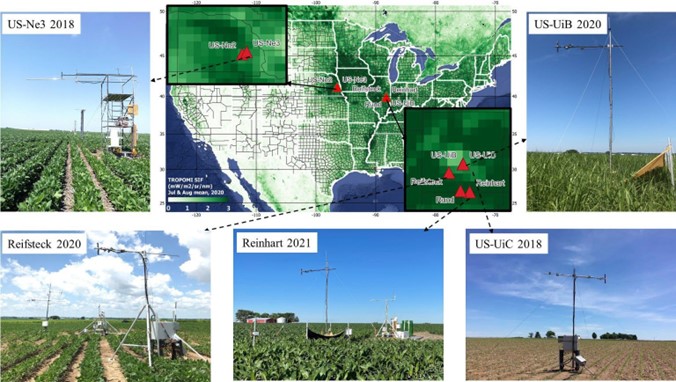
Figure 1. Field sites for ground measurements of solar-induced fluorescence with examples of FluoSpec2 systems.
Citation
Wu, G., K. Guan, H. Kimm, G. Miao, and C. Jiang. 2023. SIF and Vegetation Indices in the US Midwestern Agroecosystems, 2016-2021. ORNL DAAC, Oak Ridge, Tennessee, USA. https://doi.org/10.3334/ORNLDAAC/2136
Table of Contents
- Dataset Overview
- Data Characteristics
- Application and Derivation
- Quality Assessment
- Data Acquisition, Materials, and Methods
- Data Access
- References
Dataset Overview
This dataset contains half-hourly ground solar-induced chlorophyll fluorescence (SIF) and vegetation indices including NDVI, EVI, Red edge chlorophyll index, green chlorophyll index, and photochemical reflectance index at seven crop sites in Nebraska and Illinois for the period 2016-2021. Four sites were located at Eddy Covariance (EC) tower sites (sites US-Ne2, US-Ne3, US-UiB, and US-UiC), and three sites were located on private farms (sites Reifsteck, Rund, and Reinhart). The sites were either miscanthus, corn-soybean rotation or corn-corn-soybean rotation. The spectral data for SIF retrieval and hyperspectral reflectance for vegetation index calculation were collected by the FluoSpec2 system, installed near planting, and uninstalled after harvest to collect whole growing-season data. Raw nadir SIF at 760 nm from different algorithms (sFLD, 3FLD, iFLD, SFM) are included. SFM_nonlinear and SFM_linear represent the Spectral fitting method (SFM) with the assumption that fluorescence and reflectance change with wavelength non-linearly and linearly, respectively. Additional data include two SIF correction factors including calibration coefficient adjustment factor (f_cal_corr_QEPRO) and upscaling nadir SIF to eddy covariance footprint factor (ratio_EC footprint, SIF pixel), and measured FPAR from quantum sensors and Rededge NDVI calculated FPAR.
Project: Carbon Monitoring System
The NASA Carbon Monitoring System (CMS) program is designed to make significant contributions in characterizing, quantifying, understanding, and predicting the evolution of global carbon sources and sinks through improved monitoring of carbon stocks and fluxes. The System uses NASA satellite observations and modeling/analysis capabilities to establish the accuracy, quantitative uncertainties, and utility of products for supporting national and international policy, regulatory, and management activities. CMS data products are designed to inform near-term policy development and planning.
Related Publication
Wu, G., K. Guan, H. Kimm, G. Miao, X. Yang, and C. Jiang. 2022. Ground solar-induced chlorophyll fluorescence and vegetation indices in the U.S. Midwestern Agroecosystems. In Process.
Acknowledgements
This work was supported by the NASA New Investigator Award and NASA Carbon Monitoring System program managed by the NASA Terrestrial Ecology Program, the NASA Future Investigators in NASA Earth and Space Science and Technology (FINESST) Program. In addition, the investigators acknowledge the support from the DOE Center for Advanced Bioenergy and Bioproducts Innovation (U.S. Department of Energy, Office of Science, Office of Biological and Environmental Research under Award Number DE-SC0018420), and from the Advanced Research Projects Agency–Energy (ARPA-E), US Department of Energy, under award number DE-AR0001382. We thank Dr. Andy Suyker for the Nebraska field sites management and support, and Dr. Carl Bernacchi for the Illinois field sites support. We thank M. Pilar Cendrero-Mateo for sharing code for SIF retrieval using 3FLD, iFLD and SFM-nonlinear.
Data Characteristics
Spatial Coverage: Illinois and Nebraska, US
Spatial Resolution: Point
Temporal Coverage: 2016-08-07 to 2021-09-18
Temporal Resolution: Half-hourly
Study Area: Latitude and longitude are given in decimal degrees
| Site | Westernmost Longitude | Easternmost Longitude | Northernmost Latitude | Southernmost Latitude |
|---|---|---|---|---|
| Sites in Illinois and Nebraska, US | -96.4701 | - 88.1546 | 41.1797 | 39.8824 |
Data File Details
There is one data file in comma-separated values format (.csv) with this dataset: SIF_VegIndices_Illinois_Nebraska_Halfhour.csv
Table 1. Variables in the data file.
| Variable Name | Units | Description |
|---|---|---|
| site | Study sites: Two sites were located in Lincoln, Nebraska (US-Ne2 and US-Ne3), and five sites were in Champaign, Illinois (US-UiB, US-UiC, Reifsteck, Rund, and Reinhart) | |
| year | YYYY | Study site growing season year |
| species | Species: corn, soybean or miscanthus | |
| latitude | decimal degrees | Site latitude |
| longitude | decimal degrees | Site longitude |
| timestamp_start | YYYY-MM-DD hh:mm:ss | Starting date and time of data collection in local time (North America, Central Time zone) |
| timestamp_end | YYYY-MM-DD hh:mm:ss | Ending date and time of data collection in local time (North America, Central Time zone) |
| doy | Day of year | |
| SIF_sFLD_raw | mw m-2 nm-1 sr-1 | Standard Fraunhofer line depth (FLD) retrieved SIF at 760 (SIF760) |
| SIF_sFLD_raw_stderror | mw m-2 nm-1 sr-1 | The standard error of SIF_sFLD_raw |
| SIF_3FLD_raw | mw m-2 nm-1 sr-1 | Three-band FLD (3FLD) retrieved SIF at 760 (SIF760) |
| SIF_3FLD_raw_stderror | mw m-2 nm-1 sr-1 | The standard error of SIF_3FLD_raw |
| SIF_iFLD_raw | mw m-2 nm-1 sr-1 | Improved FLD (iFLD) retrieved SIF at 760 (SIF760) |
| SIF_iFLD_raw_stderror | mw m-2 nm-1 sr-1 | The standard error of SIF_iFLD_raw |
| SIF_SFM_nonlinear_raw | mw m-2 nm-1 sr-1 | Spectral fitting method (SFM) with the assumption that fluorescence and reflectance non-linearly change with wavelength over the absorption window retrieved SIF at 760 (SIF760) |
| SIF_SFM_nonlinear_raw_stderror | mw m-2 nm-1 sr-1 | The standard error of SIF_SFM_nonlinear_raw |
| SFM_linear_raw | mw m-2 nm-1 sr-1 | Spectral fitting method (SFM) with the assumption that fluorescence and reflectance linearly change with wavelength SIF over the absorption window retrieved SIF at 760 (SIF760) |
| SFM_linear_raw_stderror | mw m-2 nm-1 sr-1 | The standard error of SFM_linear_raw |
| f_cal_corr_QEPRO | 1 | The calibration coefficient adjustment factor accounting for the degradation of calibrating light source for irradiance calibration |
| ratio_ECfootprint_SIFpixel | 1 | The ratio of eddy covariance (EC) footprint weighted soil-adjusted near-infrared reflectance of vegetation (sanirv) to SIF tower pixel sanirv from planetscope data. Multiplying this ratio to observed SIF upscales nadir SIF to EC footprint |
| PAR | umol m-2 s-1 | Measured photosynthetic active radiation (PAR) from quantum sensor |
| FPAR_VI | 1 | Fraction of absorbed PAR of the canopy calculated from Rededge Normalized Difference Vegetation Index (NDVI) for corn and soybean with the equation FPAR_VI=1.37×Rededge NDVI-0.17 |
| APAR_VI | umol m-2 s-1 | Absorbed PAR of the canopy as the product of FPAR_VI and PAR |
| FPAR_measured | umol m-2 s-1 | Measured FPAR from point and line quantum sensors |
| APAR_measured | umol m-2 s-1 | Absorbed PAR of the canopy as the product of FPAR_Meas and PAR |
| NDVI | 1 | Normalized difference vegetation index, NDVI=(r_(770-780)-r_(650-660))/(r_(770-780)+r_(650-660)) |
| EVI | 1 | Enhanced vegetation index, EVI=2.5×(r_(770-780)-r_(650-660))/(r_(770-780)+6×r_(650-660)-7.5×r_(460-470)+1) |
| NIRv | 1 | Near-infrared reflectance of vegetation, NIRv=R_(770-780)×NDVI |
| CI_red_edge | 1 | Red edge chlorophyll index, CI_rededge=R_(770-780)/R_(720-730) -1 |
| CI_green | 1 | Green chlorophyll index, CI_green=R_(770-780)/R_(545-565) -1 |
| PRI | 1 | Photochemical reflectance index, PRI=(R_531-R_570)/(R_531+R_570) |
| enclosure_temp | degrees C | The temperature of the enclosure where the spectral system is located |
Application and Derivation
These long-term ground SIF and vegetation indices are important for satellite SIF validation, mechanistic interpretations of canopy SIF signals and understanding of the relationship between SIF and photosynthesis when combined with leaf- and canopy-level auxiliary measurements.
Quality Assessment
Estimate of Uncertainty: The uncertainty of half-hourly canopy SIF760 is estimated as the standard error of 5-min SIF760 within the half hour.
Data Acquisition, Materials, and Methods
Study sites
The FluoSpec2 system was installed at seven sites (refer to Figure 1) in the US Corn Belt near planting and uninstalled after harvest to collect whole growing-season data. Two of the sites are in Lincoln, Nebraska (US-Ne2 and US-Ne3), and the other five sites are in Champaign, Illinois (US-UiB, US-UiC, Reifsteck, Rund, and Reinhart). For examples of the field set-up, refer to Figure 2. Except for US-UiB where miscanthus emerged each year after the establishment in 2010, other sites were either corn-soybean rotation or corn-corn-soybean rotation. US-Ne2 was an irrigated site while other sites were rain-fed. Fertilizers were applied for corn and miscanthus at all the sites. US-Ne2, US-Ne3, US-UiB, and US-UiC are registered on the AmeriFlux site (https://ameriflux.lbl.gov/), where eddy covariance and meteorological data can be freely downloaded. Reifsteck, Rund, and Reinhart sites are on private farms.
Table 2. Information of the seven field sites deployed with Fluospec2 systems.
| Site | Crop type | Management |
|---|---|---|
| US-Ne2 | Corn-soy rotation | Irrigated, no-till, fertilizer applied for corn |
| US-Ne3 | Corn-soy rotation | Rainfed, no-till, fertilizer applied for corn |
| US-UiB | Miscanthus | Rainfed, N/A, fertilizer applied |
| US-UiC | Corn-corn-soy rotation | Rainfed, conventional-till, fertilizer applied for corn |
| Reifsteck | Corn-soy rotation | Rainfed, no-till, fertilizer applied for corn |
| Rund | Corn-soy rotation | Rainfed, minimum-till, fertilizer applied for corn |
| Reinhart | Corn-corn-soy rotation | Rainfed, conventional-till, fertilizer applied for corn |
Spectral system description
FluoSpec2 is a directional-hemispherical system designed by Yang et al. (2018) and was used for spectral data collection (Figure 2). It consists of two paths, with each path equipped with one spectrometer, one splitting fiber, one inline shutter, and two fibers for downwelling irradiance and upwelling radiance collection, respectively. The data collected by the two paths were used for SIF retrieval and vegetation indices estimation, respectively. For SIF data collection, the spectrometer, QEPRO, covered wavelengths from 730 –780 nm with a Full Width Half Maximum (FWHM) of 0.15 nm. For vegetation indices, the HR2000+ spectrometer with a wavelength coverage of 350 – 1100 nm and FWHM 1.1 nm were used (Ocean Optics). One cosine corrector (CC3, Ocean Optics) was attached to the irradiance fiber to achieve a FOV of 180° while a bare fiber with a FOV of 25° was installed as the nadir for canopy radiance collection. Two spectrometers were connected to a laptop to conduct automatic data collection. The spectral system (with the exception of the fibers), was placed in an enclosure with temperature controlled by an air conditioner. The target temperature was set to 25 °C. A temperature and humidity sensor (THC-4) was used to monitor the change in temperature and humidity continuously. Desiccant bags were added into the enclosure periodically to ensure the relative humidity was below 70%.
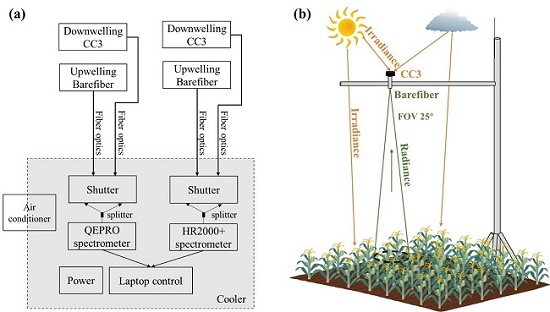
Figure 2. Schematic layout and deployment of FluoSpec2. (a) Schematic diagram of a FluoSpec2 system; (b) Conceptual field deployment of a FluoSpec2 system. FOV: field of view.
Data Collection
FluoSpec Manager, a software written in Visual Basic with libraries provided by Ocean Optics was installed on the laptop to control the automatic irradiance and radiance data collection at 5-min intervals (Yang et al., 2018). The integrating time for each spectrum was optimized by the algorithm in FluoSpec Manager with the target maximum digital number (DN) 120000 for QEPRO and 12000 for HR2000+, respectively. For each 5-min interval, data were collected in the following sequence: 150 HR2000+ irradiance – HR2000+ radiance – HR2000+ irradiance – QEPRO irradiance – QEPRO radiance – QEPRO irradiance. The dark current for QEPRO was collected after each observation with the same integrating time as the observation through controlling the internal shutter of QEPRO. For HR2000+, the dark signal was collected using OceanView (Ocean Optics) under various integrating times, and the dark signal with a similar integrating time as the observation was used to match with each observation. From 2016 to 2021, a total of 15 site-years data were collected with eight site-years for corn, five site-years for soybeans, and two site-years for miscanthus. For each site-year, corn and soybean were planted during April or May and harvested in September or October. Miscanthus emerged in March and was harvested in the following year in February or March. At each site-year, the FluoSpec2 system was installed close to the eddy covariance (EC) tower to integrate with EC flux measurements.
Data process and analysis
Collected solar irradiance and canopy radiance data from QEPRO and HR2000+ were used for SIF retrieval and VIs estimation, respectively. At each site year, different SIF retrieval algorithms were first used to derive raw SIF at 760 nm (SIF760). Radiometric calibration coefficients were then adjusted to account for the calibrating light source degradation across years. Calibration-corrected SIF760 was finally upscaled to match the EC footprint. Different vegetation indices were estimated from the visible to near-infrared band reflectance calculated from HR2000+ irradiance and radiance. The Simple Analytical Footprint model on Eulerian coordinates (SAFE) developed by Chen et al. (2009) was used to calculate the EC footprint weights. This upscaling was not conducted at the US-UiC 2016 soybean and US-Ne3 2019 corn sites due to the unavailability of PlanetScope data in 2016 and the missing inputs for the EC footprint models at the US-Ne3 2019 corn site.
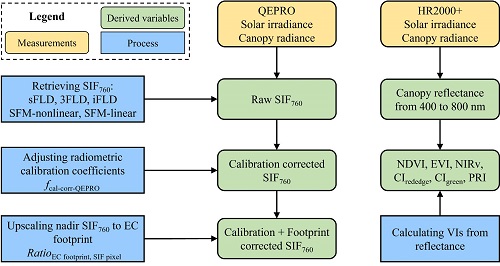
Figure 3. Flow chart of data processing at each site-year. sFLD: standard Fraunhofer line depth; 3FLD: three-band Fraunhofer line depth; iFLD: improved Fraunhofer line depth; SFM-nonlinear: spectral fitting method with the assumption of non-linear variation of fluorescence and reflectance over the absorption band; SFM-linear: spectral fitting method with the assumption of linear variation of fluorescence and reflectance over the absorption band; fcal-corr-QEPRO: the calibration adjustment factor for SIF; EC: eddy covariance; the ratio between EC footprint weighted vegetation index and SIF tower located pixel vegetation index.
SIF retrieval methods
SIF adds a weak signal to the reflected solar radiation, which results in two contributions to the upwelling radiance (L). Most retrieval algorithms for ground SIF are based on the Fraunhofer line depth (FLD) principle and the spectral fitting method (SFM). FLD approaches exploit the reduced downwelling irradiance (E) inside the oxygen absorption bands (O2A and O2B) reaching the surface, which result in an increase in the relative contribution of SIF to L. Several FLD methods are commonly used in ground SIF retrieval, including standard FLD (sFLD), three bands FLD (3FLD), and improved FLD (iFLD). All of them rely on the measurements of E and L inside and outside the absorption window (λin and λout). This study specifically focused on the O2A absorption window (760 nm) considering the wavelength coverage of QEPRO. The upwelling radiance inside and outside the O2A band (L(λin), L(λout)) is a function of reflectance (R(λin), R(λout)), irradiance (E(λin), E(λout)) and SIF (SIF(λin), SIF(λout)) inside and outside the absorption band, respectively.
Different from FLD-based approaches, the SFM method aims to decouple SIF and reflectance from radiance observations through general mathematical representations of canopy SIF and R within the narrow absorption windows centered at 760 nm. The parameterization of functions for SIF and R is optimized by the least-square optimization process with observed radiance as a reference. Both linear and non-linear functions can be used to represent SIF and R. In this study, both the linear method which assumes that SIF and R both linearly change with wavelength (Miao et al., 2018), and the non-linear method for which a Gaussian function is used to SIF and a cubic spline function is used to model R (Cendrero-Mateo et al., 2019) were used.
Radiometric calibration coefficient adjustment for SIF
To account for the degradation of the light source used for irradiance calibration, a cross-calibration method was used to adjust the change of radiometric calibration coefficients across years. Signal degradation would affect the estimation of SIF since SIF is an absolute light signal, while it does not affect the calculation of vegetation indices since these indices are derived from reflectance which is a ratio. To adjust for the degradation effect, for each site- year, the PAR from HR2000+ was first calculated by integrating the irradiance from 400 to 700 nm, then HR2000+-based PAR was compared with a LiCor quantum sensor that was well calibrated and obtained a correction factor. Second, the near-infrared irradiance from 730 to 780 nm was compared between QEPRO and HR2000+, from which a second corrector factor was obtained. Last, the product of the first correction factor and the second correction factor was used as the final radiometric calibration coefficient adjustment factor for QEPRO.
Footprint upscaling for in-situ nadir SIF to match GPP footprint
PlanetScope satellite provides the surface reflectance at daily timestamp with 3-m spatial resolution (Houborg and McCabe, 2016), from which daily NIRv was calculated and used for upscaling SIF to EC footprint. To further reduce the soil background impact on NIRv, soil adjusted NIRv (SANIRv) was calculated following the method in (Jiang et al., 2020) and used for SIF footprint upscaling. EC footprint models were run at half-hourly timestamps to obtain the footprint weights (wi) of each 3-m × 3-m pixel within 2 km × 2 km centered at the EC tower. SIF tower location was represented by one 3-m × 3-m pixel. The Simple Analytical Footprint model on Eulerian coordinates (SAFE, Chen et al., 2009) was used to calculate the EC footprint weights. This upscaling is not conducted at the US-UiC 2016 soybean and US-Ne3 2019 corn sites due to the unavailability of PlanetScope data in 2016 and the missing inputs for the EC footprint models at the US-Ne3 2019 corn site.
Vegetation indices estimation and SIF decomposition analysis
Several commonly used vegetation indices including NDVI, EVI, NIRv, CIrededge, CIgreen and PRI were estimated from the hyperspectral reflectance collected by HR2000+. The reflectance beyond 800 nm was noisy, therefore, reflectance from 770 to 780 nm was used as the near-infrared reflectance. The enclosure temperatures at some site-years were not well controlled at 25°C due to the high summer temperatures at the sites (air temperature up to 35°C); therefore, the SIF retrievals were specifically compared under different enclosure temperatures. Four representative site-years were selected to cover the four species as well as different enclosure temperature ranges: US-UiC 2017 corn, US-UiC 2018 Corn, US-Ne3 2018 soy, and US-UiB 2019 Mis.
fPAR at most of the site-years were derived from in-situ PAR measurements, except US-UiC 2016 soybean, US-UiC 2017 corn and US-UiC 2018 corn. Specifically, incoming PAR (PARin) and surface reflected PAR (PARout) were measured by point quantum sensors (LI-190; LICOR Bioscience, NE, USA). Transmitted PAR (PARtrans) was measured by line quantum sensors (LI-191; LICOR Bioscience) placed about 2 cm above the ground. For US-Ne2 and US-Ne3, PAR reflected by soil (PARsoil) was measured by line quantum sensors facing downward. For the three site-years without PARtrans measurements, fPAR was estimated by the red edge normalized difference vegetation index (Rededge NDVI) (Miao et al., 2018; Viña and Gitelson, 2005; Yang et al., 2021). This method for fPAR calculation was not applied at the miscanthus site since it was developed for corn and soybean. Except for US-Ne3 2019 corn where fPARMeas and APARMeas were estimated at an hourly scale due to the missing raw data, fPAR and APAR at other site-years were at a half-hourly scale.
Refer to Wu et al. (2022, In Process) for additional details.
Data Access
These data are available through the Oak Ridge National Laboratory (ORNL) Distributed Active Archive Center (DAAC).
SIF and Vegetation Indices in the US Midwestern Agroecosystems, 2016-2021
Contact for Data Center Access Information:
- E-mail: uso@daac.ornl.gov
- Telephone: +1 (865) 241-3952
References
Cendrero-Mateo, M.P., S. Wieneke, A. Damm, L. Alonso, F. Pinto, J. Moreno, L. Guanter, M. Celesti, M. Rossini, N. Sabater, S. Cogliati, T. Julitta, U. Rascher, Y. Goulas, H. Aasen, J. Pacheco-Labrador, and A. MacArthur. 2019. Sun-induced chlorophyll fluorescence III: Benchmarking retrieval methods and sensor characteristics for proximal sensing, Remote Sensing 11:962. https://doi.org/10.3390/rs11080962
Chen, B., T.A. Black, N.C. Coops, T. Hilker, J.A. Trofymow, and K. Morgenstern. 2009. Assessing tower flux footprint climatology and scaling between remotely sensed and eddy covariance measurements. Boundary-Layer Meteorology 130:137–167. https://doi.org/10.1007/s10546-008-9339-1
Miao, G., K. Guan, X. Yang, C.J. Bernacchi, J.A. Berry, E.H. DeLucia, J. Wu, C.E. Moore, K. Meacham, Y. Cai, B. Peng, H. Kimm, and M.D. Masters. 2018. Sun-induced chlorophyll fluorescence, photosynthesis, and light use efficiency of a soybean field from seasonally continuous measurements. Journal of Geophysical Research-Biogeosciences, 123, 610-623. https://doi.org/10.1002/2017JG004180
Viña, A., and A. A. Gitelson. 2005. New developments in the remote estimation of the fraction of absorbed photosynthetically active radiation in crops, Geophysical Research Letters 32:L17403. https://doi.org/10.1029/2005GL023647
Wu, G., K. Guan, H. Kimm, G. Miao, X. Yang, and C. Jiang. 2022. Ground solar-induced chlorophyll fluorescence and vegetation indices in the U.S. Midwestern Agroecosystems. In Process.
Yang, P., C. van der Tol, P.K.E. Campbell, and E.M. Middleton. 2021. Unraveling the physical and physiological basis for the solar- induced chlorophyll fluorescence and photosynthesis relationship using continuous leaf and canopy measurements of a corn crop, Biogeosciences 18:441–465. https://doi.org/10.5194/bg-18-441-2021
Yang, X., H. Shi, A. Stovall, K. Guan, G. Miao, Y. Zhang, Y. Zhang, X. Xiao, Y. Ryu, and J.E. Lee. 2018. FluoSpec 2—an automated field spectroscopy system to monitor canopy solar-induced fluorescence. Sensors (Switzerland) 18:2063. https://doi.org/10.3390/s18072063