Documentation Revision Date: 2023-07-13
Dataset Version: 1
Summary
This dataset includes 90 data files in shapefile format contained in compressed (*.zip) files.
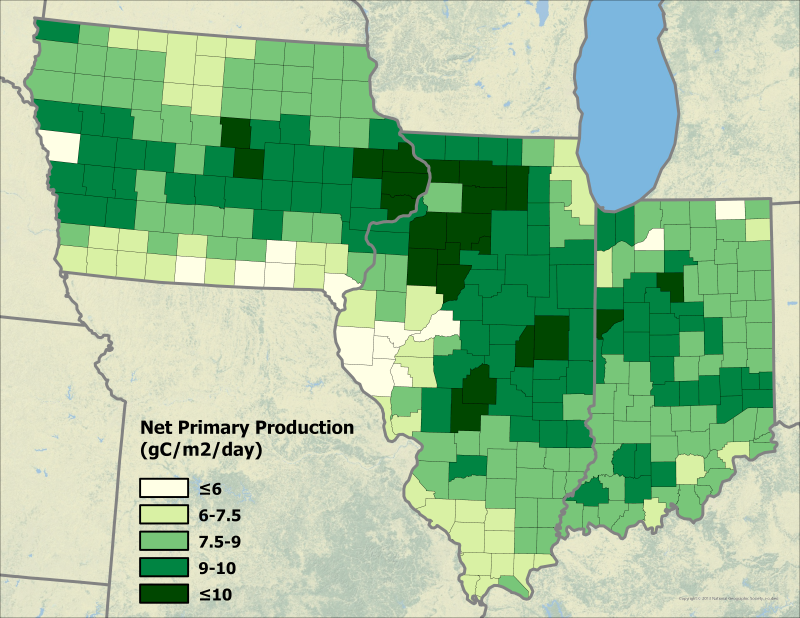
Figure 1: Model-estimated net primary production over the study area on July 18, 2018.
Citation
Zhou, W., K. Guan, and B. Peng. 2023. Ecosys Model-Estimated Cropland Carbon Fluxes, Illinois, Indiana, and Iowa, 2001-2018. ORNL DAAC, Oak Ridge, Tennessee, USA. https://doi.org/10.3334/ORNLDAAC/2125
Table of Contents
- Dataset Overview
- Data Characteristics
- Application and Derivation
- Quality Assessment
- Data Acquisition, Materials, and Methods
- Data Access
- References
Dataset Overview
This dataset contains daily estimates of carbon fluxes in croplands derived from the "ecosys" model covering a portion of the Midwestern US (Illinois, Indiana, and Iowa) at county-level resolution from 2001-2018. Ecosys simulates water, energy, carbon, and nutrient cycles simultaneously for various ecosystems, including agricultural systems at up to hourly resolution. Estimates include: gross primary productivity (GPP), net primary productivity (NPP), autotrophic respiration (Ra), heterotrophic respiration (Rh), or net ecosystem exchange (NEE). Data were generated by the ecosys model constrained by observational data, including USDA crop yield from USDA National Agricultural Statistics Service, and a remote-sensing-based SLOPE GPP product. Model performance was evaluated using observations from AmeriFlux towers at agricultural sites within the study area. Agriculture in the US Midwest produces significant quantities of corn and soybeans, which are key elements to the global food supply. The data are provided in shapefile format.
Project: Carbon Monitoring System
The NASA Carbon Monitoring System (CMS) program is designed to make significant contributions in characterizing, quantifying, understanding, and predicting the evolution of global carbon sources and sinks through improved monitoring of carbon stocks and fluxes. The System uses NASA satellite observations and modeling/analysis capabilities to establish the accuracy, quantitative uncertainties, and utility of products for supporting national and international policy, regulatory, and management activities. CMS data products are designed to inform near-term policy development and planning.
Data Characteristics
Spatial Coverage: Illinois, Indiana, and Iowa, USA
Spatial Resolution: Data are summarized by county
Temporal Coverage: 2001-01-01 to 2018-12-31
Temporal Resolution: Daily
Study Areas: Latitude and longitude are given in decimal degrees.
| Site | Westernmost Longitude | Easternmost Longitude | Northernmost Latitude | Southernmost Latitude |
|---|---|---|---|---|
| Illinois, Indiana, and Iowa | -96.63 | -84.79 | 43.51 | 36.96 |
Data File Information
This dataset includes 90 shapefiles format (with *.cpg, *.dbf, *.prj, *.shp, and *.shx files) contained in compressed (*.zip) files. There is one shapefile for each variable (GPP, NPP, Ra, Rh, and NEE) for every year (2001-2018). Data are presented in units of grams carbon per m2 per day.
The file naming convention is Ecosys_variable_year.zip (e.g., Ecosys_NPP_2018.zip), where
- variable = GPP (gross primary productivity), NPP (net primary productivity), Ra (autotrophic respiration), Rh (heterotrophic respiration), or NEE (net ecosystem exchange)
- year = the year modeled
The shapefiles are in geographic coordinates using EPSG:4269 in the NAD 83 datum.
There is no missing data within the mapped counties.
Table 1. Shapefile variables.
| Variable | Units | Description |
|---|---|---|
| STATEFP | State FIPS code | |
| COUNTYFP | County FIPS code | |
| NAME | County Name | |
| FIPS | Full FIPS code | |
| YYYY-MM-DD | g m-2 d-1 | Measure of variable listed in the file name for a given date in grams carbon per m2 per day. There is a unique variable for each day of the year. For example, ‘2018-07-07’ in the Ecosys_NPP_2018.zip file represents the rate of net primary productivity for July 7th, 2018. |
Application and Derivation
Agriculture in the US Midwest produces significant quantities of corn and soybeans, which are key elements to the global food supply. This dataset provides model estimates of cropland carbon fluxes with less uncertainty than previous approaches.
See Zhou et al. (2021) for additional details.
Quality Assessment
The ecosys model has been extensively evaluated over seven Ameriflux tower sites in the U.S. Midwest. The Root Mean Square Error (RMSE) for GPP ranges from 1.64 to 3.31 grams carbon per m2 per day (gC m-2 d-1). The RMSE for Reco ranges from 1.3 to 2.04 gC m-2 d-1. RMSE for NEE ranges from 1.51 to 2.34 gC m-2 d-1. See Table 2 in Zhou et al. (2021) for more details.
Data Acquisition, Materials, and Methods
The agroecosystem model ecosys (Grant, 2001) was used to simulate carbon budgets over a portion of the midwestern U.S. Simulations were conducted at each county within Illinois, Indiana, and Iowa from 2001 to 2018 using corn-soybean rotation without irrigation (the major planting strategies within this area). The North American Land Data Assimilation System (NLDAS-2) hourly meteorological data and gSSURGO soil data were used for input data. NLDAS-2 meteorological data is from the integration of observation-based and model reanalysis data, with 0.125-degree spatial resolution covering central North America. The county scale meteorological variables were aggregated from the NLDAS- 2 grids within that county. The National 2020 Cultivated Layer (based on 2016-2020 USDA Cropland Data Layer) (USDA, 2021) and gSSURGO datasets were used to obtain the county-scale soil properties (i.e., BD, soil texture, WP, FC, KSat, SOC, pH, and CEC) that correspond to the county-scale cropland majority soil type. For regional scale simulations, corn and soybean were also planted with 7.5 plants m-2 and 37.1 plants m-2 at the county scale based on the RMA planting date (2001–2012) (Lobell et al., 2014) and the state-scale and agricultural district-scale crop progress reports (2013–2018) depending on the data availability, and all crops were harvested on October 31. The state-wise crop specific fertilizer information provided by USDA (USDA, 2019) was applied in the simulations.
Model calibration and evaluation used county-scale rainfed corn and soybean yield from USDA National Agricultural Statistics Service (NASS), and 250-m resolution daily GPP estimation using MODIS-based soil-adjusted near-infrared reflectance of vegetation (SANIRv) and photosynthetically active radiation (PAR) (Jiang et al., 2021). The fixed linear yield trend was calculated from the USDA National Agricultural Statistics Service (NASS) crop yield data for corn and soybean respectively for each county, and was used to adjust the simulated yield to year 2009 (the midpoint of 2001-2018). To constrain ecosys efficiently, surrogate models for crop yield and GPP separately using the Long Short Term Memory networks (LSTM) to predict daily GPP and end-of-seasonal crop yield under different corn and soybean parameters. In these models, the daily climate meteorological data, three layers of soil parameters (i.e., 0-5, 5-30, and 30-100 cm), crop type, corn parameters, soybean parameters, fertilizer amount, planting and harvest date, and day of year (DOY) were used as inputs, and GPP or crop yield were used as output, respectively. The RMSE of the surrogate models were 13.5 gC m-2 and 0.46 gC m-2 d-1 for yield and GPP, respectively. The parameters for soybean include rubisco carboxylation activity, plant maturity group, maximum number of fruiting sites per reproductive node, and maximum rate of kernel filling; and for corn include fraction of leaf protein in bundle sheath chlorophyll, plant maturity group, maximum number of fruiting sites per reproductive node, and maximum rate of kernel filling. Parameter calibration for each county was conducted based on the surrogate models, and used data from even years during 2001 to 2018 for model constraint and those from odd years for model validation. In applying the constraint, the difference between simulated and observed yield, accumulated growing season (i.e., May to September) GPP, and monthly growing season GPP were minimized using a cost function.
Additional methodology details can be found in Zhou et al. (2021).
Data Access
These data are available through the Oak Ridge National Laboratory (ORNL) Distributed Active Archive Center (DAAC).
Ecosys Model-Estimated Cropland Carbon Fluxes, Illinois, Indiana, and Iowa, 2001-2018
Contact for Data Center Access Information:
- E-mail: uso@daac.ornl.gov
- Telephone: +1 (865) 241-3952
References
Grant, R.F. 2001. A review of the Canadian ecosystem model ecosys. Pp. 175-264 in M. Shaffer (ed). Modeling carbon and nitrogen dynamics for soil management. CRC Press, Boca Raton, Florida.
Jiang, C., K. Guan, G. Wu, B. Peng, and S. Wang. 2021. A daily, 250 m and real-time gross primary productivity product (2000–present) covering the contiguous United States. Earth System Science Data 13:281–298. https://doi.org/10.5194/essd-13-281-2021
Lobell, D.B., M.J. Roberts, W. Schlenker, N. Braun, B.B. Little, R.M. Rejesus, and G.L. Hammer. 2014. Greater Sensitivity to Drought Accompanies Maize Yield Increase in the U.S. Midwest. Science 344:516–519. https://doi.org/10.1126/science.1251423
Zhou, W., K. Guan, B. Peng, J. Tang, Z. Jin, C. Jiang, R. Grant, and S. Mezbahuddin. 2021. Quantifying carbon budget, crop yields and their responses to environmental variability using the ecosys model for U.S. Midwestern agroecosystems. Agricultural and Forest Meteorology 307:108521. https://doi.org/10.1016/j.agrformet.2021.108521
USDA. 2019. Fertilizer Use and Price. https://www.ers.usda.gov/data-products/fertilizer-use-and-price/.
USDA. 2021. USDA National Agricultural Statistics Service Cropland Data Layer. USDA-NASS, Washington, DC. https://nassgeodata.gmu.edu/CropScape