Documentation Revision Date: 2019-03-07
Dataset Version: 1
Summary
These SOC estimates provide a reproducible example, on country-specific and regional scales, for digital soil mapping across Latin America and contribute to reducing the uncertainty of SOC estimates and improving the parameterization of global models across Latin America.
This dataset includes six data files in GeoTIFF (.tif) format at 5 km resolution across Latin America, including: (1) a mosaic of country-specific soil organic carbon estimates, (2) model uncertainty derived for the country-specific estimates, (3) a mosaic of the regional soil organic carbon estimates, (4) model uncertainty derived for the regional estimates, and (5-6) two trend maps of approximate errors associated with the SOC stock calculation method. There is one data file in comma-separated format (.csv) of the point soil characterization data with calculated SOC stock estimates.
Four companion files include: a 133-band GeoTiff containing the environmental predictor variables for SOC across Latin America, a .csv file with descriptions of the environmental variables, a shapefile (.shp) of the point soil characterization data with SOC stock estimates and a *.kmz file to display the same.
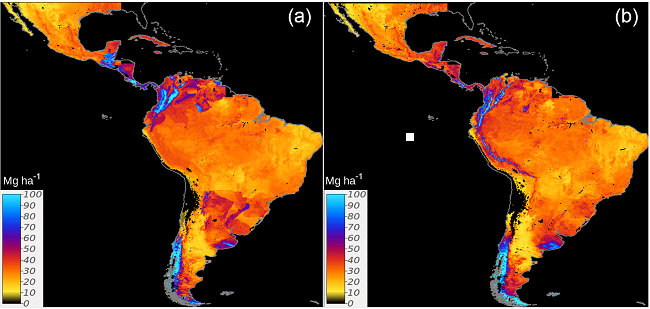
Figure 1. Country-specific (a) and regional (b) predictions of SOC across Latin America based on a linear ensemble of methods. The units are presented in units of Mg per ha for visualization purposes. The data provided with the dataset are in units of kg per m2. Image is from Guevara et al. (2018).
Citation
Guevara, M., G.F. Olmedo, E. Stell, Y. Yigini, C.A. Hernandez, G. Arevalo, C.E. Arroyo-cruz, A. Bolivar, S. Bunning, N.B. Canas, C.O. Cruz-gaistardo, F. Davila, M.D. Acqua, A. Encina, F. Fontes, J.A.H. Herrera, A.R.I. Navarro, V. Loayza, A.M. Manueles, F.M. Jara, C. Olivera, G. Pereira, P. Prieto, I.A. Ramos, J.C.R. Brina, R. Rivera, J. Rodriguez-Rodriguez, R. Roopnarine, A. Rosales, K.A.R. Rivero, G.A. Schulz, A. Spence, G.M. Vasques, R.R. Vargas, and R. Vargas. 2019. Soil Organic Carbon Stock Estimates with Uncertainty across Latin America. ORNL DAAC, Oak Ridge, Tennessee, USA. https://doi.org/10.3334/ORNLDAAC/1615
Table of Contents
- Dataset Overview
- Data Characteristics
- Application and Derivation
- Quality Assessment
- Data Acquisition, Materials, and Methods
- Data Access
- References
Dataset Overview
This dataset provides 5 x 5 km gridded estimates of soil organic carbon (SOC) across Latin America that were derived from existing point soil characterization data and compiled environmental prediction factors for SOC. This dataset is representative for the period between 1980 to 2000s corresponding with the highest density of observations available in the WoSIS system and the covariates used as prediction factors for soil organic carbon across Latin America. SOC stocks (kg/m2) were estimated for the SOC and bulk density point measurements and a spatially explicit measure of the SOC estimation error was also calculated. A modeling ensemble, using a linear combination of five statistical methods (regression Kriging, random forest, kernel weighted nearest neighbors, partial least squared regression and support vector machines) was applied to the SOC stock data at (1) country-specific and (2) regional scales to develop gridded SOC estimates (kg/m2) for all of Latin America. Uncertainty estimates are provided for the two model predictions based on independent model residuals and their full conditional response to the SOC prediction factors.
These SOC estimates provide a reproducible example, on country-specific and on regional scales, for digital soil mapping across Latin America and to contribute to reducing the uncertainty of SOC estimates and improving the parameterization of global models across Latin America.
This dataset contains the required files to reproduce the SOC estimates described in the publication by Guevara et al. 2018.
Project: Carbon Monitoring System
The NASA Carbon Monitoring System (CMS) is designed to make significant contributions in characterizing, quantifying, understanding, and predicting the evolution of global carbon sources and sinks through improved monitoring of carbon stocks and fluxes. The System will use the full range of NASA satellite observations and modeling/analysis capabilities to establish the accuracy, quantitative uncertainties, and utility of products for supporting national and international policy, regulatory, and management activities. CMS will maintain a global emphasis while providing finer scale regional information, utilizing space-based and surface-based data and will rapidly initiate generation and distribution of products both for user evaluation and to inform near-term policy development and planning.
Related Publication:
Guevara, M., G.F. Olmedo, E. Stell, Y. Yigini, Y.A. Duarte, C.A. Hernandez, G.E. Arevalo, C.E.Arroyo-Cruz, A. Bolivar, S. Bunning, N.B. Canas, C.O. Cruz-Gaistardo, F. Davila, M.D. Acqua, A. Encina, H.F. Tacona, F. Fontes, J.A.H. Herrera, A.R.I. Navarro, V. Loayza, A.M. Manueles, F.M. Jara, C. Olivera, R.O. Hermosilla, G. Pereira, P. Prieto, I.A. Ramos, J.C.R. Brina, R. Rivera, J. Rodriguez-Rodriguez, R. Roopnarine, A.R. Ibarra, K.A.R. Riveiro, G.A. Sxhulz, A. Spence, G.M. Vasques, R.R. Vargas, and R. Vargas. No silver bullet for digital soil mapping: country-specific soil organic carbon estimates across Latin America. SOIL, 4, 173–193, 2018. https://doi.org/10.5194/soil-4-173-2018
Acknowledgements:
This work was supported by the Global Soil Partnership, the Central America, Caribbean and Mexico Soil Partnership, and the South America Soil Partnership in collaboration with the Department of Plant and Soil Sciences at the University of Delaware. Mario Guevara acknowledges support from a CONACYT fellowship. Guillermo Federico Olmedo is supported by the Argentinian government through the project INTA PNSUELO1134032. Rodrigo Vargas acknowledges support from NASA (80NSSC18K0173) and USDA (2014-67003-22070).
Data Characteristics
Spatial Coverage: Latin America: including Mexico, Central America, and all of South America
Spatial Resolution: 5 x 5 km resolution
Temporal Coverage: The SOC model predictions are nominally for 2018-06-14. Point soil measurement data were collected over several decades, from 1940 to 2009. Source: WoSIS soil profile database Batjes et al. (2017).
Temporal Resolution: One-time SOC model predictions
Study Areas (All latitude and longitude given in decimal degrees)
|
Sites |
Westernmost Longitude |
Easternmost Longitude |
Northernmost Latitude |
Southernmost Latitude |
|---|---|---|---|---|
|
Latin America |
-121.2880556 |
-31.2372222 |
35.55916667 |
-58.57611111 |
Data File Information
This dataset includes six data files in GeoTIFF (.tif) format at 5 x 5 km resolution across Latin America, including: (1) a mosaic of country-specific soil organic carbon estimates, (2) model uncertainty derived for the country-specific estimates, (3) a mosaic of the regional soil organic carbon estimates, (4) model uncertainty derived for the regional estimates, and (5-6) two trend maps of approximated errors associated with the SOC stock calculation method. There is one data file in comma-separated format (.csv) of the Latin American point soil characterization data with calculated SOC stock estimates.
Four companion files include: a 133-band GeoTiff containing the environmental prediction factors for SOC across Latin America, a .csv file with descriptions of the environmental variables, a shapefile (.shp) of the point soil characterization data with SOC stock estimates and a *.kmz file to display the same.
Table 1. Data file names and descriptions with the data sources as referenced in Guevara et al. (2018).
| Filename | Description | Source |
|---|---|---|
| SOC_estimates_LatinAmerica.csv | The 11,268 point soil measurement locations with soil organic carbon, bulk density. Estimated soil organic carbon stock (SOCS), and approximated error. | WoSIS soil profile database Batjes et al. (2017). SOCS -- Guevara et al. (2018) |
| mean_absolute_error_probable_country_specific.tif | A trend map of approximated errors associated with the soil organic carbon calculation method in 5 x 5-km grids. Data are kg per meter square of soil in the first 30-cm depth. | Guevara et al. (2018) |
| mean_absolute_error_95_percent_country_specific | A trend map of approximated errors associated with the soil organic carbon calculation method in 5 x 5-km grids. The range of the 95% intervals of this error, the error range. Data are kg per meter square of soil in the first 30-cm depth. | Guevara et al. (2018) |
| SOC_predictions_country_specific.tif | A mosaic of country-specific soil organic carbon estimates. These maps are in the geographical coordinates and in a 5 x 5-km grid. | Guevara et al. (2018) |
| uncertainty_quantile_regression_forest_country_specific.tif | The model uncertainty derived for the country-specific ensembles in 5 x 5-km grids. They represent the full conditional response of independent model residuals to the soil organic carbon covariates. | Guevara et al. (2018) |
| SOC_predictions_regional.tif | A mosaic of the regional soil organic carbon estimates. These maps are in the geographical coordinates and in a 5 x 5-km grid. Data are kg per meter square of soil in the first 30-cm depth. | Guevara et al. (2018) |
| uncertainty_quantile_regression_forest_regional.tif | The model uncertainty derived for the regional ensemble in 5 x 5-km grids. | Guevara et al. (2018) |
Table 2. Companion file names and descriptions with the data sources as referenced in Guevara et al. (2018).
|
Filename |
Description |
Source |
|---|---|---|
|
background_variables.tif |
A 133-band GeoTiff containing the environmental prediction factors across Latin America generated by the worldgrids.org project and additional topographic terrain parameters for a total of 133 bands of environmental information. The layers were harmonized in a 5 x 5-km grid. Each band has a code ordered alphabetically and a description included in the .csv file below. |
WorldGrids (worldgrids.org), which is an initiative of ISRIC-World Soil Information. |
|
background_variables_description.csv |
Provides information regarding the 133-band GeoTIFF. |
WorldGrids (worldgrids.org), which is an initiative of ISRIC-World Soil Information. |
|
SOC_estimates_LatinAmerica.zip
|
A shapefile (.shp) provided in compressed format with the data provided in SOC_estimates_LatinAmerica.csv. |
Prepared by ORNL DAAC |
|
SOC_estimates_LatinAmerica.kmz |
A kmz provided for viewing in Google Earth. |
Prepared by ORNL DAAC |
|
County_SOC_Latin_America.pdf |
A pdf of this guide document. |
Prepared by ORNL DAAC |
Table 3. Variables in the file SOC_estimates_LatinAmerica.csv
Note: These variables are also in the companion files SOC_estimates_LatinAmerica.shp and SOC_estimates_LatinAmerica.kmz
| Variable | Units/format | Description |
|---|---|---|
| sort_order | Sequential observation number for file sorted by WoSIS identification number. | |
| WoSIS_identification_number | WoSIS identification number | |
| country | Latin American country | |
| latitude | Decimal degrees | Latitude |
| longitude | Decimal degrees | Longitude |
| soil_organic_carbon | % | Soil organic carbon (SOC) density, measured |
| bulk_density | kg/dm3 | Soil bulk density. Note that bulk density needs to be multiplied by 1000 to change kg/dm3 to kg/m3 for use in the SOCS equation proved below. |
| coarse_fragments | % | Percentage of coarse fragments (above 2 mm in diameter) in the sample |
| soil_organic_carbon_stock | kg/m2 | Soil organic carbon stock, 0-30 cm, calculated (SOCS) |
| socs_mean_error | kg/m2 | Estimate mean error of soil organic carbon stock, 0-30 cm, calculated (SOCS) |
Properties of the GeoTIFF files
No data value: -9999, Number of columns: 2091, Number of rows: 2129, EPSG code: 4326
Table 4. Minimum and maximum data values in the GeoTIFF files
| Filename | variables_units | min_val | max_val | nodata_val |
|---|---|---|---|---|
| mean_absolute_error_probable_country_specific.tif | kg m-2 | 1 | 19 | -9999 |
| mean_absolute_error_95_percent_country_specific.tif | kg m-2 | 0 | 11 | -9999 |
| SOC_predictions_country_specific.tif | kg m-2 | 1.2 | 46.2 | -9999 |
| uncertainty_quantile_regression_forest_country_specific.tif | kg m-2 | 0.1 | 2.6 | -9999 |
| SOC_predictions_regional.tif | kg m-2 | 0 | 36.3 | -9999 |
| uncertainty_quantile_regression_forest_regional.tif | kg m-2 | 0.1 | 3.5 | -9999 |
Application and Derivation
The study is expected to increase the capacity of Latin American institutions to provide accurate baseline estimates of SOC with a country-specific perspective following recommendations of GSOCmap-GSP (Guevara et al., 2018).
Quality Assessment
Uncertainty estimates are provided. Model uncertainty is the result of estimating independent model residuals and interpolating them using the quantile regression forest model to estimate the full conditional response of these residuals to the SOC prediction factors. In addition, a trend error map derived from the SOC estimation (e.g., from SOC density to SOC stock) is provided.
Data Acquisition, Materials, and Methods
The maps provided in this dataset were produced in support of the Global SOC Map of the Global Soil Partnership (GSOCmap-GSP). Country-specific soil organic carbon (SOC) maps are the baseline for the (GSOCmap-GSP) with the goal of producing global information for the first 30 cm.
Table 5. Latin American countries
| Country |
|---|
| ARG=Argentina |
| BLZ=Belize |
| BOL=Bolivia |
| BRA=Brazil |
| CHL=Chile |
| COL=Colombia |
| CRI=Costa Rica |
| CUB=Cuba |
| ECU=Ecuador |
| ESP=Espana |
| GTM=Guatemala |
| HND=Honduras |
| JAM=Jamaica |
| MEX=México |
| NIC=Nicaragua |
| PAN=Panama |
| PER=Peru |
| SUR=Suriname |
| SLV=El |
| Salvador |
| URY=Uruguay |
| VEN=Venezuela |
Point soil characteristics and stock calculation
For the Latin America maps, soil organic carbon information was extracted from the WoSIS soil profile database (Batjes et al., 2017). Only the countries with >10 SOC observations in the WoSIS soil profile database (Table 5) were analyzed. For each country, synthetic horizons were generated for 0 to 30 cm depth using a mass preserving spline approach (Malone et al., 2009). The soil organic carbon stock for 0 to 30 cm was estimated using Global Soil Information Facilities R, GSIF following a standardized SOC calculation method as in Nelson and Sommers (1982):
SOC stock = ORC/1000 × H/100 × BLD × (100 – coarse fragments) /100
Where
ORC is SOC density (g · kg−1) and H is soil depth (30 cm).
Each country-specific dataset was transformed to its natural logarithm to reduce the right-skewed distribution of SOC values (Guevara et al., 2018). The units of the calculated SOC stock are kg m−2 (depth=30cm). Propagated error of SOC stock estimates are provided (same units). These propagated errors are derived by the GSIF package using truncated Taylor series and shows only an approximated estimate. In addition, these errors were interpolated in R using the RF spatial framework (Hengl et al., 2018). Thus, a trend error map derived from the SOC estimation (e.g., from SOC density to SOC stock) is provided (Guevara et al., 2018).
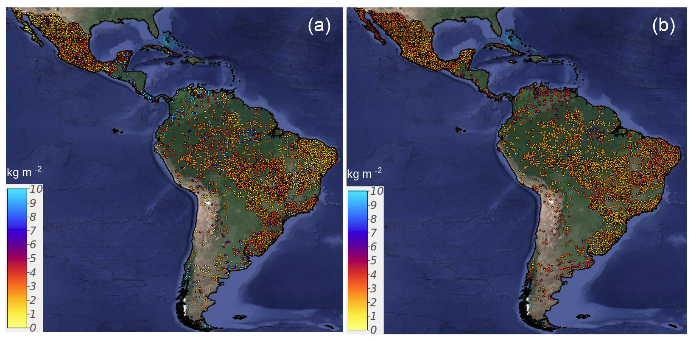
Figure 2. Spatial distribution of available SOC point data in WoSIS for Latin America. SOC estimates in (a) were calculated for each point using equation above. The approximated error in (b) represents the uncertainty of SOC estimates at each point. See Guevara et al. (2018) for additional details.
Soil prediction factors
Environmental information from WorldGrids (worldgrids.org, last accessed January 2017) was used for soil prediction factors, which is an initiative of ISRIC-World Soil Information. The prediction factors were harmonized into a 1 x 1-km global grid by the WorldGrids project from remote sensing, climate surfaces, and digital terrain analysis. Masked environmental layers (i.e., prediction factors) for each country were used to quantitatively represent the soil forming environment. Additional terrain parameters (e.g., terrain slope, aspect, catchment area, channel network base level, terrain curvature, topographic wetness index, length-slope factor) from elevation data were calculated in SAGA GIS for each country following the 10- standard implementation for basic terrain parameters (Conrad et al., 2015). The prediction factors were resampled into a 5 x 5-km pixel size grid to reduce the computational demand required to make predictions and facilitate the reproducibility of this DSM framework (Refer also to the companion file background_variables_description.csv).
Prediction of SOC and map generation
The following steps were implemented for the prediction of individual country SOC and map generation) and the combined map:
- The relationship between SOC and prediction factors was explored using simple correlation analysis. The 10 prediction factors with highest correlations with SOC data were selected for each country and used for further analyses.
- Regression-Kriging (based on a multiple linear regression model (RK), partial least squares regression (PLS)), and three machine learning models including support vector machines (SVM), random forests (RF), and kernel weighted nearest neighbors (KK), were utilized to generate SOC maps for each country.
- A five times repeated 5-fold cross-validation strategy of the aforementioned models was used to estimate the RMSE. The caretEnsemble approach was then used for stacking the five predictions which uses the RMSE to weight and create ensembles of regression models under a generalized approach to create a linear blend of predictions.
- Independent model residuals (by predicting the 25 % of data not used for model parameterization) were calculated.
- The full conditional response was estimated for each 5 x 5-km pixel of these residuals to the SOC prediction factors following the quantile regression method available within the quantregForest modeling framework (Meinshausen, 2006). The map of the full conditional response is surrogate of model uncertainty, complementary to the approximated error trend of SOC stock estimates.
- All Latin American data in the WoSIS system were used to repeat the fourth and fifth steps of the modeling framework, generating regional predictions of SOC and comparing with country-specific results and global SOC estimates.
- A weighted average of the country-specific predictions was used to generate a combined SOC map. The weights of this average were defined by the relationship between the errors (measured as the RMSE) and the correlation (ECr).
The model prediction range was the result of estimating independent model residuals and interpolating them using the quantile regression forest model to estimate the full conditional response of these residuals to the SOC prediction factors. Finally, the variance of the different prediction approaches was used divided by the mean and multiplied by 100 to provide an interpretable standardized visualization of uncertainty (i.e., in percent).
Refer to Guevara et al. (2018) for additional details.
Data Access
These data are available through the Oak Ridge National Laboratory (ORNL) Distributed Active Archive Center (DAAC).
Soil Organic Carbon Stock Estimates with Uncertainty across Latin America
Contact for Data Center Access Information:
- E-mail: uso@daac.ornl.gov
- Telephone: +1 (865) 241-3952
References
Batjes, N. H., Ribeiro, E., van Oostrum, A., Leenaars, J., Hengl, T., and Mendes de Jesus, J.: 2017. WoSIS: providing standardised soil profile data for the world, Earth Syst. Sci. Data, 9, 1-14, https://doi.org/10.5194/essd-9-1-2017
Conrad, O., B. Bechtel, M. Bock, H. Dietrich, E. Fischer, L. Gerlitz, J. Wehberg, V. Wichmann, and J. Böhner. 2015. System for Automated Geoscientific Analyses (SAGA) v. 2.1.4, Geosci. Model Dev., 8, 1991–2007, https://doi.org/10.5194/gmd-8-1991-2015
Guevara, M., G.F. Olmedo, E. Stell, Y. Yigini, Y.A. Duarte, C.A. Hernandez, G.E. Arevalo, C.E.Arroyo-Cruz, A. Bolivar, S. Bunning, N.B. Canas, C.O. Cruz-Gaistardo, F. Davila, M.D. Acqua, A. Encina, H.F. Tacona, F. Fontes, J.A.H. Herrera, A.R.I. Navarro, V. Loayza, A.M. Manueles, F.M. Jara, C. Olivera, R.O. Hermosilla, G. Pereira, P. Prieto, I.A. Ramos, J.C.R. Brina, R. Rivera, J. Rodriguez-Rodriguez, R. Roopnarine, A.R. Ibarra, K.A.R. Riveiro, G.A. Sxhulz, A. Spence, G.M. Vasques, R.R. Vargas, and R. Vargas. No silver bullet for digital soil mapping: country-specific soil organic carbon estimates across Latin America. SOIL, 4, 173–193, 2018. https://doi.org/10.5194/soil-4-173-2018
Hengl, T., M. Nussbaum, M.N. Wright, G.B.M. Heuvelink, and B. Graler. 2018. Random Forest as a generic framework for predictive modeling of spatial and spatio-temporal variables. PeerJ 6:e5518 https://doi.org/10.7717/peerj.5518
Malone, B.P., A.B. McBratney, B. Minasny, and G.M. Laslett. 2009. Mapping continuous depth functions of soil carbon storage and available water capacity. Geoderma, 154(1-2), 138-152. https://doi.org/10.1016/j.geoderma.2009.10.007
Meinshausen, N. 2006. Quantile Regression Forests. Journal of Machine Learning Research, 7, 983–999.
Nelson, D.W. and L.E. Sommers. 1982. Total Organic Carbon, and Organic Matter. Published in Methods of Soil Analysis, Part 2. Chemical and Microbiological Properties-Agronomy Monograph no.9 (2nd Edition). ISBN 0-89118-072-9 (pt. 2)