Documentation Revision Date: 2021-06-14
Dataset Version: 1
Summary
Tidal wetlands provide myriad ecosystem services and have uncertain vulnerability or resilience to rising sea levels. Tidal wetlands in the CONUS are geographically diverse with differing elevation gradients and tidal ranges, making broad geographic or intercoastal comparisons of wetland processes and vulnerability difficult. Relative tidal elevation, a physical metric that normalizes elevation to tidal range, provides an alternative to vegetation classification for mapping tidal wetlands.
There are nine data files in GeoTIFF (*.tif) format included in this dataset.
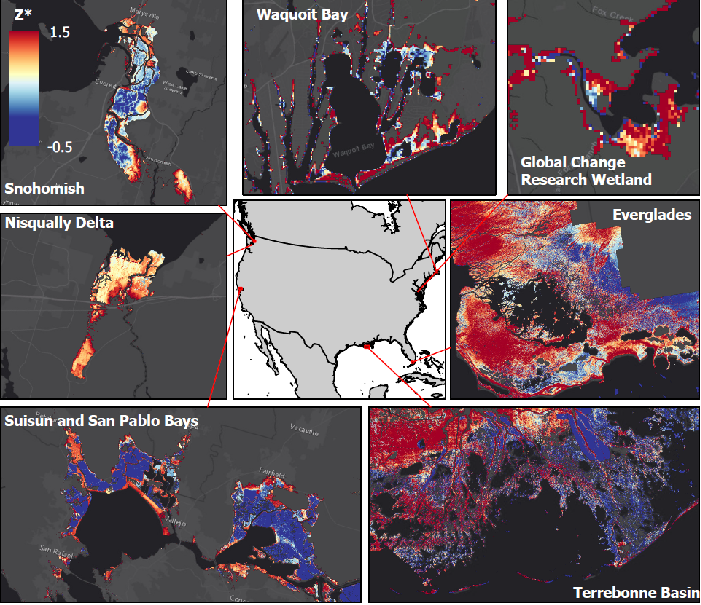
Figure 1. Relative tidal elevation (Z*) maps representing diverse locations spanning the Contiguous United States
Citation
Holmquist, J.R., and L. Windham-Myers. 2021. Relative Tidal Marsh Elevation Maps with Uncertainty for Conterminous USA, 2010. ORNL DAAC, Oak Ridge, Tennessee, USA. https://doi.org/10.3334/ORNLDAAC/1844
Table of Contents
- Dataset Overview
- Data Characteristics
- Application and Derivation
- Quality Assessment
- Data Acquisition, Materials, and Methods
- Data Access
- References
Dataset Overview
This dataset provides maps of the elevation of coastal wetlands relative to tidal ranges for the conterminous United States (CONUS) at 30 m resolution for 2010. It also includes maps of tidal amplitude, relative sea-level rise for the period 1983–2001, and maps for coastal lands and low marsh areas based on the probability of being below the mean higher high tide water line for spring tides (MHHWS). Uncertainty layers for elevation maps are also provided.
Tidal wetlands provide myriad ecosystem services and have uncertain vulnerability or resilience to rising sea levels. Tidal wetlands in the CONUS are geographically diverse with differing elevation gradients and tidal ranges, making broad geographic or intercoastal comparisons of wetland processes and vulnerability difficult. Relative tidal elevation, a physical metric that normalizes elevation to tidal range, provides an alternative to vegetation classification for mapping tidal wetlands.
Project: Carbon Monitoring System
The NASA Carbon Monitoring System (CMS) program is designed to make significant contributions in characterizing, quantifying, understanding, and predicting the evolution of global carbon sources and sinks through improved monitoring of carbon stocks and fluxes. The System uses NASA satellite observations and modeling/analysis capabilities to establish the accuracy, quantitative uncertainties, and utility of products for supporting national and international policy, regulatory, and management activities. CMS data products are designed to inform near-term policy development and planning.
Related Publication
Holmquist, J. R., L. Windham-Myers, B. Bernal, K.B. Byrd, S. Crooks, M.E. Gonneea, N. Herold, S.H. Knox, K.D. Kroeger, J. McCombs, J.P. Megonigal, M. Lu, J.T. Morris, A.E. Sutton-Grier, T.G. Troxler, and D.E. Weller. 2018. Uncertainty in United States coastal wetland greenhouse gas inventorying. Environmental Research Letters 13:115005. https://doi.org/10.1088/1748-9326/aae157
Related Dataset
Holmquist, J.R., L. Windham-Myers, B. Bernal, K.B. Byrd, S. Crooks, M.E. Gonneea, N. Herold, S.H. Knox, K. Kroeger, J. Mccombs, P.J. Megonigal, L. Meng, J.T. Morris, A.E. Sutton-grier, T. Troxler, and D. Weller. 2019. Coastal Wetland Elevation and Carbon Flux Inventory with Uncertainty, USA, 2006-2011. ORNL DAAC, Oak Ridge, Tennessee, USA. https://doi.org/10.3334/ORNLDAAC/1650.
- The current dataset provides an update (file probabilistic_coastal_lands_V2.tif) to the probabilistic coastal lands map originally published in Holmquist et al. (2019) (file probability_elevation_is_below_MHHWS.tif). Version 2 supersedes the previous version.
Acknowledgments
This project received funding from NASA’s Carbon Monitoring System (grant NNH14AY67I), the U.S. Geological Survey's LandCarbon Program, and the National Science Foundation (grant DEB 1655622).
Data Characteristics
Spatial Coverage: Coastal areas of the conterminous United States
Spatial Resolution: 30 m
Temporal Coverage: 1983-01-01 to 2010-12-31
Temporal Resolution: decadal
Study Area: All latitudes and longitudes given in decimal degrees.
| Site | Westernmost Longitude | Easternmost Longitude | Northernmost Latitude | Southernmost Latitude |
|---|---|---|---|---|
| Conterminous United States | -134.672 | -56.854 | 48.271 | 20.566 |
Data File Information
There are nine data files in GeoTIFF (*.tif) format included in this dataset.
Table 1. File names and descriptions.
| File Name | Units | Data Type | No Data Value | Description |
|---|---|---|---|---|
| coastal_area_of_interest.tif | category | Byte | 255 | Categories of potential coastal lands based on probability of being below MHHWS and areas classified as intertidal wetland by the National Wetlands Inventory (NWI; 2006) and/or as estuarine wetland by the Coastal Change Analysis Program (C-CAP; 2010). 1 = probability below MHHWS >0.50 2 = 0.50 >probability below MHHWS >0.025 3 = 0.025 >probability below MHHWS >0.01 4 = Mapped as intertidal by NWI 5 = Mapped as estuarine emergent wetland by the C-CAP |
| estuarine_emergent_wetland_2010.tif | category | Byte | 0 | Any land identified as estuarine emergent wetland in 2010 by the C-CAP 0 = non-wetland 1 = wetland |
| probabilistic_coastal_lands_V2.tif | 1 | Float32 | -9999 |
Probability that elevation falls below MHHWS. An update to probability_elevation_is_below_MHHWS.tif in Holmquist et al. (2019). |
| probabilistic_low_marsh.tif | percent | Byte | 255 | Probability (as a percentage) of low marsh as estuarine emergent wetland in 2010. |
|
relative_tidal_elevation.tif ¥ |
1 | Float32 | 3.40E+38 | Relative tidal elevation (Z*), elevation normalized to the tidal range. Z* = (orthometric elevation - mean sea level) / (mean high water - mean sea level). |
|
relative_tidal_elevation_uncertainty.tif ¥ |
1 | Float32 | -9999 | Uncertainty in relative tidal elevation. |
| relative_tidal_elevation_dominant_uncertainty.tif | category | Byte | 255 |
Estuarine emergent wetlands classified by their dominant sources of uncertainty. |
| rslr_1983_2001.tif | mm y-1 | Float32 | -9999 | Relative sea-level rise (RSLR) from 1983–2001, extrapolated from NOAA tide gauges. |
| tidal_amplitude.tif | meters | Float32 | -9999 | Tidal amplitude over the last tidal datum period (mostly 1983–2001), extrapolated from NOAA tide gauges. |
¥ Extreme values are present in files relative_elevation.tif and relative_tidal_elevation_uncertainty.tif in regions of high topographic relief near the shoreline.
Data File Details
All files use the North America Albers Equal Area projection, North American Datum 1983 (EPSG:42303).
Application and Derivation
Tidal wetlands provide myriad ecosystem services and have uncertain vulnerability or resilience to rising sea levels. However, wetlands in the CONUS are geographically diverse with differing elevation gradients, and tidal ranges, making broad geographic or intercoastal comparisons of wetland processes and vulnerability difficult. Relative tidal elevation (Z*), a physical metric that normalizes elevation to tidal range, measures the position of a site within the local tidal range. It provides a definition of high and low marshes based on position within the tidal range compared to definitions based on vegetation type and field observations (Holmquist and Windham-Myers 2021). Z* indicates the relative frequency, period, and depth of inundation during tidal cycles. Moreover, Z* informs risk assessments for local consequences of sea-level rise.
This dataset illustrates broad patterns in tidal marshes over the CONUS. High marshes, saline to brackish wetlands occurring at elevations higher than the mean high-water line, were widespread, comprising roughly 39% of tidal wetland acreage. At the watershed scale, median elevation and the variability of elevation gradients generally decrease with latitude. The drivers of these patterns are difficult to determine because causal factors such as tidal amplitude, relative sea-level rise, lateral migration space, and photosynthetically active radiation are intercorrelated and have latitudinal trends. Uncertainty in Z* also decreases with latitude as a function of tidal amplitude.
Future studies could focus on validating and improving these products, as well as using them in synoptic wetland vulnerability assessments and improving monitoring of the coastal zone (Holmquist and Windham-Myers, 2021).
Quality Assessment
The sources of uncertainty include bias and error in LiDAR-based digital elevation models (DEMs) and variation among datums used for NOAA tide gauges. LIDAR errors influenced orthometric elevation, and tide gauge datums influenced calculations of tidal amplitude, MHW (mean high water), and MHHWS (mean higher high tide water line for spring tides). Moreover, it was necessary to extrapolate tidal datums for regions between gauges by kriging. Areas located further away from tide gauges have higher uncertainty than areas closer to tide gauges. Tide gauges with long data history have less uncertainty than newer gauges.
For orthometric elevation, the bias and random error associated with LiDAR-based DEMs was corrected using literature values (Hladik et al., 2013; Medeiros et al., 2015; Buffington et al., 2016). A weighted site-level average offset of 0.173 m (SE = 0.110 m, n = 20 sites, 19,762 data points) was used to correct bias in these DEMs. A random error of 0.205 m was included, resulting in an average total uncertainty in orthometric elevation of 0.233 m. For tidal datums, the level of uncertainty varied across space. Uncertainty from both gauge-specific data quality and the extrapolation process were included. Gauge-specific uncertainty was obtained from NOAA datum error reports, and uncertainty in the extrapolation was built into the kriging algorithm.
Relative tidal elevation (Z*) was computed from orthometric elevation, MHW, and MSL (mean sea level). Uncertainty in Z* was estimated by propagating errors from each of these sources along with their covariances. See Holmquist and Windham-Myers (2021) for details of these calculations.
Note that extreme values are present in files relative_elevation.tif and relative_tidal_elevation_uncertainty.tif in regions of high topographic relief near the shoreline.
Data Acquisition, Materials, and Methods
This project sought to map tidal areas and coastal wetlands based on relative tidal elevation (Z*), a physical metric that normalizes elevation to tidal range. Relative tidal elevation provides a definition of high and low marshes based on position within the tidal range rather than a definition based on vegetation type and field observations. To compute Z*, accurate estimates of local orthometric elevation (Z) and tidal ranges are necessary.
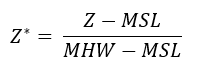
where MSL is mean sea level and MHW is mean high water, based on the local tidal datum.
The area of interest was defined by areas mapped as estuarine wetlands by the Coastal Change Analysis Program (C-CAP) (NOAA, 2014) and/or as tidal wetlands by the National Wetlands Inventory (U.S. Fish and Wildlife Service, 2014). Additional areas were included if they had a ≥1% probability of being below the MHHWS tide level. MHHWS was a datum calculated from NOAA high-low data (NOAA, CO-OPS 2017) (Holmquist et al., 2018).
Orthometric elevation (Z) was obtained from LiDAR-based DEMs. The majority of the DEMs were obtained from NOAA Sea Level Rise Viewer (NOAA, 2016). Additional DEMs were obtained for the northern Gulf of Mexico; the Sacramento Delta in California; Baltimore, and Calvert Counties in Maryland; Beaufort, and Georgetown Counties in South Carolina; Liberty and Glynn Counties, Georgia; and Mobile County, Alabama. Bias and uncertainty with these DEMs were addressed as discussed in the Quality Assessment section above.
Water levels and tidal ranges were gathered from NOAA tide gauges and mapped relative to NAVD 1988. Typically, datum periods span 1983–2001, but some gauges with locally high rates of relative sea-level rise report datums over shorter time periods. Uncertainty comes from NOAA datum error reports (NOAA, 2017a; NOAA, 2017b; NOAA, 2017c). Empirical Bayesian kriging (Krivoruchko, 2012) was used to extrapolate tidal datums from tide gauges across the area of interest. Kriging parameters included a cell size of 300, no transformations, 100 maximum local points, an overlap factor of 1, 100 semivariograms, and a power semi-variogram type. A standard circular search neighborhood with a radius of 15, angle of 0, and one sector was used with the number of neighbors set to max=15, min=10. Both median and standard error of the predictions were calculated. Uncertainty in tidal estimates was addressed as discussed in the Quality Assessment section above.
Relative tidal elevation was used to delineate “low” versus “high” marshes. Since a Z* value of 1 is the MHW line, it differentiates wetlands that flood twice a day from those that flood between once a day and a few times a month, given mixed and semi-diurnal tides. The probable occurrence of low and high marshes was estimated by evaluating the cumulative probability distribution of Z**.
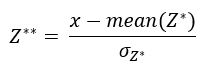
where x is the local grid cell value of Z* and σZ* is the standard deviation of Z*. Low marsh was indicated when the probability of Z**=1 was ≥0.5. These probabilities were converted to percentages and saved in the file probabilistic_low_marsh.tif.
Additional details of the analysis are provided in Holmquist et al. (2018) and Holmquist and Windham-Myers (2021).
Data Access
These data are available through the Oak Ridge National Laboratory (ORNL) Distributed Active Archive Center (DAAC).
Relative Tidal Marsh Elevation Maps with Uncertainty for Conterminous USA, 2010
Contact for Data Center Access Information:
- E-mail: uso@daac.ornl.gov
- Telephone: +1 (865) 241-3952
References
Buffington, K.J., B.D. Dugger, K.M. Thorne, and J.Y. Takekawa. 2016. Statistical correction of lidar-derived digital elevation models with multispectral airborne imagery in tidal marshes. Remote Sensing of Environment 186:616-625. https://doi.org/10.1016/j.rse.2016.09.020.
Hladik, C., J. Schalles, and M. Alber. 2013. Salt marsh elevation and habitat mapping using hyperspectral and LIDAR data. Remote Sensing of Environment 139:318-330. https://doi.org/10.1016/j.rse.2013.08.003.
Holmquist, J. R., L. Windham-Myers, B. Bernal, K.B. Byrd, S. Crooks, M.E. Gonneea, N. Herold, S.H. Knox, K.D. Kroeger, J. McCombs, J.P. Megonigal, M. Lu, J.T. Morris, A.E. Sutton-Grier, T.G. Troxler, and D.E. Weller. 2018. Uncertainty in United States coastal wetland greenhouse gas inventorying. Environmental Research Letters 13:115005. https://doi.org/10.1088/1748-9326/aae157
Holmquist, J.R., L. Windham-Myers, B. Bernal, K.B. Byrd, S. Crooks, M.E. Gonneea, N. Herold, S.H. Knox, K. Kroeger, J. Mccombs, P.J. Megonigal, L. Meng, J.T. Morris, A.E. Sutton-grier, T. Troxler, and D. Weller. 2019. Coastal Wetland Elevation and Carbon Flux Inventory with Uncertainty, USA, 2006-2011. ORNL DAAC, Oak Ridge, Tennessee, USA. https://doi.org/10.3334/ORNLDAAC/1650.
Holmquist, J.R., and L. Windham-Myers. 2021. A conterminous United States-scale map of relative tidal marsh elevation: An essential variable for assessing coastal resilience. Unpublished manuscript.
Krivoruchko, K. 2012. Empirical bayesian kriging: implemented in ArcGIS Geostatistical Analyst. ESRI; Redlands, CA, USA. https://www.esri.com/NEWS/ARCUSER/1012/files/ebk.pdf
Medeiros, S., S. Hagen, J. Weishampel, and J. Angelo. 2015. Adjusting Lidar-derived digital terrain models in coastal marshes based on estimated aboveground biomass density. Remote Sensing 7:3507–3525. https://doi.org/10.3390/rs70403507.
NOAA. 2014. Coastal Change Analysis Program (2006–2010). National Oceanic and Atmospheric Administration https://coast.noaa.gov/digitalcoast/data/ccapregional.html.
NOAA. 2016 Sea-level rise data download. Digital elevation models. National Oceanic and Atmospheric Administration. https://coast.noaa.gov/slrdata/
NOAA. 2017. Tidal datums. National Oceanic and Atmospheric Administration, https://tidesandcurrents.noaa.gov/datum_options.html
NOAA. 2017a. Datums Error East Coast. National Oceanic and Atmospheric Administration. https://tidesandcurrents.noaa.gov/pdf/Datums_error_east_coast.pdf
NOAA. 2017b. Datums Error West Coast. National Oceanic and Atmospheric Administration. https://tidesandcurrents.noaa.gov/pdf/Datums_error_west_coast.pdf
NOAA. 2017c. Datums Error Gulf Coast. National Oceanic and Atmospheric Administration. https://tidesandcurrents.noaa.gov/pdf/Datums_error_gulf_coast.pdf
NOAA CO-OPS. 2017. Water Level Data, Verified, High Low. National Oceanic and Atmospheric Administration.