Documentation Revision Date: 2021-06-28
Dataset Version: 1
Summary
There are 11 data files in netCDF Version 4 (*.nc4) format included with this dataset.
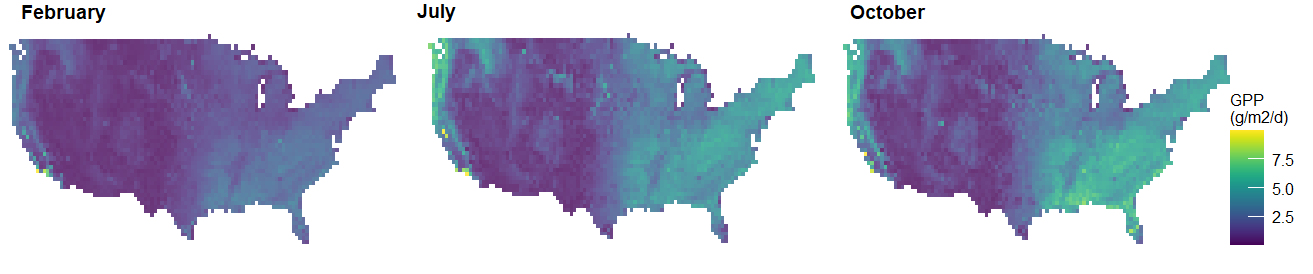
Figure 1. Monthly averages of gross primary production (GPP) for February, July, and October of 2010 for the continental U.S. Source: conus_GPP.nc4
Citation
Yang, Y., and S.S. Saatchi. 2020. CMS: Terrestrial Carbon Stocks, Emissions, and Fluxes for Conterminous US, 2001-2016. ORNL DAAC, Oak Ridge, Tennessee, USA. https://doi.org/10.3334/ORNLDAAC/1837
Table of Contents
- Dataset Overview
- Data Characteristics
- Application and Derivation
- Quality Assessment
- Data Acquisition, Materials, and Methods
- Data Access
- References
Dataset Overview
This dataset provides estimates of carbon pools, fluxes, and associated uncertainties across the contiguous USA (CONUS) at 0.5-degree resolution for all terrestrial land cover types. Carbon pools include labile carbon, foliar carbon, fine root, woody carbon, litter carbon, and soil organic carbon. Carbon fluxes include gross primary production (GPP), net primary production (NPP), net biome exchange, autotrophic respiration, and heterotrophic respiration. The modeled estimates are provided as monthly averages over the 16-year period, 2001 through 2016. The data were derived from the CARbon DAta MOdel fraMework (CARDAMOM) that included climate data, and above and belowground biomass maps of CONUS for the years 2005, 2010, 2015, and 2016 as input data sources to this model-data fusion framework. The input data were integrated into the CARDAMOM model to constrain the terrestrial carbon and to specifically attribute changes of forest carbon stocks and spatial distributions of carbon emissions and removals across forested lands. United States Forest Service's Forest Inventory and Analysis (FIA) plot data were used to train models for the prediction of forest aboveground biomass (AGB).
Project: Carbon Monitoring System
The NASA Carbon Monitoring System (CMS) program is designed to make significant contributions in characterizing, quantifying, understanding, and predicting the evolution of global carbon sources and sinks through improved monitoring of carbon stocks and fluxes. The System uses NASA satellite observations and modeling/analysis capabilities to establish the accuracy, quantitative uncertainties, and utility of products for supporting national and international policy, regulatory, and management activities. CMS data products are designed to inform near-term policy development and planning.
Related Publications
Yu, Y., S. Saatchi, G.M. Domke, B. Walters, C. Woodall, S. Ganguly, S. Li, S. Kalia, T. Park, R. Nemani, S.C. Hagen, and L. Melendy. 2021. Making the US National Forest Inventory Spatially Contiguous and Temporally Consistent. In Review at Environmental Research Letters.
Bloom, A.A., J.-F. Exbrayat, I.R. van der Velde, L. Feng, and M. Williams. 2016. The decadal state of the terrestrial carbon cycle: Global retrievals of terrestrial carbon allocation, pools, and residence times. Proceedings of the National Academy of Sciences 113:1285–1290. https://doi.org/10.1073/pnas.1515160113
Related Dataset
Hagen, S., Harris, N., Saatchi, S.S., Pearson, T., Woodall, C.W., Ganguly, S., Domke, G.M., Braswell, B.H., Walters, B.F., Jenkins, J.C., Brown, S., Salas, W.A., Fore, A., Yu, Y., Nemani, R.R., Ipsan, C., Brown, K.R., 2016. CMS: Forest Carbon Stocks, Emissions, and Net Flux for the Conterminous US: 2005-2010. ORNL DAAC. https://doi.org/10.3334/ORNLDAAC/1313
Acknowledgment
This research is funded by the CMS program and the Terrestrial Ecology program (grant NNN13D455T).
Data Characteristics
Spatial Coverage: Conterminous U.S.
Spatial Resolution: Half-degree
Temporal Coverage: 2001-01-01 to 2016-12-31
Temporal Resolution: Monthly
Study Area: Latitude and longitude are given in decimal degrees.
| Sites | Westernmost Longitude | Easternmost Longitude | Northernmost Latitude | Southernmost Latitude |
|---|---|---|---|---|
| Conterminous U.S. | -130 | -60 | 50 | 25 |
Data File Information
There are 11 data files in netCDF Version 4 (*.nc4) format included with this dataset. The data provide monthly averages and associated uncertainties of carbon pools and fluxes for grid cells in the CONUS region from 2001 to 2016.
Table 1. File names, primary variables, and descriptions.
| File Name | Units | Description | Primary Variables |
|---|---|---|---|
| conus_GPP.nc4 | gC/m2/day | Monthly average of daily gross primary productivity (GPP) | GPP, GPP_uncertainty |
| conus_NBE.nc4 | gC/m2/day | Monthly average of daily net biome exchange (NBE) | NBE, NBE_uncertainty |
| conus_NPP.nc4 | gC/m2/day | Monthly average of daily net primary production (NPP) | NPP, NPP_uncertainty |
| conus_RAU.nc4 | gC/m2/day | Monthly average of daily autotrophic respiration (RA) | Ra, Ra_uncertainty |
| conus_RHE.nc4 | gC/m2/day | Monthly average of daily heterotrophic respiration (RH) | Rh, Rh_uncertainty |
| conus_LAB.nc4 | gC/m2 | Monthly average of labile carbon (C) pool | labileC, labileC_uncertainty |
| conus_FOL.nc4 | gC/m2 | Monthly average of foliar C pool | foliarC, foliarC_uncertainty |
| conus_ROOT.nc4 | gC/m2 | Monthly average of root C pool | rootC, rootC_uncertainty |
| conus_WOOD.nc4 | gC/m2 | Monthly average of woody C pool | woodyC, woodyC_uncertainty |
| conus_LIT.nc4 | gC/m2 | Monthly average of litter C pool | litterC, litterC_uncertainty |
| conus_ SoilC.nc4 | gC/m2 | Monthly average of soil C pool | soilC, soilC_uncertainty |
Data File Details
All files,
- Include an uncertainty variable named from the primary variable and with the same units as the primary variable (e.g., GPP_uncertainty).
- Include the latitude and longitude in decimal degrees, time, and time_bnds (12 months x 16 years = 192).
- Use the no data value -9999.
- Use the CRS WGS84 - World Geodetic System 1984, "WGS84" (EPSG:4326).
Application and Derivation
Spatially explicit representations of carbon pools and fluxes describe the national-level ecosystem processing in a data assimilation model framework with robust uncertainty propagations inherently incorporated in the model. The dataset derived from this study improves the modeling of the climate system interacting with ecosystem processes of carbon, water, and energy exchanges from/to the atmosphere over the region of CONUS.
Quality Assessment
For each 0.5-deg grid cell, the CARDAMOM model was run 4,000 times using the Metropolis-Hastings Markov Chain Monte Carlo simulations, and posterior probability distribution of DALEC2 model parameters was produced constrained by input observations. The uncertainty maps are reported as one standard error based on the calculated posterior probability distributions of model parameters for each grid cell.
The model simulated outputs have been further compared to the existing above and belowground biomass (ABGB) data from the CMS project (Yu et al., 2021) for the overlapped period in 2005, 2010, and 2015 (Fig. 2).
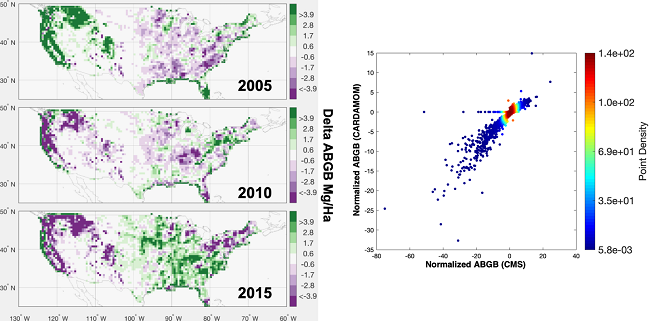
Figure 2. Comparison of ABGB outputs over CONUS derived from CARDAMOM vs. the CMS project-funded ABGB estimated from inventory and satellite data (Yu et al., 2021). The left panel shows the colormaps of differences between ABGB from CARDAMOM and ABGB from CMS for the years 2005, 2010, and 2015. The right panel is the scatter plot showing the pixel-level ABGB deviations from the 1:1 line for CARDAMOM- and CMS-derived outputs.
Data Acquisition, Materials, and Methods
To estimate the ecosystem carbon (C) allocation and attribution to the C exchanges from/to the atmosphere over the CONUS region, data assimilation was performed using the spatially explicit ABGB inputs derived from inventory and satellite data (Yu et al., 2021) to predict and validate the monthly C variations in different C pools, including labile carbon, foliar carbon, fine root, woody carbon, litter carbon and soil organic carbon, and C fluxes, including gross primary production, net primary production, net ecosystem exchange, autotrophic respiration, and heterotrophic respiration. The C state and process variables were determined based on the parameterization of CARDAMOM model (Bloom et al., 2016).
CARDAMOM was used to represent the principal terms and major pathways of the terrestrial C cycle. It optimizes the projected ecosystem state as a function of the initial state, model parameters, and the corresponding meteorological and fire forcing namely monthly temperature, precipitation, global radiation, vapor pressure deficit, and burned area) obtained from the European Centre for Medium-Range Weather Forecasts (ECMWF) Reanalysis Interim (ERA-interim) meteorology and MODIS burned area (Giglio, 2015) at monthly scales.
For each grid cell, the Bayesian inference formulation was used to independently retrieve the optimal distribution of x0 and p given observations O. The observation vector consists of measurements including the MODIS leaf area index (LAI) (Myneni et al., 2015), and ABGB from inventory and satellite data (Yu et al., 2021). To retrieve the posterior probability distribution of outputs given observations O, an adaptive Metropolis-Hastings Markov Chain Monte Carlo (MHMCMC) approach was used following Bloom et al., (2016). Four adaptive MHMCMC chains were run for 100 iterations in each grid cell.
Model Training Data
To generate the spatially explicit ABGB inputs used in the CARDAMOM model, we used asynchronous United States Forest Service's Forest Inventory and Analysis (FIA) samples and satellite data and developed spatially contiguous and temporally consistent annual estimates of AGC stocks in CONUS forestlands for the years 2005, 2010, 2015 and 2016. Asynchronous United States Forest Service's Forest Inventory and Analysis (FIA) samples and satellite data were used to develop a spatially contiguous and temporally consistent annual estimation of the AGC stocks in CONUS forestlands at 1 ha grid cells. Spatially contiguous maps of aboveground carbon (AGC) were harmonized using satellite imagery and non-parametric models based on machine learning algorithms to detect changes at pixel scales and with required uncertainty to improve annual and county scale reporting.
FIA Data
A total of ~127,000 permanent FIA plots with ~500,000 measurements were compiled with measurement dates between 1997 and 2017. Plots with measurement years of 2005, 2010, 2015, and 2016 were used to train models for the prediction of forest AGB for those years, while the overall plot distribution across all years was used to inform the a priori probability of AGB across the landscape over the entire CONUS.
Remote Sensing Data
Remote sensing data were from various sensors:
- Optical data from Thematic Mapper on Landsat 5,
- Operational Land Imager on Landsat 8,
- Moderate Resolution Imaging Spectroradiometer (MODIS) on Aqua,
- Microwave radar measurements from Phased Array type L-band Synthetic Aperture Radar (PALSAR) on Advanced Land Observation Satellite (ALOS) and PALSAR-2 ALOS-2,
- Airborne imagery from National Agriculture Imagery Program (NAIP), and the
- Digital elevation model (DEM) from the Shuttle Radar Topography Mission (SRTM).
Basic data processing was performed on all remote sensing datasets. A gridded baseline map was developed at 100 m spatial resolution (1 ha) in Albers equal-area projection and averaged high-quality measurements from all satellite and airborne products into the same grid cells. NASA SRTM Version 3 data of global surface elevation at 1-arcsec or ~30 m resolution were used to calculate both the average and the standard deviation of elevation at 100 m resolution. ALOS imagery at HH and HV polarizations (Shimada and Ohtaki, 2011) were aggregated from 25 m resolution to 100 m mosaic of the entire CONUS for the period of 2007–2010 and 2015–2016. Refer to Yu et al. (2021) for additional information.
Data Access
These data are available through the Oak Ridge National Laboratory (ORNL) Distributed Active Archive Center (DAAC).
CMS: Terrestrial Carbon Stocks, Emissions, and Fluxes for Conterminous US, 2001-2016
Contact for Data Center Access Information:
- E-mail: uso@daac.ornl.gov
- Telephone: +1 (865) 241-3952
References
Bloom, A.A., J.-F. Exbrayat, I.R. van der Velde, L. Feng, and M. Williams. 2016. The decadal state of the terrestrial carbon cycle: Global retrievals of terrestrial carbon allocation, pools, and residence times. Proceedings of the National Academy of Sciences 113:1285–1290. https://doi.org/10.1073/pnas.1515160113
Giglio, L., 2015. MODIS Collection 6 Active Fire Product User’s Guide. Accessed 8.28.16. http://modis-fire.umd.edu/files/MODIS_C6_Fire_User_Guide_A.pdf
Myneni, R., Y. Knyazikhin, and T. Park. 2015. MOD15A2H MODIS/terra leaf area index/FPAR 8-day L4 global 500 m SIN grid V006. NASA EOSDIS Land Process DAAC. https://lpdaac.usgs.gov/products/mod15a2hv006/
Shimada, M., and T. Ohtaki. 2010. Generating Large-Scale High-Quality SAR Mosaic Datasets: Application to PALSAR Data for Global Monitoring. IEEE Journal of Selected Topics in Applied Earth Observations and Remote Sensing 3:637–656. https://doi.org/10.1109/JSTARS.2010.2077619
U.S. Forest Service. Forest Inventory and Analysis (FIA). https://www.fia.fs.fed.us/tools-data/index.php
Yu, Y., S. Saatchi, G.M. Domke, B. Walters, C. Woodall, S. Ganguly, S. Li, S. Kalia, T. Park, R. Nemani, S.C. Hagen, and L. Melendy. 2021. Making the US National Forest Inventory Spatially Contiguous and Temporally Consistent. In Review at Environmental Research Letters.