Documentation Revision Date: 2021-07-21
Dataset Version: 1
Summary
The CLM5-DART (CLM5 with Data Assimilation Research Testbed) land surface data assimilation system was run with an ensemble spread induced from 80 members of meteorological forcing from the Community Atmosphere Model (CAM4) (Raeder et al., 2012). The ensemble spread provided a means to assess uncertainty for the biomass stock and carbon exchange estimates. The simulated carbon fluxes (i.e., net ecosystem production, gross primary production, and ecosystem respiration) were compared against independent estimates of regional carbon flux from FLUXCOM (Jung et al., 2020).
There are 312 data files in netCDF-4 (*.nc4) format.
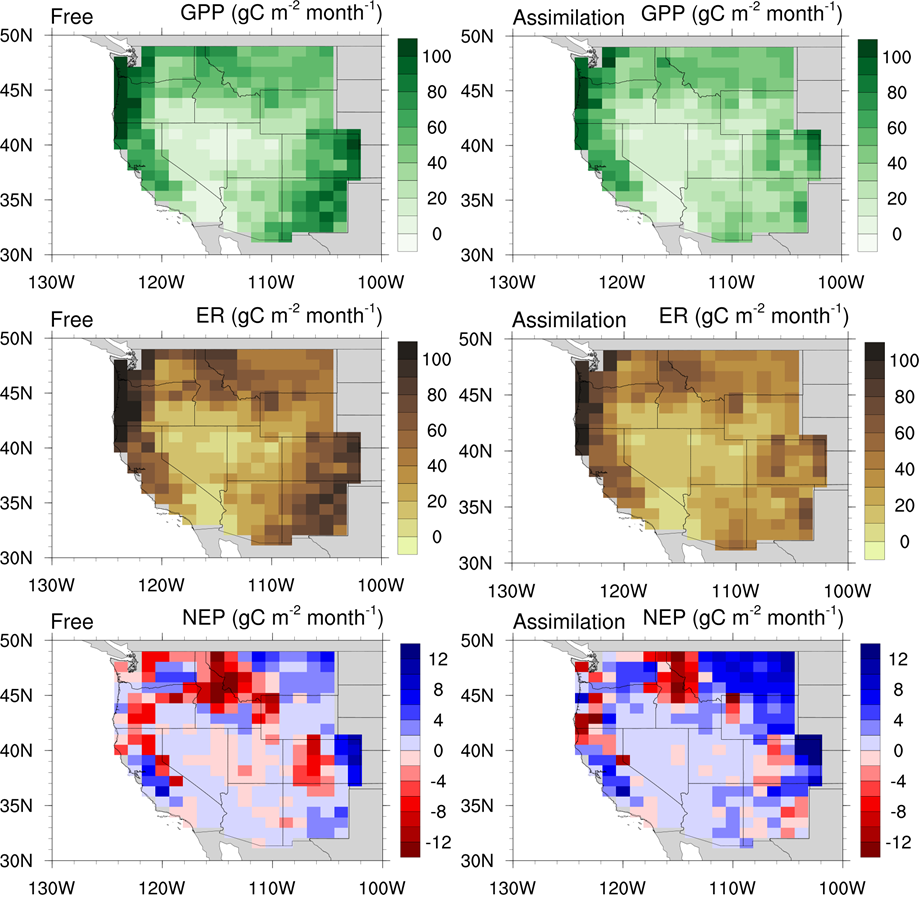
Figure 1. Ensemble average estimates for gross primary productivity (GPP), ecosystem respiration (ER), and net ecosystem production (NEP). "Free" simulations (left column) used meteorology inputs with unconstrained vegetation states while the CLM5-DART "assimilation" runs (right column) were constrained by remotely sensed measures of leaf area index and aboveground biomass. Source: Raczka et al. (2021)
Citation
Raczka, B.M., T.J. Hoar, H.F. Duarte, A.M. Fox, J.L. Anderson, D.R. Bowling, and J.C. Lin. 2021. CLM5-DART Regional Carbon Fluxes and Stocks over the Western US, 1998-2010. ORNL DAAC, Oak Ridge, Tennessee, USA. https://doi.org/10.3334/ORNLDAAC/1856
Table of Contents
- Dataset Overview
- Data Characteristics
- Application and Derivation
- Quality Assessment
- Data Acquisition, Materials, and Methods
- Data Access
- References
Dataset Overview
This dataset provides monthly estimates of biomass stocks and land-atmosphere carbon exchange across the western United States at 0.95 degrees longitude x 1.25 degrees latitude grid resolution from 1998 through 2010. The data include outputs from two types of model simulations: (1) a "free" simulation which used Community Land Model (CLM version 5.0) simulations forced with meteorology appropriate for complex mountainous terrain, and (2) "assimilation" runs using the land surface data assimilation system (CLM5-DART). In assimilation runs, the CLM5 vegetation state is constrained by remotely sensed observations of leaf area index and aboveground biomass, which influenced biomass stocks and carbon fluxes.
The CLM5-DART (CLM5 with Data Assimilation Research Testbed) land surface data assimilation system was run with an ensemble spread induced from 80 members of meteorological forcing from the Community Atmosphere Model (CAM4) (Raeder et al., 2012). The ensemble spread provided a means to assess uncertainty for the biomass stock and carbon exchange estimates. The simulated carbon fluxes (i.e., net ecosystem production, gross primary production, and ecosystem respiration) were compared against independent estimates of regional carbon flux from FLUXCOM (Jung et al., 2020).
Project: Carbon Monitoring System
The NASA Carbon Monitoring System (CMS) program is designed to make significant contributions in characterizing, quantifying, understanding, and predicting the evolution of global carbon sources and sinks through improved monitoring of carbon stocks and fluxes. The System uses NASA satellite observations and modeling/analysis capabilities to establish the accuracy, quantitative uncertainties, and utility of products for supporting national and international policy, regulatory, and management activities. CMS data products are designed to inform near-term policy development and planning.
Related Publications
Raczka, B., T.J. Hoar, H.F. Duarte, A.M. Fox, J.L. Anderson, D.R. Bowling, and J.C. Lin. 2021. Improving CLM5.0 biomass and carbon exchange across the western US using a data assimilation system. Journal of Advances in Modeling Earth Systems. https://doi.org/10.1029/2020MS002421
Related Datasets
Hagen, S., N. Harris, S.S. Saatchi, T. Pearson, C.W. Woodall, S. Ganguly, G.M. Domke, B.H. Braswell, B.F. Walters, J.C. Jenkins, S. Brown, W.A. Salas, A. Fore, Y. Yu, R.R. Nemani, C. Ipsan, and K.R. Brown. 2016. CMS: Forest Carbon Stocks, Emissions, and Net Flux for the Conterminous US: 2005-2010. ORNL DAAC, Oak Ridge, Tennessee, USA. https://doi.org/10.3334/ORNLDAAC/1313.
Joiner, J., and Y. Yoshida. 2021. Global MODIS and FLUXNET-derived Daily Gross Primary Production, V2. ORNL DAAC, Oak Ridge, Tennessee, USA. https://doi.org/10.3334/ORNLDAAC/1835.
Zhou, Y., C.A. Williams, T. Lauvaux, S. Feng, I.T. Baker, Y. Wei, A.S. Denning, K. Keller, and K.J. Davis. 2019. ACT-America: Gridded Ensembles of Surface Biogenic Carbon Fluxes, 2003-2019. ORNL DAAC, Oak Ridge, Tennessee, USA. https://doi.org/10.3334/ORNLDAAC/1675.
Acknowledgments
This project received funding from NASA’s Carbon Monitoring System (grants NNX16AP33G, 80NSSC20K0010).
Data Characteristics
Spatial Coverage: Western United States
Spatial Resolution: 0.95 to 1.25 degrees
Temporal Coverage: 1998-01-01 to 2010-12-31
Temporal Resolution: Monthly
Study Area: All latitudes and longitudes given in decimal degrees
| Site | Westernmost Longitude | Easternmost Longitude | Northernmost Latitude | Southernmost Latitude |
|---|---|---|---|---|
| Western United States | -130.625 | -99.375 | 50.891 | 25.445 |
Data File Information
There are 312 data files in netCDF-4 (*.nc4) format. The files contain raster grids in geographic coordinates. Note that peripheral cells outside of the modeled area were filled with missing values (-9999). Details about the CLM5-DART model runs can be found in the global attributes saved in the netCDFs.
The naming convention is clm5_XXXXX_ensemble_YYYY-MM.nc4, where XXXX indicates the type of simulation (i.e., “assim” or “free”), YYYY = year, and MM = month. The “clm5” refers to the CLM5.0 model “ensemble” runs (n=80) per month.
Data File Details
Table 1. Variable names and descriptions for the model output files. See Lawrence et al. (2019) for technical descriptions.
| Variable | Dimensions | Units | Description |
|---|---|---|---|
| BTRAN2 | lon, lat, ensemble | 1 | root zone soil wetness factor |
| BTRANMN | lon, lat, ensemble | 1 | daily minimum of transpiration beta factor |
| CPOOL | lon, lat, ensemble | g m-2 | temporary photosynthate C pool |
| DEADCROOTC | lon, lat, ensemble | g m-2 | structural carbon, not biologically active, within roots |
| DEADCROOTN | lon, lat, ensemble | g m-2 | non-biologically active nitrogen content of coarse roots |
| DEADSTEMC | lon, lat, ensemble | g m-2 | dead stem C |
| DEADSTEMN | lon, lat, ensemble | g m-2 | dead stem N |
| EFLX_LH_TOT | lon, lat, ensemble | W m-2 | total latent heat flux [+ to atmosphere] |
| ER | lon, lat, ensemble | g m-2 s-1 | total ecosystem respiration, autotrophic + heterotrophic, in grams carbon |
| FROOTC | lon, lat, ensemble | g m-2 | biologically active carbon content of fine roots |
| FROOTN | lon, lat, ensemble | g m-2 | biologically active nitrogen content of fine roots |
| FSH | lon, lat, ensemble | W m-2 | sensible heat not including correction for land-use change and rain/snow conversion |
| FSIF | lon, lat, ensemble | W m-2 | solar-induced fluorescence |
| GPP | lon, lat, ensemble | g m-2 s-1 | gross primary production in grams carbon |
| H2OSNO | lon, lat, ensemble | mm | snow depth (liquid water) |
| H2OSOI | lon, lat, levsoi, ensemble | g cm-3 | volumetric soil water (vegetated land units only) |
| HR | lon, lat, ensemble | g m-2 s-1 | total heterotrophic respiration in grams carbon |
| HTOP | lon, lat, ensemble | m | canopy top |
| LEAFC | lon, lat, ensemble | g m-2 | leaf C |
| LEAFN | lon, lat, ensemble | g m-2 | leaf N |
| LITR1C_vr | lon, lat, levsoi, ensemble | g m-2 | litter 1 C (vertically resolved) |
| LITR1N_vr | lon, lat, levdcmp, ensemble | g m-2 | litter 1 N (vertically resolved) |
| LITR2C_vr | lon, lat, levsoi, ensemble | g m-2 | litter 2 C (vertically resolved) |
| LITR2N_vr | lon, lat, levdcmp, ensemble | g m-2 | litter 2 N (vertically resolved) |
| LITR3C_vr | lon, lat, levsoi, ensemble | g m-2 | litter 3 C (vertically resolved) |
| LITR3N_vr | lon, lat, levdcmp, ensemble | g m-2 | litter 3 N (vertically resolved) |
| LIVECROOTC | lon, lat, ensemble | g m-2 | biologically active carbon content of coarse roots |
| LIVECROOTN | lon, lat, ensemble | g m-2 | biologically active nitrogen content of coarse roots |
| LIVESTEMC | lon, lat, ensemble | g m-2 | live stem C |
| LIVESTEMN | lon, lat, ensemble | g m-2 | live stem N |
| NEP | lon, lat, ensemble | g m-2 s-1 | net ecosystem production in g C, excludes fire, land use, and harvest flux, positive for sink |
| NPOOL | lon, lat, ensemble | g m-2 | temporary plant N pool |
| Q2M | lon, lat, ensemble | 1 | 2-m specific humidity |
| QDRAI | lon, lat, ensemble | mm s-1 | sub-surface drainage |
| QINFL | lon, lat, ensemble | mm s-1 | infiltration (=precipitation -runoff -evaporation from canopy) |
| QRUNOFF | lon, lat, ensemble | mm s-1 | total liquid runoff not including correction for land-use change |
| QSOIL | lon, lat, ensemble | mm s-1 | ground evaporation (soil/snow evaporation + soil/snow sublimation - dew) |
| QVEGE | lon, lat, ensemble | mm s-1 | canopy evaporation |
| QVEGT | lon, lat, ensemble | mm s-1 | canopy transpiration |
| RAIN | lon, lat, ensemble | mm s-1 | atmospheric rain, after rain/snow repartitioning based on temperature |
| RH2M | lon, lat, ensemble | percent | relative humidity at 2 m |
| SNOW | lon, lat, ensemble | mm s-1 | atmospheric snow, after rain/snow repartitioning based on temperature |
| SNOWDP | lon, lat, ensemble | m | mean snow height in grid cell |
| SNOWLIQ | lon, lat, ensemble | kg m-2 | snow liquid water |
| SOIL1C_vr | lon, lat, levsoi, ensemble | g m-3 | soil 1 C (vertically resolved) |
| SOIL1N_vr | lon, lat, levdcmp, ensemble | g m-3 | soil 1 N (vertically resolved) |
| SOIL2C_vr | lon, lat, levsoi, ensemble | g m-3 | soil 2 C (vertically resolved) |
| SOIL2N_vr | lon, lat, levdcmp, ensemble | g m-3 | soil 2 N (vertically resolved) |
| SOIL3C_vr | lon, lat, levsoi, ensemble | g m-3 | soil 3 C (vertically resolved) |
| SOIL3N_vr | lon, lat, levdcmp, ensemble | g m-3 | soil 3 N (vertically resolved) |
| SOILLIQ | lon, lat, levsoi, ensemble | kg m-2 | soil liquid water (vegetated land units only) |
| TG | lon, lat, ensemble | K | ground temperature |
| TLAI | lon, lat, ensemble | 1 | total projected leaf area index |
| TSA | lon, lat, ensemble | K | 2 m air temperature |
| TSOI | lon, lat, levgrnd, ensemble | K | soil temperature (vegetated land units only) |
| TSOI_10CM | lon, lat, ensemble | K | soil temperature in top 10cm of soil |
| TV | lon, lat, ensemble | K | vegetation temperature |
| landfrac | lon, lat | 1 | land fraction |
Table 2. Variables associated with file dimensions in the model output files. See Lawrence et al. (2019) for technical descriptions.
| Variable | Units | Description |
|---|---|---|
| lat | degree_north | coordinate latitude (n = 27) |
| lon | degree_east | coordinate longitude (n = 25) |
| ensemble | 1 | ensemble number (n = 80) |
| levdcmp | m | coordinate soil levels (n = 25) |
| levgrnd | m | coordinate soil levels (n = 25) |
| levlak | m | coordinate lake levels (n = 10) |
Application and Derivation
Biomass stocks, soil carbon, and carbon fluxes are difficult to monitor in complex, mountainous terrain. The CLM5 land surface biosphere model was forced with a bias-corrected meteorological dataset designed for complex terrain. CLM5 estimates key carbon and flux variables by representing important earth system processes. All models are subject to deviation from reality; therefore, the data assimilation system DART, was used to nudge the modeled vegetation closer to observed vegetation states (Fig. 2). In this case, remotely sensed leaf area index observations (Zhu et al., 2013) and aboveground biomass (Liu et al., 2015) constrained the CLM simulation. This approach improved the vegetation state's representation along with the associated carbon, water, and nitrogen cycling. This dataset includes both the unconstrained simulations (“free”) and the simulations constrained by remotely sensed vegetation states (“assim”).
Quality Assessment
The CLM5-DART carbon flux simulations were compared to FLUXCOM (Jung et al., 2020), an independent estimate of carbon flux. CLM5-DART is a mechanistic approach that represents vegetation states with biomass and leaf area index (LAI) observations to account for disturbances and land-use history. In contrast, FLUXCOM is a more empirical machine learning approach that relies primarily on flux tower observations to represent regional carbon fluxes.
In the simulations without vegetation constraints ("free"), CLM5-DART and FLUXCOM predicted similar levels of ecosystem respiration across the western U.S. However, estimates of gross primary production (GPP) were lower for CLM5-DART (38.5 g C m-2) than FLUXCOM (43.6 g C m-2). Across the region, FLUXCOM predicted a stronger carbon sink (8 g C m-2) than CLM5-DART (1.3 g C m-2). The vegetation-constrained assimilation model ("assim") had a greater agreement with FLUXCOM estimates; however, regional differences persisted. The greatest difference was in mountainous terrain where CLM5-DART predicted near-neutral carbon exchange while FLUXCOM predicted strong carbon update and storage (Raczka et al., 2021).
Data Acquisition, Materials, and Methods
All simulations were performed within 11 states of the western U.S., with the model domain defined between the U.S. borders with Mexico and Canada, and between the Pacific Ocean and the eastern edge of Colorado within 49.00oN–31.30oN and 124.40oW–102.05oW (Fig. 1).
Estimates of biomass stocks and land-atmosphere carbon exchange were derived from the terrestrial biosphere Community Land Model (CLM5) (CLM version 5.0, Lawrence et al., 2019) across the western United States from 1998–2011. CLM5 is a mechanistic terrestrial biosphere model that can assimilate observational data (e.g., meteorology, vegetation states) to adjust model predictions to better match real-world states and dynamics (Fig. 2). CLM5-DART assimilates observational data using the Data Assimilation Research Testbed (DART; Anderson et al., 2009).
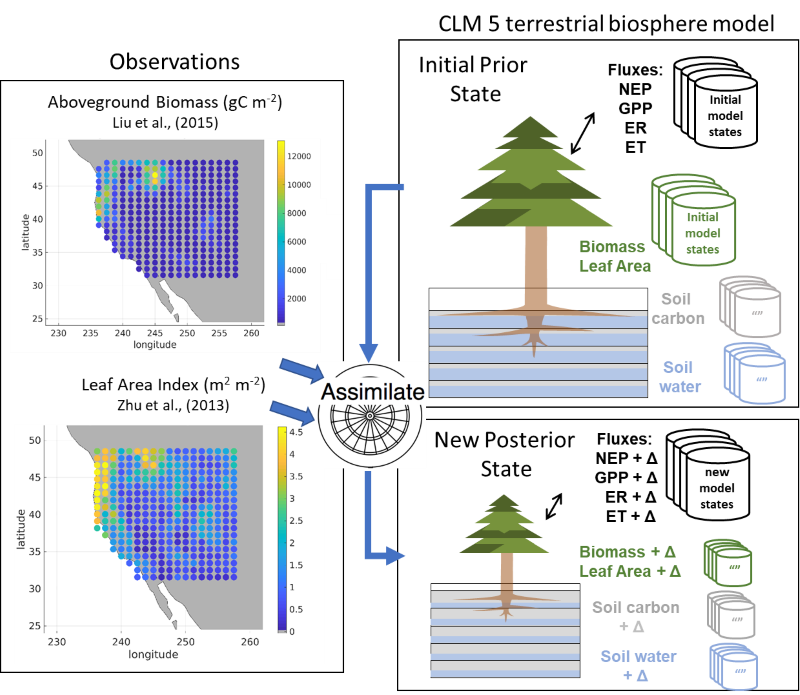
Figure 2. An overview of the assimilation system (CLM5-DART) that combines observations with model ensemble simulations from CLM5.0. Satellite-derived observations of aboveground biomass and leaf area index were used to adjust the simulated model state of CLM5.0. Source: Razcka et al. (2021)
This dataset includes outputs from two types of CLM5 model simulations. The first type was a "free" simulation which was forced with meteorology (Buotte et al., 2019) specifically designed to be run across complex, mountainous terrain. These simulations allowed land surface vegetation states to freely vary as modified by model dynamics. The second type of simulation was "assimilation" runs using the land surface data assimilation system (CLM5-DART). In these assimilation runs, the CLM5 vegetation state was constrained by remotely sensed leaf area index observations (Zhu et al., 2013) and aboveground biomass (Liu et al., 2015). These constraints influenced both the biomass stocks and carbon flux characteristics.
The CLM5-DART assimilation system was run with 80 ensemble members in which the ensemble spread is induced by meteorological forcing from the Community Atmosphere Model (CAM4) (Raeder et al., 2012). Variation among ensemble members provided a means to assess uncertainty for the biomass stock and carbon exchange estimates. The simulated carbon fluxes from CLM5-DART (net ecosystem production, gross primary production, and ecosystem respiration) were compared against an independent estimate of regional carbon flux from FLUXCOM (Jung et al., 2020).
More details about the methods can be found within Raczka et al. (2021).
Data Access
These data are available through the Oak Ridge National Laboratory (ORNL) Distributed Active Archive Center (DAAC).
CLM5-DART Regional Carbon Fluxes and Stocks over the Western US, 1998-2010
Contact for Data Center Access Information:
- E-mail: uso@daac.ornl.gov
- Telephone: +1 (865) 241-3952
References
Anderson, J., T. Hoar, K. Raeder, H. Liu, N. Collins, R. Torn, and A. Avellano. 2009. The Data Assimilation Research Testbed: a community facility. Bulletin of the American Meteorological Society 90:1283–1296. https://doi.org/10.1175/2009BAMS2618.1.
Buotte, P.C., S. Levis, B.E. Law, T.W. Hudiburg, D.E. Rupp, and J.J. Kent. 2019. Near-future forest vulnerability to drought and fire varies across the western United States. Global Change Biology 25:290–303. https://doi.org/10.1111/gcb.14490.
Jung, M., C. Schwalm, M. Migliavacca, S. Walther, G. Camps-Valls, S. Koirala, P. Anthoni, S. Besnard, P. Bodesheim, N. Carvalhais, F. Chevallier, F. Gans, D.S. Goll, V. Haverd, P. Köhler, K. Ichii, A.K. Jain, J. Liu, D. Lombardozzi, J.E.M.S. Nabel, J.A. Nelson, M. O'Sullivan, M. Pallandt, D. Papale, W. Peters, J. Pongratz, C. Rödenbeck, S. Sitch, G. Tramontana, A. Walker, U. Weber, and M. Reichstein. 2020. Scaling carbon fluxes from eddy covariance sites to globe: synthesis and evaluation of the FLUXCOM approach. Biogeosciences 17:1343–1365. https://doi.org/10.5194/bg-17-1343-2020.
Lawrence, D.M., R.A. Fisher, C.D. Koven, K.W. Oleson, S.C. Swenson, G. Bonan, N. Collier, B. Ghimire, L. van Kampenhout, D. Kennedy, E. Kluzek, P.J. Lawrence, F. Li, H. Li, D. Lombardozzi, W.J. Riley, W.J. Sacks, M. Shi, M. Vertenstein, W.R. Wieder, C. Xu, A.A. Ali, A.M. Badger, G. Bisht, M. van den Broeke, M.A. Brunke, S.P. Burns, J. Buzan, M. Clark, A. Craig, K. Dahlin, B. Drewniak, J.B. Fisher, M. Flanner, A.M. Fox, P. Gentine, F. Hoffman, G. Keppelaleks, R. Knox, S. Kumar, J. Lenaerts, L.R. Leung, W.H. Lipscomb, Y. Lu, A. Pandey, J.D. Pelletier, J. Perket, J.T. Randerson, D.M. Ricciuto, B.M. Sanderson, A. Slater, Z.M. Subin, J. Tang, R.Q. Thomas, M. Val Martin, and X. Zeng. 2019. The Community Land Model Version 5: description of new features, benchmarking, and impact of forcing uncertainty. Journal of Advances in Modeling Earth Systems, 11(12), 4245–4287. https://doi.org/10.1029/2018MS001583.
Liu, M., H. He, X. Ren, X. Sun, G. Yu, S. Han, H. Wang, and G. Zhou. 2015. The effects of constraining variables on parameter optimization in carbon and water flux modeling over different forest ecosystems. Ecological Modelling 303:30–41. https://doi.org/10.1016/j.ecolmodel.2015.01.027.
Raczka, B., T.J. Hoar, H.F. Duarte, A.M. Fox, J.L. Anderson, D.R. Bowling, and J.C. Lin. 2021. Improving CLM5.0 biomass and carbon exchange across the western US using a data assimilation system. Journal of Advances in Modeling Earth Systems. https://doi.org/10.1029/2020MS002421
Raeder, K., J.L. Anderson, N. Collins, T.J. Hoar, J E. Kay, P H. Lauritzen, and R. Pincus, R. 2012. DART/CAM: an ensemble data assimilation system for CESM atmospheric models. Journal of Climate 25:6304–6317. https://doi.org/10.1175/JCLI-D-11-00395.1.
Zhu, Z., J. Bi, Y. Pan, S. Ganguly, A. Anav, L. Xu, A. Samanta, S. Piao, R. R. Nemani, and R. B. Myneni. 2013. Global data sets of vegetation leaf area index (LAI)3g and fraction of photosynthetically active radiation (FPAR)3g derived from Global Inventory Modeling and Mapping Studies (GIMMS) Normalized Difference Vegetation Index (NDVI3g) for the period 1981 to 2011. Remote Sensing 5:927–948. https://doi.org/10.3390/rs5020927.