Documentation Revision Date: 2015-11-30
Summary
The study site was located in El Mogor, in the Valle de Guadalupe, Baja California, Mexico. The sampling area was 100 x 50-m with 50 sampling points at intervals ranging between 5 and 10 m. The enhanced vegetation index (EVI) was also derived for a 2 x 2-km area centered on the study site from the MODIS Land Product Subsets (MOD13Q1) to supplement the monthly measurements of vegetation dynamics.
There are three comma-separated data files (*.csv); one for monthly data, one for the seasonal measurements, and one with monthly EVI data. A shapefile (.shp) with the sampling points and seasonal data as attributes is included.
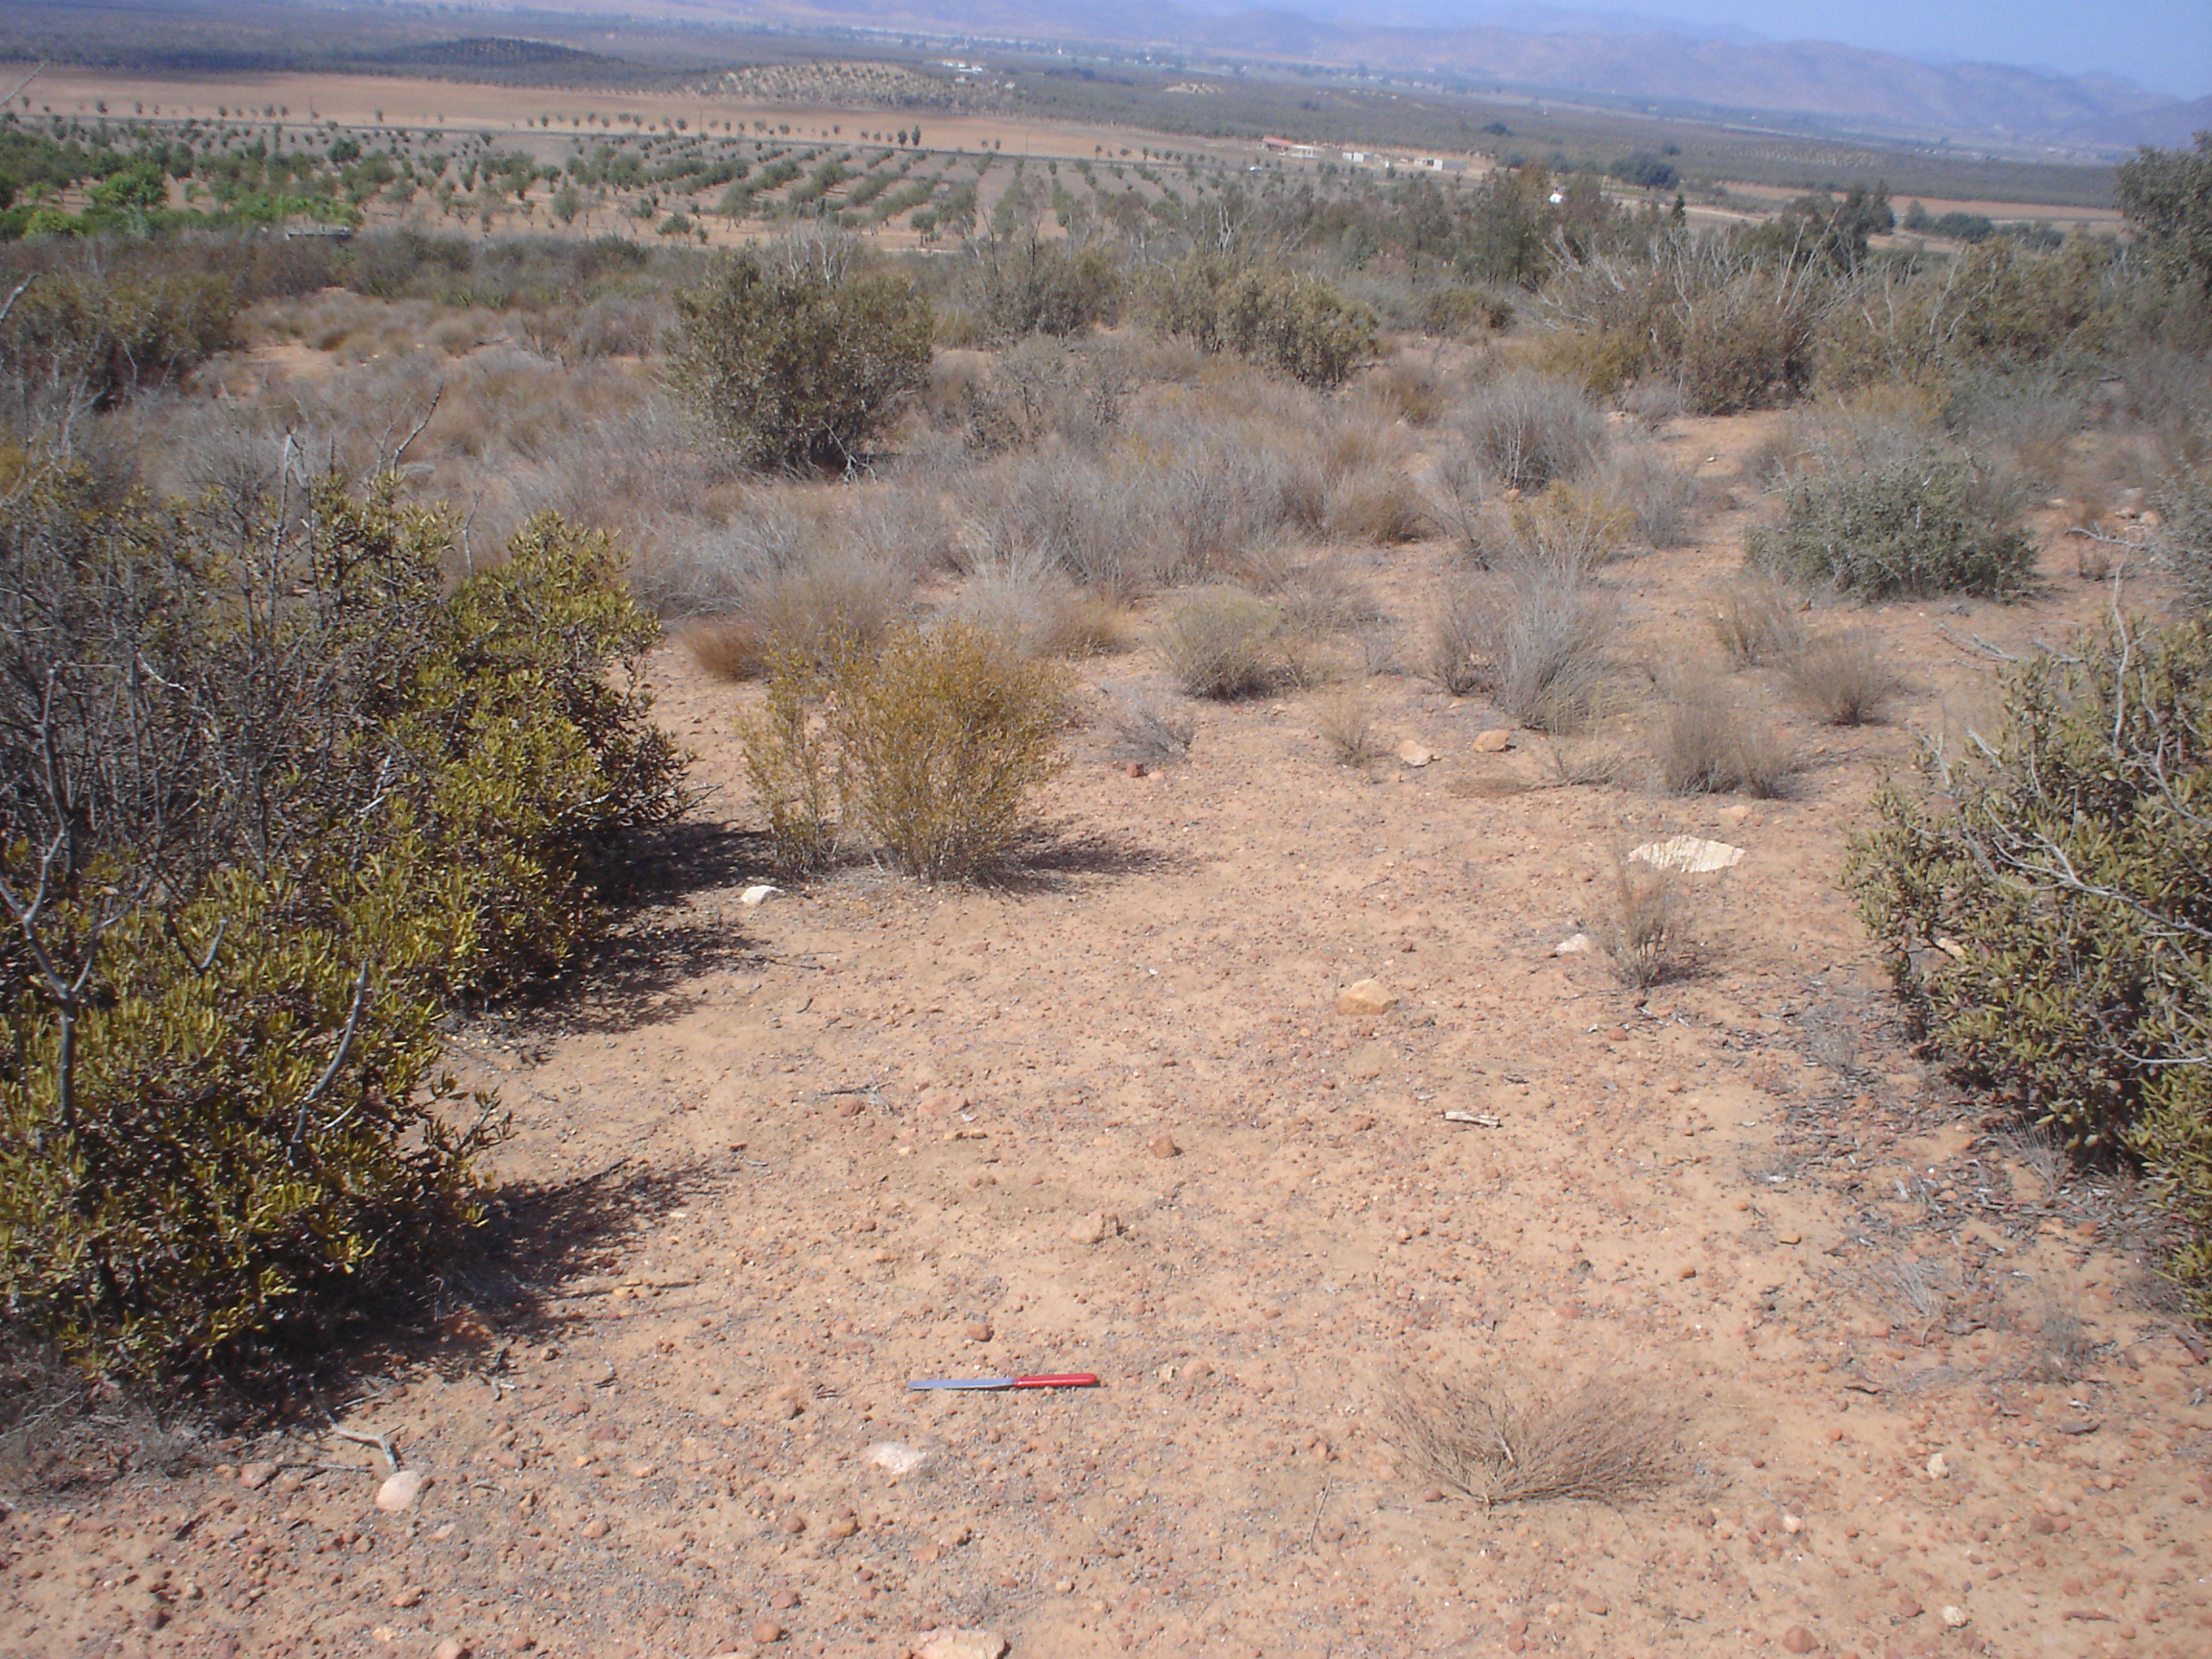
Figure 1. El Mogor, in the Valle de Guadalupe, Baja California, Mexico.
Citation
Vargas, R., and E. Leon. 2015. CMS: Soil CO2 Efflux and Properties, Site Vegetation Measurements, Mexico, 2011-2012. ORNL DAAC, Oak Ridge, Tennessee, USA. http://dx.doi.org/10.3334/ORNLDAAC/1298
Table of Contents
- Data Set Overview
- Data Characteristics
- Application and Derivation
- Quality Assessment
- Data Acquisition, Materials, and Methods
- Data Access
- References
Data Set Overview
Project: Carbon Monitoring System (CMS)
Investigators: Elievf Leon, Rodrigo Vargas, Stephen Bullock, Eulogio Lopez, Alan Rodrigo Panosso, and Newton La Scala Jr.
The CMS is designed to make significant contributions in characterizing, quantifying, understanding, and predicting the evolution of global carbon sources and sinks through improved monitoring of carbon stocks and fluxes. The System will use the full range of NASA satellite observations and modeling/analysis capabilities to establish the accuracy, quantitative uncertainties, and utility of products for supporting national and international policy, regulatory, and management activities. CMS will maintain a global emphasis while providing finer scale regional information, utilizing space-based and surface-based data.
This data set provides monthly measurements of soil CO2 efflux, volumetric water content (5 cm), porosity, density, temperature, nitrogen (N), and carbon (C) content, leaf area index (LAI), belowground fine root measurements, and litter biomass measurements.
The study site was located in El Mogor, in the Valle de Guadalupe, Baja California, Mexico. The sampling area was 100 x 50-m with 50 sampling points at intervals ranging between 5 and 10 m. The enhanced vegetation index (EVI) was also derived for a 2 x 2-km area centered on the study site from the MODIS Land Product Subsets (MOD13Q1) to supplement the monthly measurements of vegetation dynamics.
Data Characteristics
Spatial Data
Spatial Coverage
A 100 x 50-m sampling area at El Mogor, in the Valle de Guadalupe, Baja California, Mexico
Spatial resolution
The sampling area was 100 x 50-m with 50 survey points at intervals ranging between 5 and 10 m.
Temporal Coverage
Plant litter and soil samples were collected at the end of the dry season (September 2011) and at the middle of the wet season (February 2012); LAI measurements were also made during those two months in 2011 and 2012. Soil CO2 efflux, volumetric water content, and temperature were measured monthly between September 2011 and August 2012.
Temporal resolution
Monthly
Study Area (All latitudes and longitudes are given in decimal degrees)
| Study Area | Westernmost Longitude | Easternmost Longitude | Northernmost Latitude | Southernmost Latitude | Ground Elevation above Sea Level (m) |
|---|---|---|---|---|---|
| El Mogor, in the Valle de Guadalupe, Baja California, Mexico | -116.60505 | -116.60405 | 32.030134 | 32.0294 | 406 |
Data File Information
There are three comma-separated data files (.csv) and one shapefile (.shp) with this data set:
CMS_soil_co2_efflux_monthly.csv
CMS_soil_co2_efflux_seasonal.csv
CMS_EVI_data.csv
CMS_soil_co2_efflux_seasonal.zip
Table 1. File description for CMS_soil_co2_efflux_monthly.csv
The data are monthly measurements made at the 50 points during and between September 2011 and August, 2012. pH was only measured in September 2011.
| Column | Descriptions | Units/Format |
|---|---|---|
| ID | Location ID | Text |
| X_coor | X coordinate in Universal Transversal Mercator projection | Meters |
| Y_coor | Y coordinate in Universal Transversal Mercator projection | Meters |
| Z_utm | Universal Transversal Mercator (UTM) projection zone in the North=11 | Numeric |
| Datum | The Datum is WGS84 | Text |
| Year | Year of measurements | yyyy |
| Month | Month of measurements | mm |
| SVWC | Soil volumetric water content (5 cm) | m3 m-3 |
| FCO_2 | Soil CO2 efflux | mol m-2 s-1 |
| Ts | Soil temperature (10 cm) | Degrees C |
| Soil_pH | Soil pH measurements made one time during the study at each of the 50 locations. The measurements were taken September 2011 | Numeric |
Table 2. File description for CMS_soil_co2_efflux_seasonal.csv
The data are for measurements made at the 50 points during the months of September 2011 and February 2012.
Missing data or data not provided are represented as -9999. pH was only measured in September 2011.
| Column | Descriptions | Units/Format |
|---|---|---|
| ID | Location ID | text |
| X_coor | X coordinate in Universal Transversal Mercator (UTM) projection | m |
| Y_coor | Y coordinate in UTM projection | m |
| Z_utm | UTM zone (North) | numeric |
| Datum | World Geodetic System 1984 (WGS84) | text |
| Year | Year of measurement | yyyy |
| Month | Month of measurement | mm |
| RootBio | Root biomass (0-10 cm) | g m-2 |
| SVWC | Soil volumetric water content (5 cm) | m3 m-3 |
| FCO_2 | Soil CO2 efflux | mol m-2 s-1 |
| Ts | Soil temperature (10 cm) | degrees C |
| SoilDens | Soil density | g m-3 |
| LAI | Leaf Area Index | numeric |
| SoilPoro | Soil Porosity | percent |
| Litter | Litter biomass | g m-2 |
| Soil_N | Percentage of N in soil. Collected only in February and is assumed to be the same for September | percent |
| Soil_C | Percentage of C in soil. Collected only in February and is assumed to be the same for September | percent |
| Soil_pH | Soil pH measurements made one time during the study at each of the 50 locations. The measurements were taken September 2011 | Numeric |
Table 3. File description for CMS_EVI_data
| Column | Descriptions | Units/format |
|---|---|---|
| Year | Year of measurements | yyyy |
| Month | Month of measurements | mm |
| EVI_Ave | Enhanced Vegetation Index from MODIS products (MOD13Q1) Monthly average (This product is acquired two times by month and the number is the average of these two measurements). | Numeric |
| EVI_SD | Enhanced Vegetation Index from MODIS products (MOD13Q1) Standar deviation (The number is the estándar deviation of EVI_Ave). | Numeric |
Shapefile description: CMS_soil_co2_efflux_seasonal.zip
This shapefile contains five files (*.shx, *.dbf, *.prj, *.sbx, and *.shp).
Extent:
Top: 32.030134
Bottom: 32.0294
Left: -116.605051
Right: -116.604048
Parameters of the shapefile:
Geometry Type: Point
Projection:
Transverse_Mercator
Projected Coordinate System: UTM_Zone_11N
Geographic Coordinate System: GCS_WGS_1984
Datum: D_WGS_1984
Prime Meridian: Greenwich
False Easting: 500000.00000000
False_Northing: 0.00000000
Central_Meridian: -117.00000000
Scale_Factor: 0.99960000
Latitude_Of_Origin: 0.00000000
Angular Unit: Degree
Linear unit: Meter
Attributes:
FID: Internal feature number; sequential unique whole numbers that are automatically generated. Sampling points and seasonal data are included as attributes.
Shape: Feature geometry
Application and Derivation
This study adds to the increasing evidence that soil CO2 efflux dynamics in water-limited ecosystems are more complex than previously thought (when compared to temperate ecosystems), and require a better understanding to accurately represent them in global change models.
Quality Assessment
It is likely that higher spatial resolution is needed for previously observed controls of soil CO2 efflux such as: soil texture (Cable et al., 2008), different soil organic matter fractions (Almagro et al., 2013), soluble carbon pools (Scott-Denton et al., 2003), and litter decomposition rates (Stoyan et al., 2000).
Data Acquisition, Materials, and Methods
The study site is located at 406 m.a.s.l. in the Valle de Guadalupe, Baja California, Mexico and has a semiarid Mediterranean climate, with warm-dry summers and cool-wet winters. The mean annual temperature is 17 degrees C and mean annual precipitation is 309 mm (average of years 1980-2009). Rainfall typically occurs during the cool-wet winters (November-April) with mean monthly temperatures of 11-14 degrees C and monthly precipitation of 18-63 mm. Meanwhile, the warm-dry months (May-October) have mean monthly temperatures of 16-21 degrees C and monthly precipitation of 1-6 mm. Soils are shallow (approximately 30 cm of depth) and developed from granitic parent material. Soil texture is sandy loam (75% sand,14% silt, and 11% clay).
Vegetation at El Mogor is characterized by a mixture of chaparral and less-sclerophyllous species with a mean height of 1 m. The species with the greatest ground cover at the study site include Adenostoma fasiculatum, Ornithostaphylos oppositifolia, Cneoridium dumosum, Salvia apiana, and Lotus scoparius.
Sampling area
A 100 x 50-m sampling area was established within a representative location of the ecosystem in September 2011. Fifty survey points were marked within the 0.5-ha grid with intervals ranging between 5 and 10 m. At each of these points, litter, soil samples, and fine roots (<5 mm) were collected, and soil temperature and moisture, soil CO2 efflux, and leaf area index (LAI) were measured.
Belowground biomass and soil analyses
Plant litter and soil samples were collected at the end of the dry season (September 2011) and at the middle of the wet season (February 2012). Samples were taken within a 20-cm radius of the soil CO2 collars at each one of the 50 survey points (Leon et al., 2014).
- First, plant litter was collected from 30-cm2 micro-plots. Litter was cleaned by hand to remove small rocks and soil aggregates, and the clean litter samples were oven dried (65 degrees C for 48 h) to calculate total litter biomass.
- After removing the litter, soil samples were taken with a soil core (8 cm diameter) to a depth of 10 cm (502.6 cm3).
- Soil samples were transported to the laboratory and
- first analyzed for soil density and pH.
- Soil samples were ground to pass through a 250-mm sieve, and analyzed via dry combustion for total carbon and nitrogen using a Thermo Finnigan Flash EA1112 N/C analyzer (Thermo Scientific, USA).
- A second set of soil samples were air-dried, sieved through a 2-mm mesh, and all fine roots (dead and alive) were hand-picked from the sieved soil and the sieve using forceps.
- The largest fine roots had a diameter of 5 mm, however, over 90% of them were <2 mm in diameter.
- Fine roots were washed with deionized water to clean attached soil and then oven dried (65 degrees C for 48 h) to determine the dry weight.
- Soil samples were transported to the laboratory and
Soil CO2 efflux, volumetric water content, and temperature measurements
Soil CO2 efflux was measured monthly at the 50 sampling points using a LI-8100 (Licor, Lincoln, NE) and a 10-cm survey chamber (model 8100-102; using 10-cm diameter PVC collars inserted into the soil). Changes in soil CO2 concentrations within the soil chamber were measured for 2 min to calculate soil CO2 efflux rates at each sampling point. Soil volumetric water content (VWC, using Theta Probe type ML2x) and soil temperature were measured at 10 cm depth inside each soil collar. All measurements were done between 9 and 11 am to avoid large changes in temperature during the day, and after at least 3 days of a precipitation event to avoid bias on higher soil moisture rates.
Vegetation parameters
Leaf area index (LAI) was measured monthly at the 50 sampling points using a LAI-2200 (Licor, Lincoln, NE). LAI measurements were carried out under diffuse sky conditions early in the morning (between 6 and 7 am) using a 90 degree view cap to avoid the appearance of the operator on the sensor and to block direct light. The operator stood between the sensor and the rising sun at all times following protocols for Mediterranean ecosystems with open canopy (Ryu et al., 2010).
Enhanced vegetation index (EVI) was calculated using MODIS Land Product Subsets for a 2 x 2-km area around the study site to complement the temporal patterns of vegetation dynamics (Huete et al., 2002). Average EVI was calculated for the four MODIS pixels for 8-day temporal resolution within this area. These data were derived from MODIS products generated from Collection 5 from the Oak Ridge National Laboratory Distributed Active Archive Center (ORNL DAAC 2011). Temporal interpolation was used to replace pixels that had quality control flags indicating poor quality.
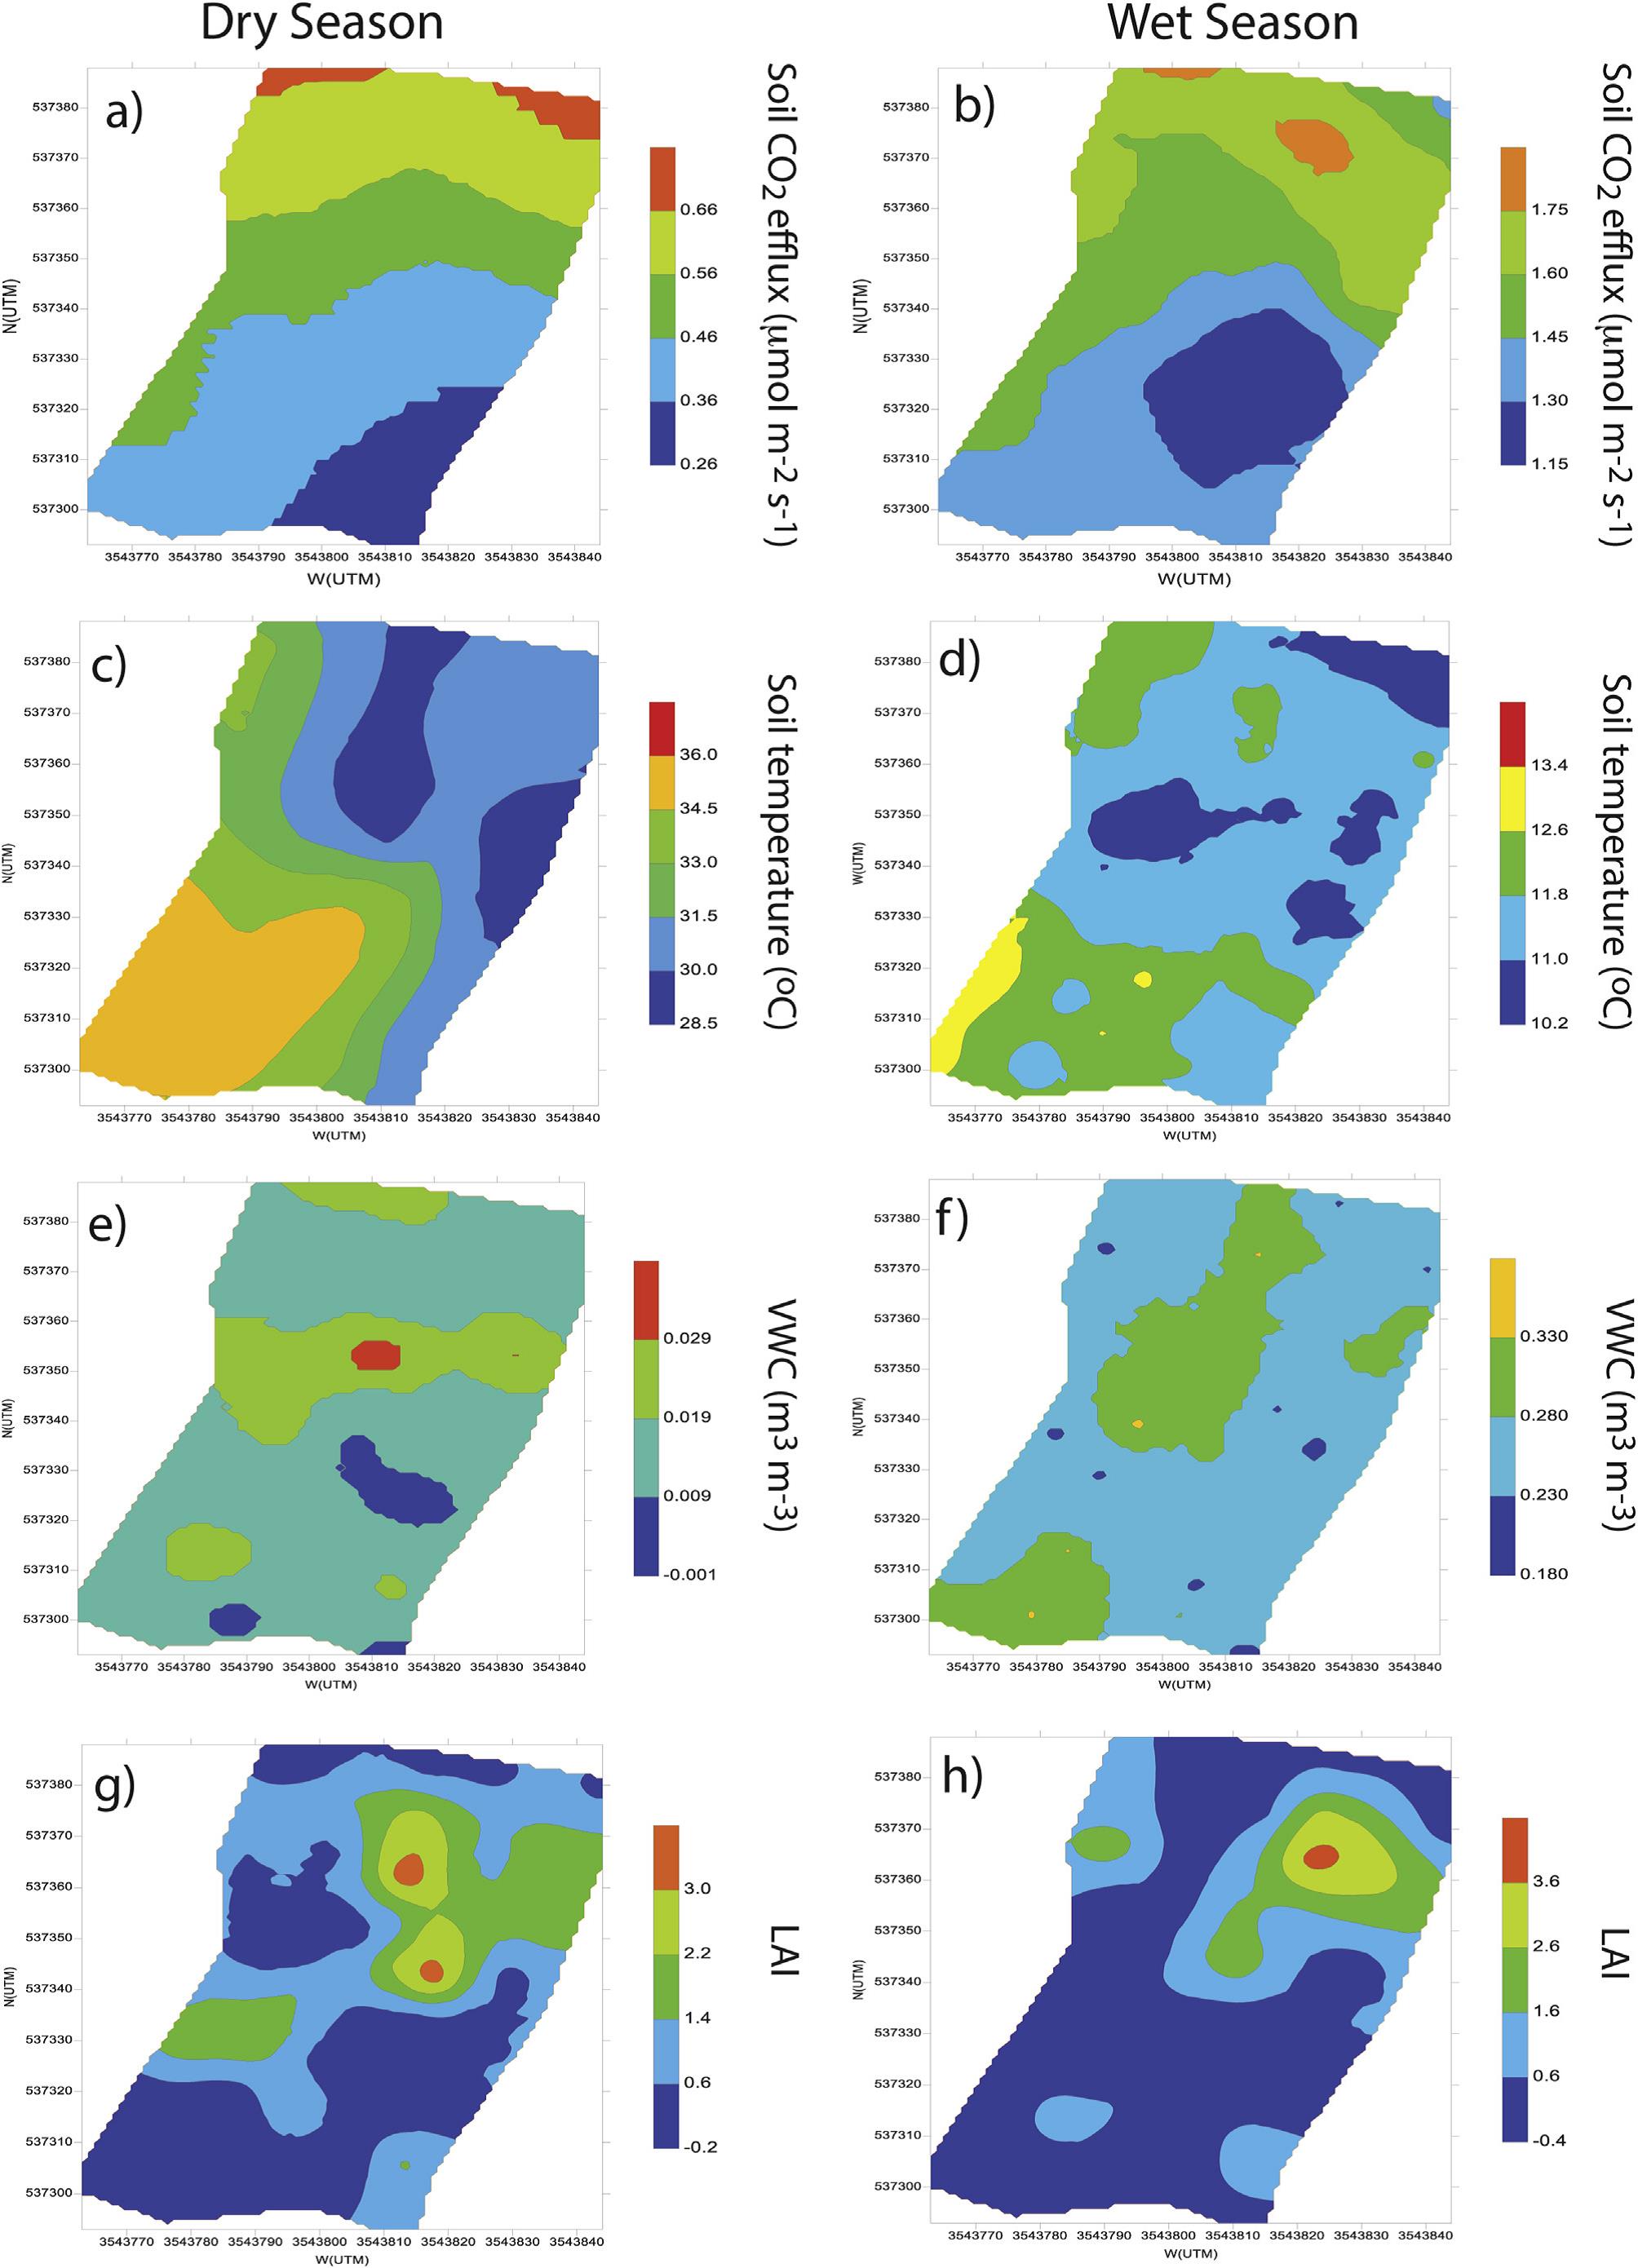
Figure 2. Spatial patterns generated by ordinary kriging for the dry season (September) and the wet season (February). From Leon et al., 2014.
Data Access
This data is available through the Oak Ridge National Laboratory (ORNL) Distributed Active Archive Center (DAAC).
CMS: Soil CO2 Efflux and Properties, Site Vegetation Measurements, Mexico, 2011-2012
Contact for Data Center Access Information:
- E-mail: uso@daac.ornl.gov
- Telephone: +1 (865) 241-3952
References
Almagro, M., Querejeta, J.I., Boix-Fayos, C., Martínez-Mena, M., 2013. Links between vegetation patterns, soil C and N pools and respiration rate under three different land uses in a dry Mediterranean ecosystem. Journal of Soils and Sediments 13, 641e653.
Breiman, L., Friedman, J.H., Olshen, R.A., Stone, C.J., 1984. Classification and Regression Trees. Wadsworth & Brooks/Cole, Monterey, CA, USA.
Cable, J.M., Ogle, K., Williams, D.G., Weltzin, J.F., Huxman, T.E., 2008. Soil texture drives responses of soil respiration to precipitation pulses in the Sonoran Desert: implications for climate change. Ecosystems 11, 961e979.
Delgado, J., Garatuza-Payan, J., Gonzalez del Castillo, E., Oechel, W., Sanchez- Azofeifa, G.A., Velasco, E., Vivoni, E.R., Watts, C., 2013b. Progress and opportunities for monitoring greenhouse gases fluxes in Mexican ecosystems: the MexFlux network. Atmosfera 26.
Hellmers, H., Horton, J.S., Juhren, G., O'Keefe, J., 1955. Root systems of some chaparral plants in Southern California. Ecology, 667e678.
Huete, A., Didan, K., Miura, T., Rodriguez, E.P., Gao, X., Ferreira, L.G., 2002. Overview of the radiometric and biophysical performance of the MODIS vegetation indices. Remote Sensing of Environment 83, 195e213.
Kim, D.G., Vargas, R., Bond-Lamberty, B., Turetsky, M.R., 2012. Effects of soil rewetting and thawing on soil gas fluxes: a review of current literature and suggestions for future research. Biogeosciences 9, 2459e2483.
Leon, E., R. Vargas,S. Bullock, E. Lopez, A.R. Panosso, and N. La Scala Jr. Hot spots, hot moments, and spatio-temporal controls on soil CO2 efflux in a water-limited ecosystem. Soil Biology & Biochemistry 77 (2014) 12-21.
Minnich, R.A., Chou, Y.H., 1997. Wildland fire patch dynamics in the chaparral of Southern California and Northern Baja California. International Journal of Wildland Fire 7, 221e248.
ORNL DAAC 2011. MODIS Collection 5 Subsetted Land Products. ORNL DAAC, Oak Ridge, Tennessee, USA. Accessed June 20, 2012.
Ryu, Y., Sonnentag, O., Nilson, T., Vargas, R., Kobayashi, H., Rebecca, W Baldocchi, D.D., 2010. How to quantify tree leaf area index in an open savanna ecosystem: a multi-instrument and multi-model approach. Agricultural andForest Meteorology 150, 63e76.
Scott-Denton, L.E., Sparks, K.L., Monson, R.K., 2003. Spatial and temporal controls of soil respiration rate in a high-elevation, subalpine forest. Soil Biology and Biochemistry 35, 525e534.
Stoyan, H., De-Polli, H., Bohm, S., Robertson, G.P., Paul, E.A., 2000. Spatial heterogeneityof soil respiration and related properties at the plant scale. Plant and Soil 222, 203e214.
Tabachnick, B.G., Fidell, L.S., 2001. Using Multivariate Statistics, fourth ed, xxvi. Allynand Bacon, Boston, p6.
Vargas, R., Yepez, E.A., Andrade, J.L., Angeles, G., Arredondo, T., Castellanos, A.E., Delgado, J., Garatuza-Payan, J., Gonzalez del Castillo, E., Oechel, W., Sanchez- Azofeifa, G.A., Velasco, E., Vivoni, E.R., Watts, C., 2013b. Progress and opportunities for monitoring greenhouse gases fluxes in Mexican ecosystems: the MexFlux network. Atmosfera 26.