Documentation Revision Date: 2016-03-21
Summary
There are four data files with this data set in comma-separated (.csv) format.
Figure 1 shows a summary of precipitation, GPP, and fPAR gradients along the Baja California Peninsula. The locations of the transects are denoted by their abbreviations. GPP and fPAR are higher in the extreme north and south (green color) and lower in the middle of the peninsula (brown color). Finally, precipitation is also higher in the northern and southern extremes and lower in the center of the peninsula (denoted by the fading blue colored arrow). In the coastal Pacific Ocean, SST is colder in the north (denoted by the blue color) and warmer in the south. The California Current roughly parallels the coast line, flowing north to south. Upwelling zones are denoted by blue ovals. From Reimer et al., 2015.
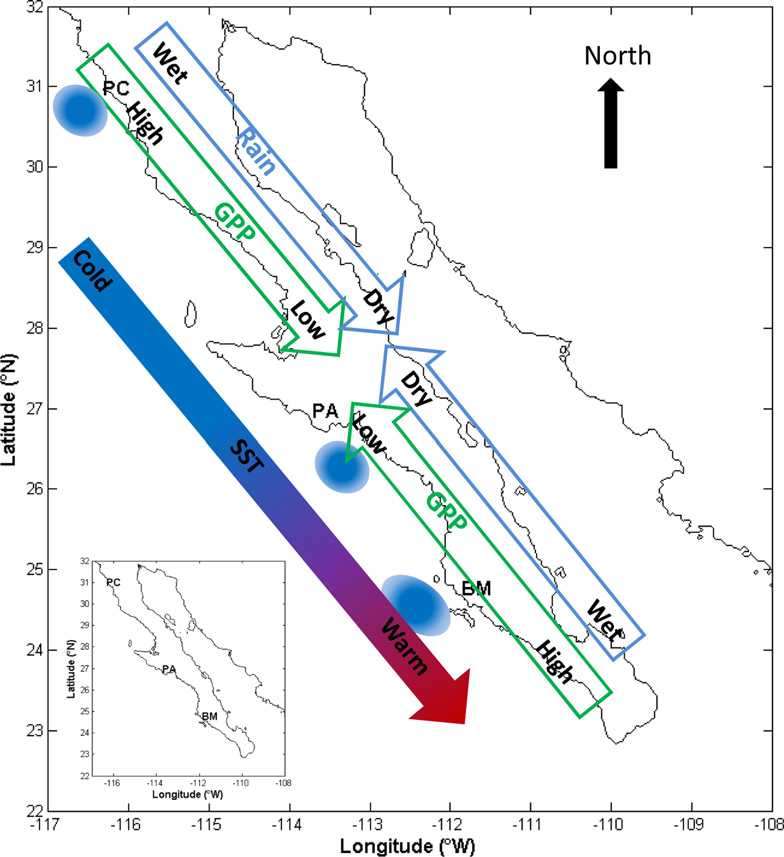
Fig. 1. Transect locations PC, PA, and MB are shown in relation to gradients of rain, SST, and GPP (fPAR), and ocean upwelling zones, Baja California, Mexico.
Citation
Reimer, J.J., R. Vargas, D. Rivas, G. Gaxiola-Castro, J.M. Hernandez-Ayon, and R. Lara-Lara. 2016. CMS: MODIS GPP, fPAR, and SST, and ENSO Index, Baja California, Mexico, 2000-2013. ORNL DAAC, Oak Ridge, Tennessee, USA. http://dx.doi.org/10.3334/ORNLDAAC/1310
Table of Contents
- Data Set Overview
- Data Characteristics
- Application and Derivation
- Quality Assessment
- Data Acquisition, Materials, and Methods
- Data Access
- References
Data Set Overview
Project: Carbon Monitoring System (CMS)
Investigators: J.J. Reimer, R. Vargas, D. Rivas, G. Gaxiola-castro, J.M. Hernandez-Ayon, and R. Lara-Lara
This data set provides data for MODIS-derived (1) gross primary productivity (GPP) for the years 2000-2010, (2) fraction of photosynthetically active radiation (fPAR) for the years 2003-2013, (3) sea surface temperature (SST) for the years 2003-2013, and (4) the NOAA-source Multivariate ENSO Index (MEI) data for the years 2003-2013 (as a measure of the El Nino/Southern Oscillation). The study areas were three transects on the Baja California Peninsula, Mexico, and the adjacent Pacific Ocean. The transects, in order from North to South, West to East included Punta Colonet (three sites-PC1, PC2, PC3), Punta Abreojos (two sites-PA1, PA2), and Magdalena Bay (three sites-MB1, MB2, MB3).
The CMS is designed to make significant contributions in characterizing, quantifying, understanding, and predicting the evolution of global carbon sources and sinks through improved monitoring of carbon stocks and fluxes. The System will use the full range of NASA satellite observations and modeling/analysis capabilities to establish the accuracy, quantitative uncertainties, and utility of products for supporting national and international policy, regulatory, and management activities. CMS will maintain a global emphasis while providing finer scale regional information, utilizing space-based and surface-based data.
Data Characteristics
Spatial Coverage
The study areas were three transects on the Baja California Peninsula, and the adjacent Pacific Ocean. The transects in order from North to South, West to East included Punta Colonet (three sites-PC1, PC2, PC3), Punta Abreojos (two sites-PA1, PA2), and Magdalena Bay (three sites-MB1, MB2, MB3).
Spatial resolution
GPP (MOD17A2) and fPAR (MOD15A2) data obtained from the MODIS Land Product subsetting tool (ORNL DAAC 2008a,b) for sites along the transects. Each site was 25 km2 at each transect with the mean value for GPP and fPAR reported for the center pixel.
SST used in this study were obtained from the monthly composite MODIS SST product. The time series of SST was averaged over the spatial domain of the offshore region for each transect: ~4 km (north/south; the finest resolution of the data) by up to ~100 km (east/west).
Temporal Coverage
The data cover the years 2000-2013.
Temporal resolution
Monthly and 8-day averages
Study Area (All latitudes and longitudes are given in decimal degrees)
| Study Area | Westernmost Longitude | Easternmost Longitude | Northernmost Latitude | Southernmost Latitude |
|---|---|---|---|---|
| Three transects on the Baja California Peninsula: Punta Colonet, Punta Abreojos, and Magdalena Bay | -117. 913984375 | -108. 949140625 | 32.637735467028 | 22.774386467695 |
File 1. fPAR_Mexico_2003_2013.csv:
fPAR data for the years 2003-2013. Data were obtained from the MODIS Land Product (MOD15A2) for sites along the transects of 25 km2 with the mean value for fPAR reported for the center pixel.
Missing values, not applicable, or not recorded are provided as -9999.
| Column | Units/format | Description |
|---|---|---|
| YEAR | yyyy | Year |
| MONTH | mm | Month-1-12 |
| DOY | ddd | Day of calendar year |
|
Cols 4-11: fPAR_PC1-PC3, PA1-PA2, and MB1-MB3 |
fraction | fPAR, mean of the proportion of available radiation in the photosynthetically active wavelengths that are absorbed by a canopy for the study sites where: Punta Colonet sites= PC1, PC2, PC3; Punta Abreojos sites= PA1, PA2; and Magdalena Bay sites= MB1, MB2, or MB3. |
File 2. Gross_primary_productivity_Mexico_2000_2010.csv:
GPP obtained from the MODIS MOD17 product for the period 2000-2010. Data were obtained for sites along the transects of 25 km2 with the mean value for GPP reported for the center pixel.
| Column | Units/format | Description |
|---|---|---|
| YEAR | yyyy | Year |
| MONTH | mm | Month-1-12 |
| DOY | ddd | Day of calendar year |
| Cols 4-11: GPP_PC1-PC3, PA1-PA2, and MB1-MB3 | g C/m2 | GPP, mean of 8-day cumulative GPP values based on the radiation-use efficiency concept, for the study sites where: Punta Colonet sites= PC1, PC2, PC3; Punta Abreojos sites= PA1, PA2; and Magdalena Bay sites= MB1, MB2, or MB3. |
File 3: Mean_Sea_Surface_Temp_Mexico_2003_2013.csv:
Mean SST data: Monthly composite SST observations obtained from MODIS (time series) and averaged over the spatial domain of the offshore region adjacent to each transect.
| Column | Units/format | Description |
|---|---|---|
| YEAR | yyyy | Year |
| MONTH | mm | Month-1-12 |
| Cols 3-5: MEAN_SST_PC, PA, and MB | degrees C | Mean monthly sea surface temperature for the study sites where: Punta Colonet transect=PC; Punta Abreojos transect =PA; and Magdalena Bay transect= MB |
File 4: Multivariate_Enso_Index_Mexico_2003_2013.csv:
Multivariate ENSO Index (unitless value) for January-December, for the years 2003-2013. The temporal resolution of this index is also one month.
| Column | Units/format | Description |
|---|---|---|
| YEAR | yyyy | Year |
| Cols 2-13: MEI-January-December | unitless | Multivariate ENSO Index (unitless value) for January-December, for the years 2003-2013. |
Application and Derivation
The research is important to ecosystem process-based models and the lateral influence of local-scale ocean processes that could influence the adjacent terrestrial ecosystem productivity (Reimer et al., 2015).
Some land and ocean processes are related through connections (and synoptic-scale teleconnections) to the atmosphere. Synoptic-scale atmospheric (El Niño/Southern Oscillation [ENSO], Pacific Decadal Oscillation [PDO], and North Atlantic Oscillation [NAO]) decadal cycles are known to influence the global terrestrial carbon cycle. Potentially, smaller scale land-ocean connections influenced by coastal upwelling (changes in sea surface temperature) may be important for local-to-regional water-limited land ecosystems where plants may benefit from air moisture transported from the ocean to terrestrial ecosystems. Research results show the importance of local-scale changes in SST during upwelling events, to explain the variability in GPP in adjacent water-limited terrestrial ecosystems (Reimer et al., 2015).
Quality Assessment
The data provided in this data set were obtained from the Moderate Resolution Imaging Spectroradiometer (MODIS). Quality assessment (QA) is an integral part of the MODIS Land production chain. The objective of MODLAND QA is to evaluate and document the scientific quality of the MODLAND products with respect to their intended performance.
Data Acquisition, Materials, and Methods
Study Areas
The study areas were three transects on the Baja California Peninsula, and the adjacent Pacific Ocean. The Peninsula is characterized by various semiarid climate regimes including Mediterranean (northwest), desert (central), and subtropical (extreme south), with vegetation in all regions adapted to drought conditions (La Niña phase). This type of vegetation may rapidly grow during wet conditions (El Niño phase) (Badan 2003). Upwelling in the Pacific Ocean along Baja California is strongest off the capes and points (Zaytsev et al., 2003), with the “upwelling season” (when upwelling is strongest and most persistent) typically from March through August, though upwelling does occur year round.
The three transects in order from North to South, West to East included Punta Colonet, Punta Abreojos, and Magdalena Bay. Each transect consists of 2 or 3 sites, which are located at sea level or on upward slopes (<1,000 meters above sea level):
- The Punta Colonet transect (sites PC1, PC2, and PC3) is the region farthest north along the peninsula studied in this work and extends up to 68-km inland to the base of the San Pedro Martir mountain range. The vegetation types were: closed shrubland (PC1 and PC2), and open shrubland (PC3; Table 1).
- The Punta Abreojos transect (PA1 and PA2) is in one of the driest areas of the Baja California Peninsula and is also the driest region analyzed in this study. At this transect we were only able to select two sites (i.e., NASA’s Moderate Resolution Imaging Spectroradiometer [MODIS] cutoffs) due to the inland oasis (subterranean water source) at San Ignacio and the location of San Ignacio Lagoon, which would likely influence water vapor content thus masking the effects of upwelling. Both sites are open shrubland (Table 1).
- The Bahia Magdalena (BM1, BM2, and BM3) transect extends approximately 85-km inland. All three sites are open shrubland (Table 1) and this is the wettest region (sub-tropical) in this study. The marine portion of the transect starts outside of the bay and stretches across the coastal zone (Reimer et al., 2015).
Table 1. Transect Study Sites
| Transect Study sites (north to south) | Westernmost Longitude | Northernmost Latitude | Approximate distance to coast (km) | Vegetation type –shrubland (center pixel) | Climate |
|---|---|---|---|---|---|
| PC1 | -116.30985 | 30.97849 | 5.0 | Closed | Semi-arid |
| PC2 | -116.11176 | 30.97849 | 13 | Closed | Semi-arid |
| PC3 | -116.30985 | 30.97849 | 50 | Open | Semi-arid |
| PA1 | -113.70618 | 26.96033 | 12 | Open | Arid |
| PA2 | -112.74719 | 26.96033 | 57 | Open | Arid |
| MB1 | -111.85455 | 24.76429 | 29 | Open | Sub-tropical |
| MB2 | -111.59912 | 24.76429 | 57 | Open | Sub-tropical |
| * MB3 | -111.09375 | 24.76429 | 60 | Open | Sub-tropical |
* MB3 is 60-km from the coast along a southwest oriented transect, but approximately 95-km along the line of latitude.
Methods
fPAR and GPP
fPAR (used here as a proxy for GPP temporal patterns) and GPP observations were derived from MODIS Land Product Subsets generated with Collection 5 from the Oak Ridge National Laboratory Distributed Active Archive Center (ORNL DAAC, 2008 (a)) fPAR subsets of 25-km2 were used at each transect from 2003 through 2013 (2 to 3 inland subsets per transect), with the mean value for fPAR reported for the center pixel.
Along each transect the subsets for MODIS fPAR data are referred to as “sites”; the sites were treated separately for statistical analyses, and then general conclusions were made in terms of all the sites that make up a transect. MODIS fPAR was analyzed for years 2000–2013 and MODIS GPP, obtained from the MODIS MOD17 product (Running et al., 2004; ORNL DAAC, 2008 (b)) for years 2000–2010. GPP observations are combined with fPAR for temporal analyses due to the larger extent of available data at the region of interest, but as described earlier, it is a proxy for GPP (Reimer et al., 2015).
SST
Monthly composite SST observations were obtained from MODIS through the NASA Giovanni interface (http://gdata1.sci.gsfc.nasa.gov/daac-bin/G3/gui.cgi?instance_id = ocean_month).
The 4-km2 resolution night SST product was used to avoid the influence of solar heating of the ocean surface skin layer. Since upwelling is a process in which the wind-ocean interaction may extend for roughly one day to several days, using the night product will not filter out the effect of upwelling. The time series of SST was averaged over the spatial domain of the offshore region for each transect: ~4 km (north/south; the finest resolution of the data) by up to ~100 km (east/west) (Reimer et al., 2015).
Multivariate ENSO Index (MEI)
The Multivariate ENSO Index (MEI) was used for the analysis of the synoptic-scale teleconnection between oscillations in atmospheric conditions and the response in fPAR (data available from: http://www.esrl.noaa.gov/psd/enso/mei/table.html). The temporal resolution of this index is also one month and therefore a period of two months is the lowest frequency for which synoptic scale variability could be resolved as indicated by the Nyquist frequency (i.e., the lowest sampling frequency is equal to two times the change in the time step) (Reimer et al., 2015).
Data Access
This data is available through the Oak Ridge National Laboratory (ORNL) Distributed Active Archive Center (DAAC).
CMS: MODIS GPP, fPAR, and SST, and ENSO Index, Baja California, Mexico, 2000-2013
Contact for Data Center Access Information:
- E-mail: uso@daac.ornl.gov
- Telephone: +1 (865) 241-3952
References
Badan A. (2003). The effects of El Niño in Mexico: A survey. Geofis Int 42: 567–571.
Nyquist H (1928). Certain topics in telegraph transmission theory. Trans IAEE 90: 617–644. Available: http://ieeexplore.ieee.org/xpls/abs_all.jsp?arnumber=5055024. Accessed 28 January 2015.
ORNL DAAC 2008 (a). MODIS Collection 5 Land Products Global Subsetting and Visualization Tool. ORNL DAAC, Oak Ridge, Tennessee, USA. Subset obtained for MOD15A2, time period: 2003-01-01 to 2013-12-31. http://dx.doi.org/10.3334/ORNLDAAC/1241
ORNL DAAC 2008 (b). MODIS Collection 5 Land Products Global Subsetting and Visualization Tool. ORNL DAAC, Oak Ridge, Tennessee, USA. Subset obtained for MOD17, time period: 2003-01-01 to 2010-12-31. http://dx.doi.org/10.3334/ORNLDAAC/1241
Reimer JJ, Vargas R, Rivas D, Gaxiola-Castro G, Hernandez-Ayon JM, Lara-Lara R (2015). Sea Surface Temperature Influence on Terrestrial Gross Primary Production along the Southern California Current. PLoS ONE 10(4): e0125177. doi:10.1371/journal.pone.0125177
Running SW, Nemani RR, Heinsch FANN, Zhao M, Reeves M, Hashimoto H, et al. (2004). A Continuous Satellite-Derived Measure of Global Terrestrial Primary Production. Bioscience 54: 547–560.
Zaytsev O, Cervantes-Duarte R, Montante O, Gallegos-Garcia A (2003) Coastal upwelling activity on the Pacific shelf of the Baja California Peninsula. J Oceanogr 59: 489–502. Available: http://link. springer.com/article/10.1023/A:1025544700632. Accessed 15 October 2013.