Get Data
Revision Date: October 22, 2014
Summary:
These data consist of high-resolution maps of aboveground biomass at four forested sites in the US: Garcia River Tract in California, Anne Arundel and Howard Counties in Maryland, Parker Tract in North Carolina, and Hubbard Brook Experimental Forest in New Hampshire. Biomass maps were generated using a combination of field data (forest inventory and Lidar) and modeling approaches. Estimates of uncertainty are also provided for the Maryland site using two different modeling methodologies.
These data provide estimates of aboveground biomass for the nominal year of 2011 at 20-50 meter resolution in units of megagrams of carbon per hectare (or acre for the Garcia Tract site).
The data are presented as a series of 11 GeoTIFF (*.tif) files.
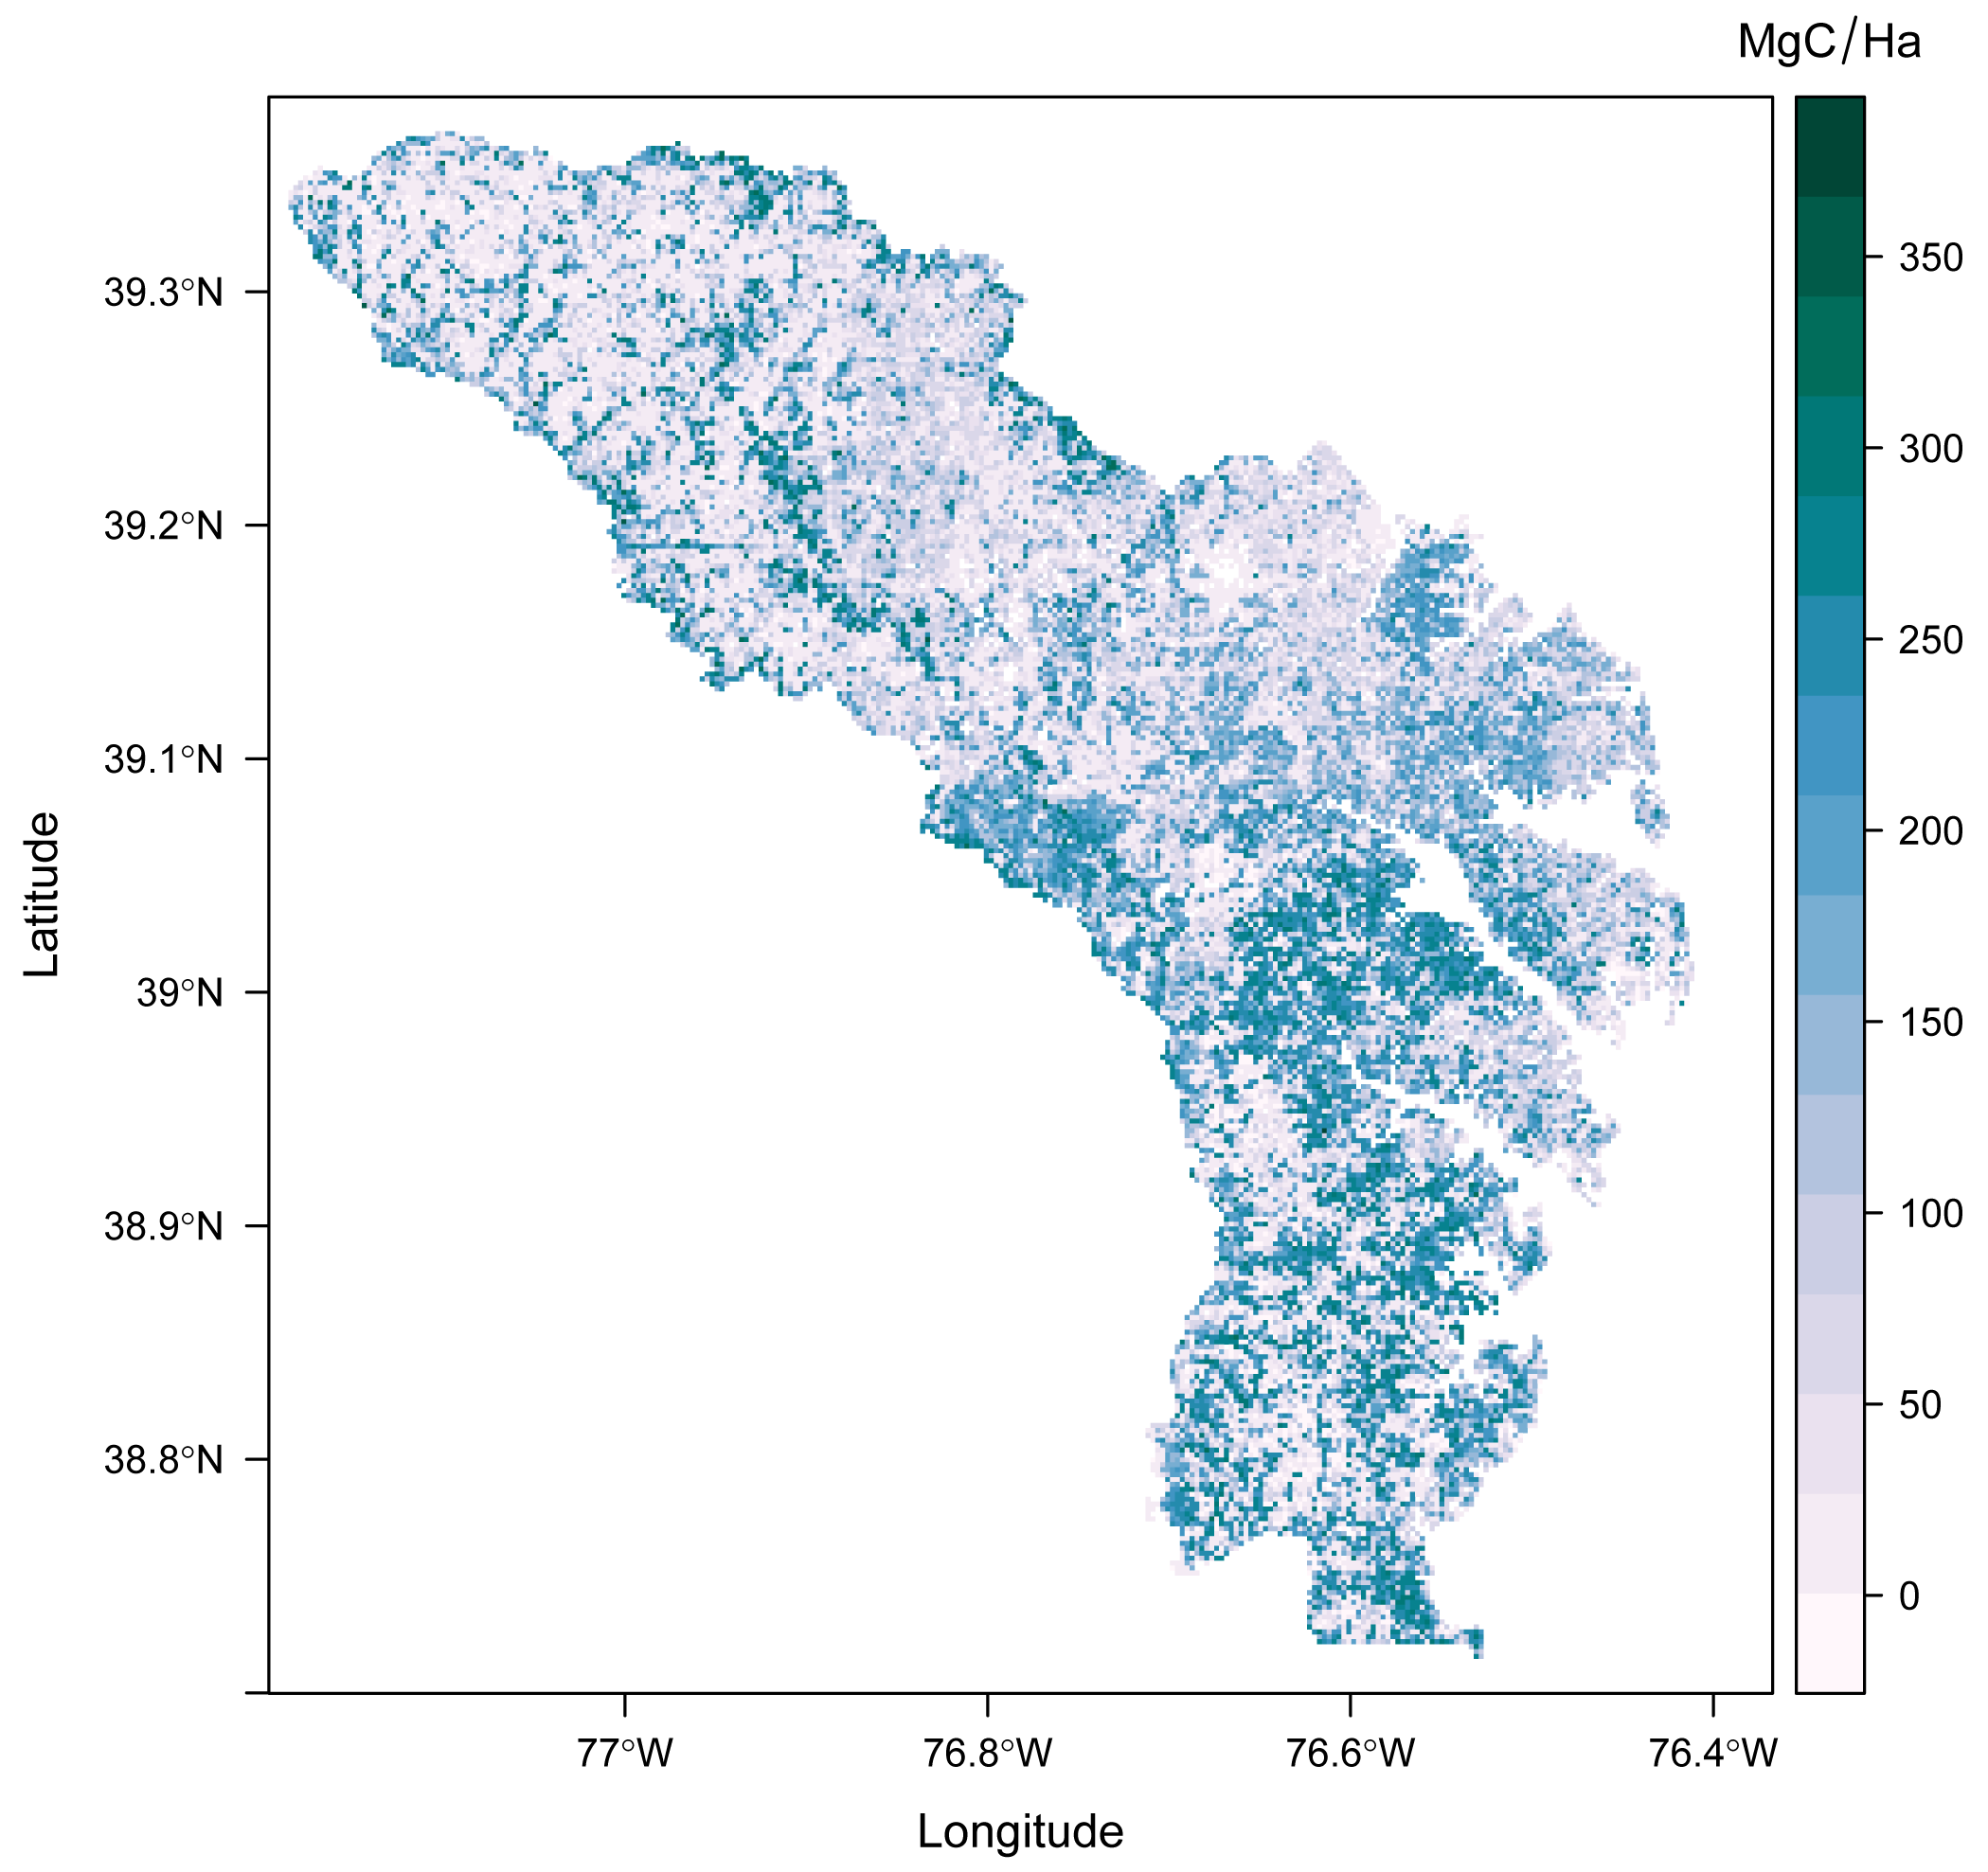
Figure 1. Estimated aboveground biomass (in Mg carbon per hectare) for Anne Arundel and Howard Counties in Maryland at 30-m spatial resolution using the random forest method.
Data Citation:
Cite this data set as follows:
Cook, B., A. Swatantran, L. Duncanson, A. Armstrong, N. Pinto, R. Nelson. 2014. CMS: LiDAR-derived Estimates of Aboveground Biomass at Four Forested Sites, USA. ORNL DAAC, Oak Ridge, Tennessee, USA. < a href="http://dx.doi.org/10.3334/ORNLDAAC/1257"> http://dx.doi.org/10.3334/ORNLDAAC/1257
Table of Contents:
- 1 Data Set Overview
- 2 Data Characteristics
- 3 Applications and Derivation
- 4 Quality Assessment
- 5 Acquisition Materials and Methods
- 6 Data Access
- 7 References
1. Data Set Overview:
Project: Carbon Monitoring System (CMS)
Investigators: Bruce Cook (bruce.cook@nasa.gov), Anu Swatantran (aswatan@umd.edu), Laura Duncanson, Amanda Armstrong, Naiara Pinto, Ross Nelson.
The CMS is designed to make significant contributions in characterizing, quantifying, understanding, and predicting the evolution of global carbon sources and sinks through improved monitoring of carbon stocks and fluxes. The System will use the full range of NASA satellite observations and modeling/analysis capabilities to establish the accuracy, quantitative uncertainties, and utility of products for supporting national and international policy, regulatory, and management activities. CMS will maintain a global emphasis while providing finer scale regional information, utilizing space-based and surface-based data.
These data consist of high-resolution maps of aboveground biomass at four forested sites in the US: Garcia River Tract in California, Anne Arundel and Howard Counties in Maryland, Parker Tract in North Carolina, and Hubbard Brook Experimental Forest in New Hampshire. Biomass maps were generated using a combination of field data (forest inventory and Lidar) and modeling approaches. Estimates of uncertainty are also provided for the Maryland site using two different modeling methodologies.
These data provide estimates of aboveground biomass for the nominal year of 2011 at 20-50 meter resolution in units of megagrams of carbon per hectare (or acre for the Garcia Tract site).
2. Data Characteristics:
Data are presented as 11 GeoTIFF files (*.tif), listed in Table 2.
Spatial Coverage
Site boundaries: (All latitude and longitude given in decimal degrees, datum: WGS84)
| Site (Region) | Westernmost Longitude | Easternmost Longitude | Northernmost Latitude | Southernmost Latitude |
|---|---|---|---|---|
| Hubbard Brook Experimental Forest, NH | -71.80 | -71.68 | 43.96 | 43.91 |
| Garcia Tract, CA | -123.61 | -123.41 | 38.95 | 38.84 |
| Anne Arundel and Howard Counties, MD | -77.19 | -76.36 | 39.36 | 38.71 |
| Parker Tract, NC | -76.73 | -76.59 | 35.84 | 35.78 |
Spatial Resolution
Grid cells at 20-50 meter resolution, differs by site.
Time period
The data set has no explicit temporal component. Data are nominally for the year 2011/01/01 to
2011/12/31.
Temporal Coverage
One time.
Data File Information
Table 2. Data File Information
The units for the file GarciaTract_Biomass.tif are in MgC/Acre. The units for all other files are in MgC/Ha. Pixels with no data are represented by values of -1.797e+308.
| FILE NAME | PIXEL SIZE | DESCRIPTION |
|---|---|---|
| GarciaTract_Biomass.tif | 20 m | Aboveground biomass estimated from a regression model |
| HubbardBrook_Biomass.tif | 50 m | Aboveground biomass estimated from stepwise linear regression |
| Maryland_Biomass_BMA.tif | 30 m | Aboveground biomass estimated from bayesian model averaging |
| Maryland_Biomass_BMA_low.tif | 30 m | Lower 95% confidence limit for each grid cell based on bayesian model averaging |
| Maryland_Biomass_BMA_high.tif | 30 m | Upper 95% confidence limit for each grid cell based on bayesian model averaging |
| Maryland_Biomass_ED.tif | 30 m | Aboveground biomass estimates based on the Ecosystem Demography model |
| Maryland_Biomass_OLS.tif | 30 m | Aboveground biomass estimates based on ordinary least squares regression |
| Maryland_Biomass_OLS_high.tif | 30 m | Upper 95% confidence limit for each grid cell based on ordinary least squares regression |
| Maryland_Biomass_OLS_low.tif | 30 m | Lower 95% confidence limit for each grid cell based on ordinary least squares regression |
| Maryland_Biomass_RF.tif | 30 m | Aboveground biomass estimates based on a Random Forest model |
| ParkerTract_Biomass.tif | 30 m | Aboveground biomass estimates based on multiple linear regression |
3. Data Application and Derivation:
These data represent initial attempts to estimate regional-scale vegetation carbon stocks using existing in situ, airborne, and satellite observations. One goal of this CMS project was to demonstrate how well biomass can be quantified with high-quality remotely-sensed data taken at fine spatial resolution for selected sites representative of US forest types and conditions.
4. Quality Assessment:
The authors captured the uncertainty in the modelled biomass estimates for the Maryland site under two different modeling approaches: Bayesian model averaging (BMA), and ordinary least squares regression (OLS). Spatially-gridded estimates of the upper and lower bounds of the 95% confidence interval of the mean, at 30-m spatial resolution, are provided for the Maryland BMA and OLS models as part of the data set.
Uncertainty in the Maryland biomass estimates derives from multiple factors, including, but not limited to: field sampling errors and uneven spatial distribution, uncertainty in remote-sensing data products, choice of grid cell size, and model error. Both the BMA and OLS models extrapolate beyond the range of the training data and therefore they predict very high and very low biomass (negative values). The investigators did not change the negative biomass values to zero because they represent model prediction errors but users may wish to exclude the pixels with negative values since they are actually areas with very low or zero biomass.
For the Maryland site, the Random Forest model does not extrapolate beyond the range of training values and the RF is being used by the investigators in follow-on projects funded under CMS-2 and CMS-3.
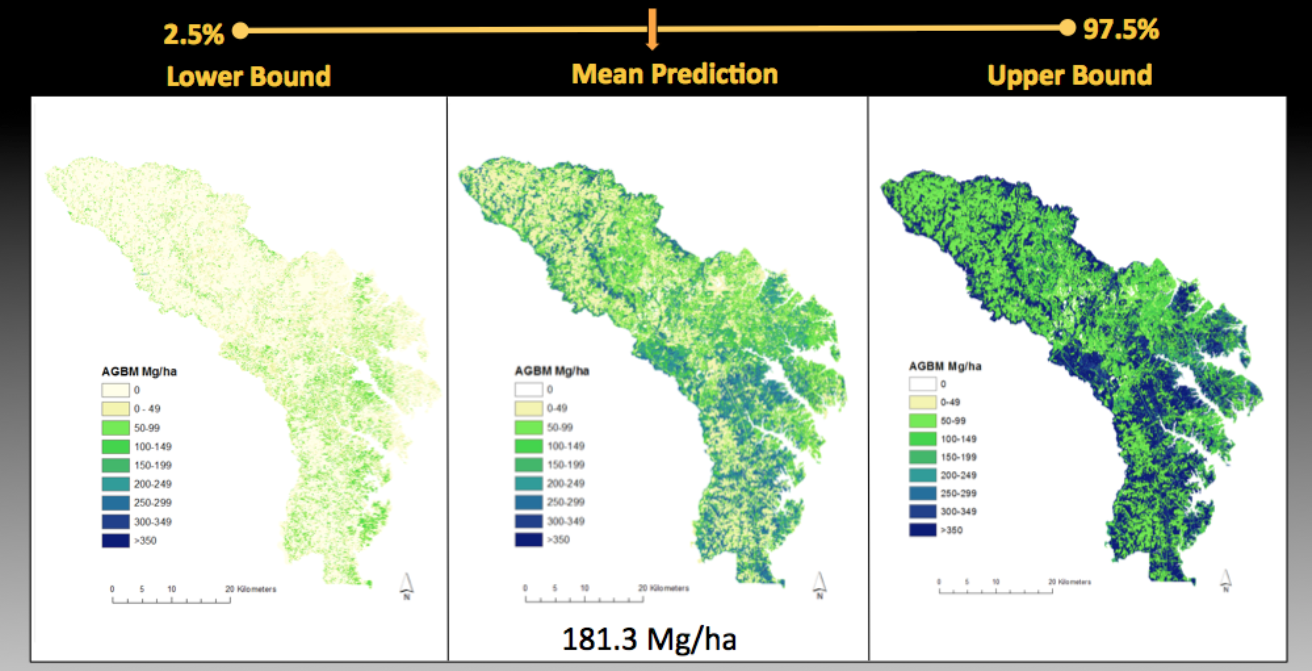
Figure 2. Error maps from Maryland biomass predictions using the Bayesian model averaging method. For any 30-m pixel, the lower and upper 95% confidence interval is shown.
5. Data Acquisition Materials and Methods:
This data set of aboveground biomass for four sites was derived from models based on combining new field data collection with existing, LiDAR mapping of each site, along with existing radar and optical data. Specific methods varied from site to site.
Anne Arundel and Howard counties, Maryland: Two counties in Maryland, US, were chosen as the focus areas. Field data included both existing measurements that were part of the U.S. Forest Service Inventory and Analysis network (FIA) as well as 300 new variable radius plots. Additionally, small-footprint LiDAR, ALOS/PALSAR radar data and Landsat time since disturbance products were included as predictor variables. The investigators tested two statistical methods: ordinary least squares regression (OLS), and Bayesian model averaging (BMA). They also employed random forest (RF) machine learning algorithms and evaluated the predictions of the Ecosystem Demography (ED) forest-growth model. A full description of the procedure and analyses of results are provided in the companion file: Maryland_Biomass_methods.pdf.
Garcia River Forest, California: The Garcia River Forest (GRF) project is a 9,623-ha (23,780 acre) forest located in Mendocino County, California northwest of the town of Boonville. This forest is owned by The Conservation Fund (TCF) and is protected by a conservation easement held by the Nature Conservancy (TNC). Color-infrared imagery for the site was combined with LiDAR data and this large data volume was summarized using principal component analysis (PCA) to reduce the number of variables. Field-collected forest inventory data from 199 plots was then correlated to the reduced set of remotely sensed variables found using the PCA. Several models were built that related remotely sensed data to the measured plot data in each sampled grid cell. However, only the regression model for basal area (BA), multiplied by each cell’s average canopy height, was used to develop the biomass estimates. A full description of the procedure and analyses of results are provided in Golinkoff et al. (2011).
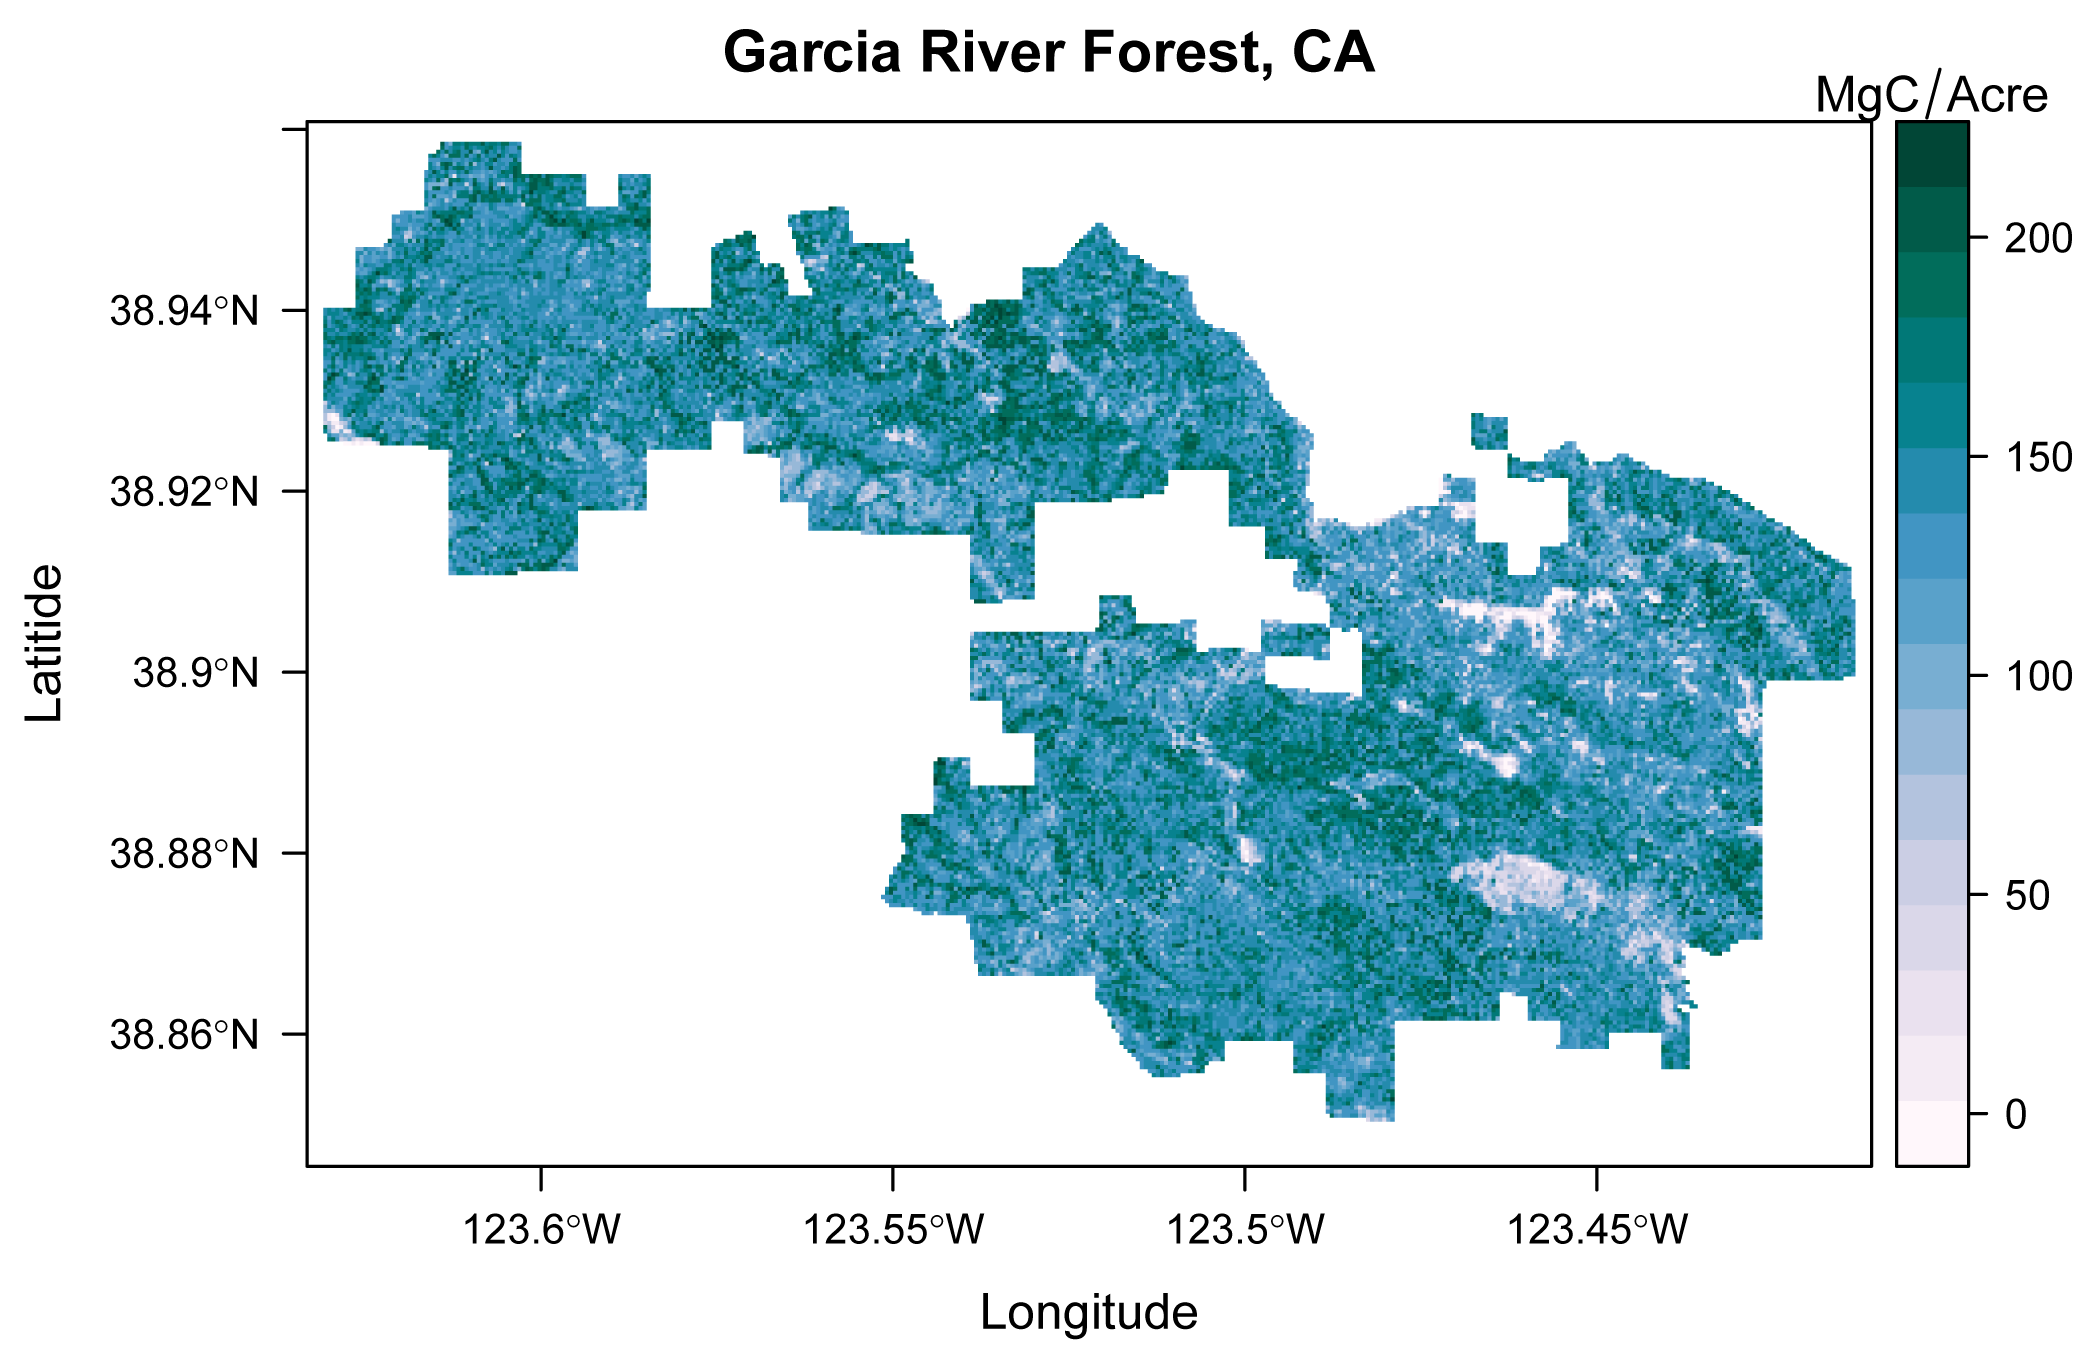
Figure 3. Estimated aboveground biomass (in Mg carbon per acre) for the Garcia River Forest, California at 20-m spatial resolution.
Parker Tract, North Carolina: Multiple linear regression was used to predict aboveground biomass values based on LiDAR and forest inventory data.
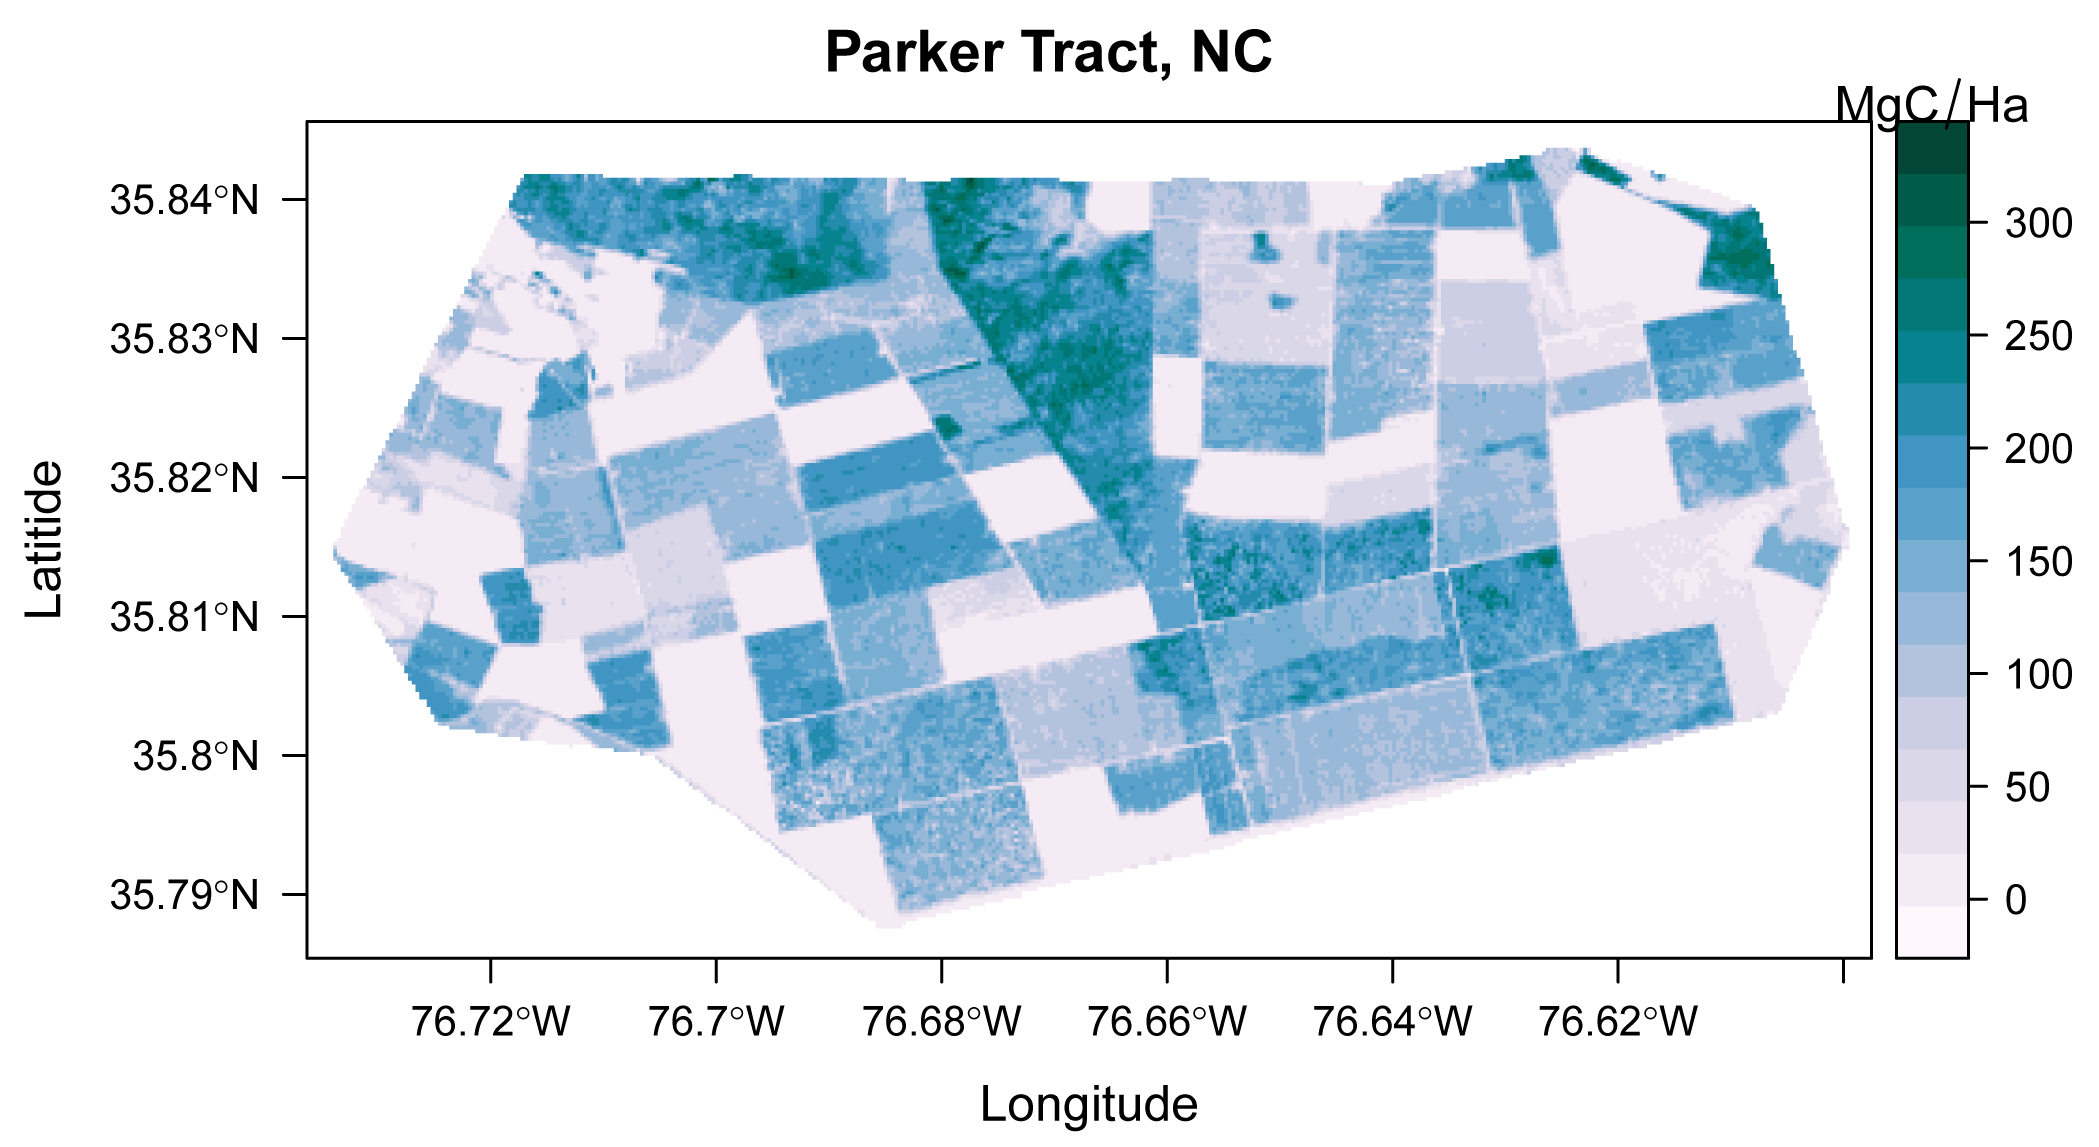
Figure 4. Estimated aboveground biomass (in Mg carbon per hectare) for the Parker Tract, North Carolina at 30-m spatial resolution.
Hubbard Brook Experimental Forest, New Hampshire: A stepwise linear regression model was used to develop a regression equation for predicting biomass using input variables from NASA's Land, Vegetation, and Ice Sensor (LVIS) and small footprint LiDAR data.
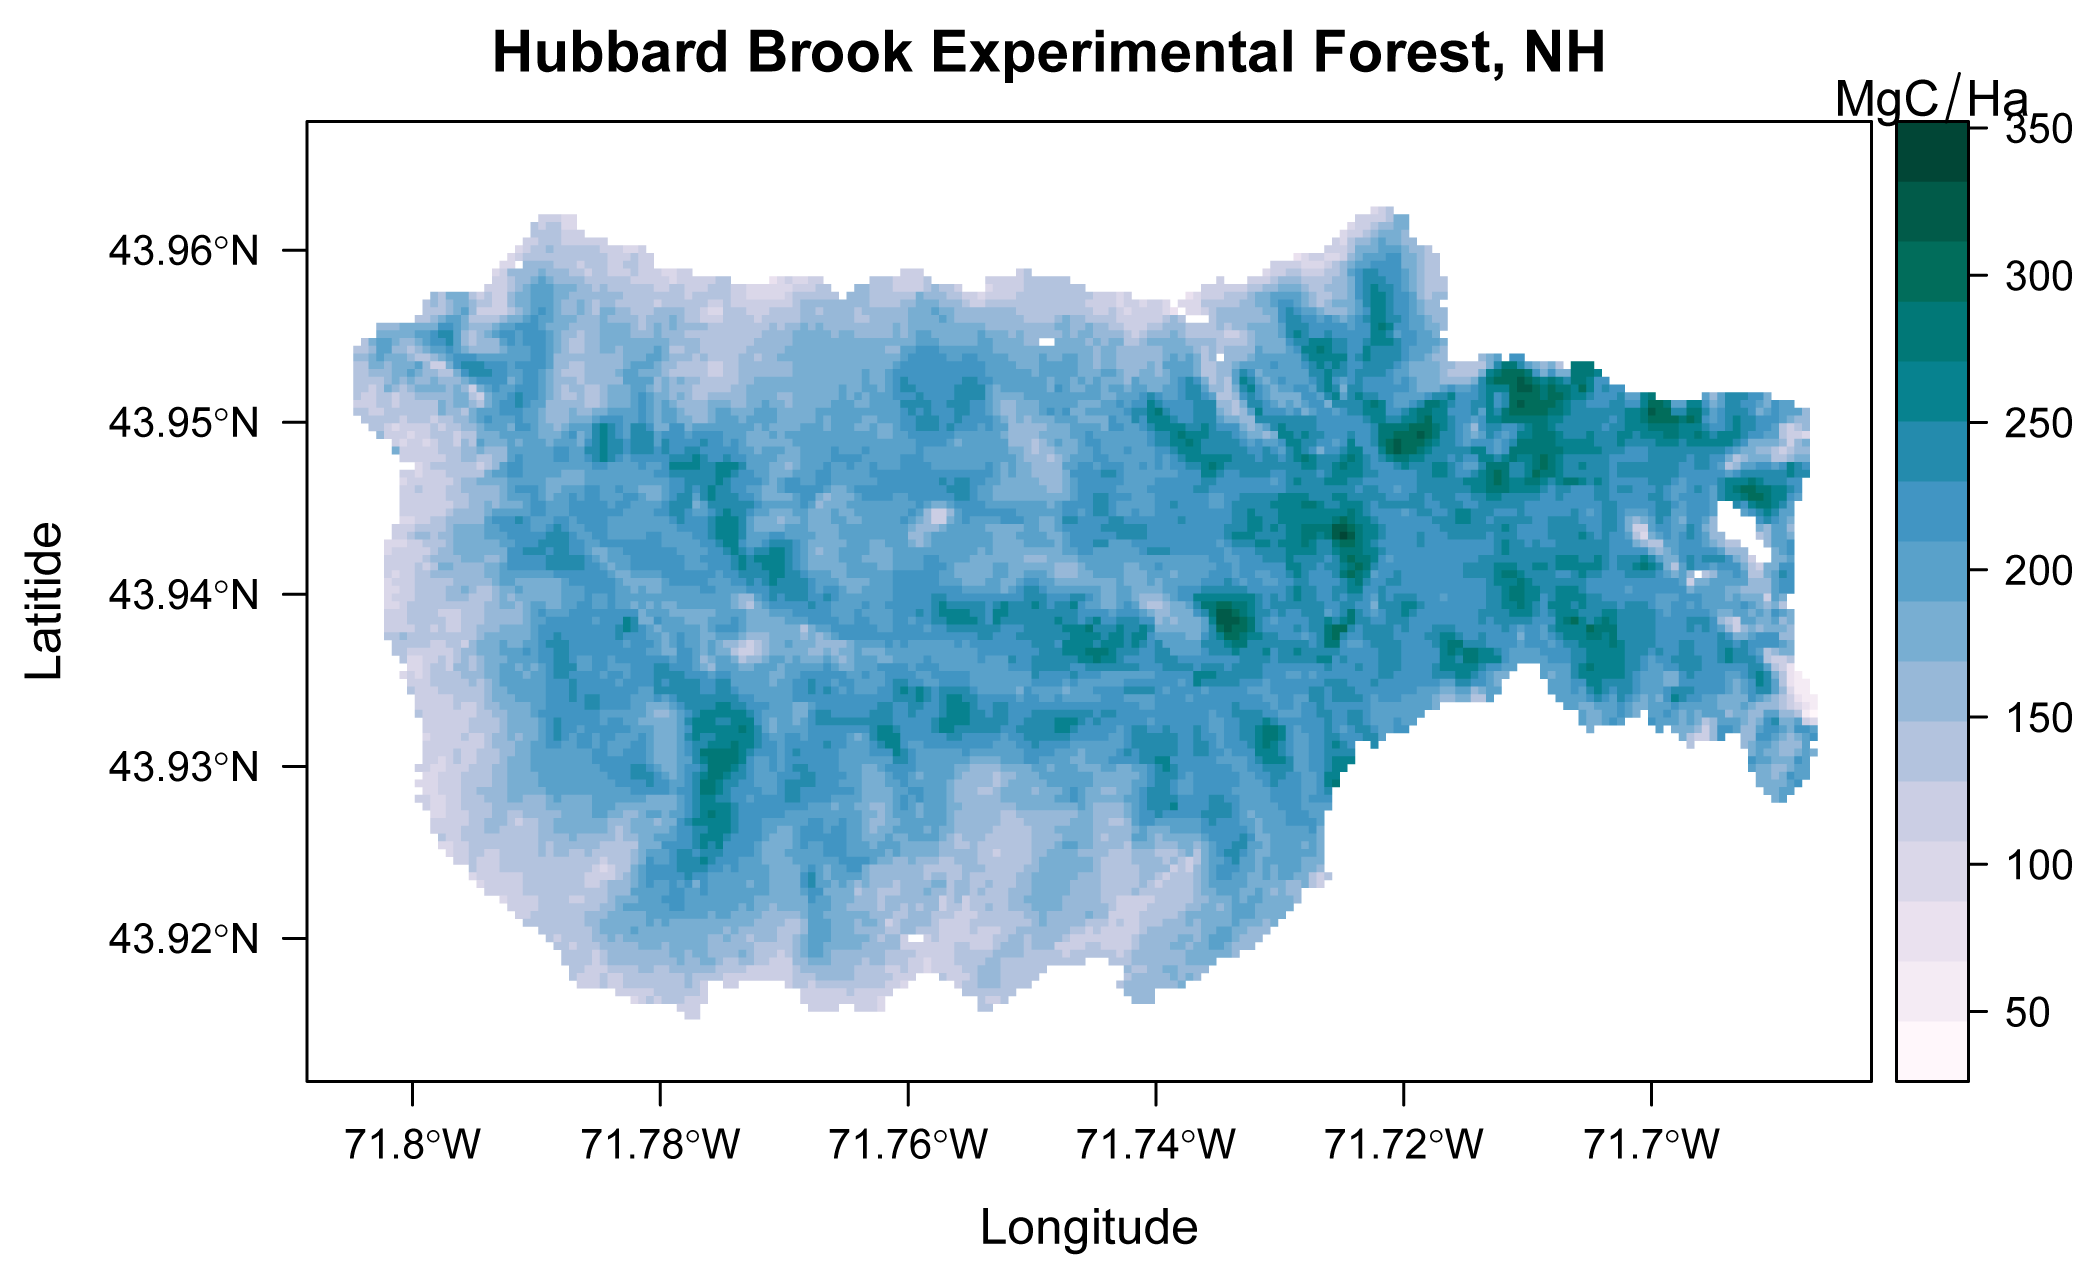
Figure 5. Estimated aboveground biomass (in Mg carbon per hectare) for the Hubbard Brook Experimental Forest, New Hampshire at 50-m spatial resolution.
6. Data Access:
This data is available through the Oak Ridge National Laboratory (ORNL) Distributed Active Archive Center (DAAC).
Data Archive Center:
Contact for Data Center Access Information:
E-mail: uso@daac.ornl.gov
Telephone: +1 (865) 241-3952
7. References:
Golinkoff, J., M. Hanus, J. Carah. 2011. The use of airborne laser scanning to develop a pixel-based stratification for a verified carbon offset project. Carbon Balance and Management 6:9. doi:10.1186/1750-0680-6-9