Documentation Revision Date: 2019-06-25
Dataset Version: 1
Summary
Field-based measurements of pCO2 were obtained from three vessels during a total of eight cruises. A regression tree algorithm was developed to relate field-based pCO2 observations to variables generated from satellite imagery, including the variables chlorophyll a (chlor_a), detrital and dissolved absorption at 443 nm (adg_443_gsm), and sea surface temperature (sat_sst). The estimates of pCO2 were used in conjunction with estimates of wind fields and atmospheric pCO2 to produce regional-scale estimates of air-sea CO2 fluxes.
There is a single data file in netCDF-4 (.nc) format.
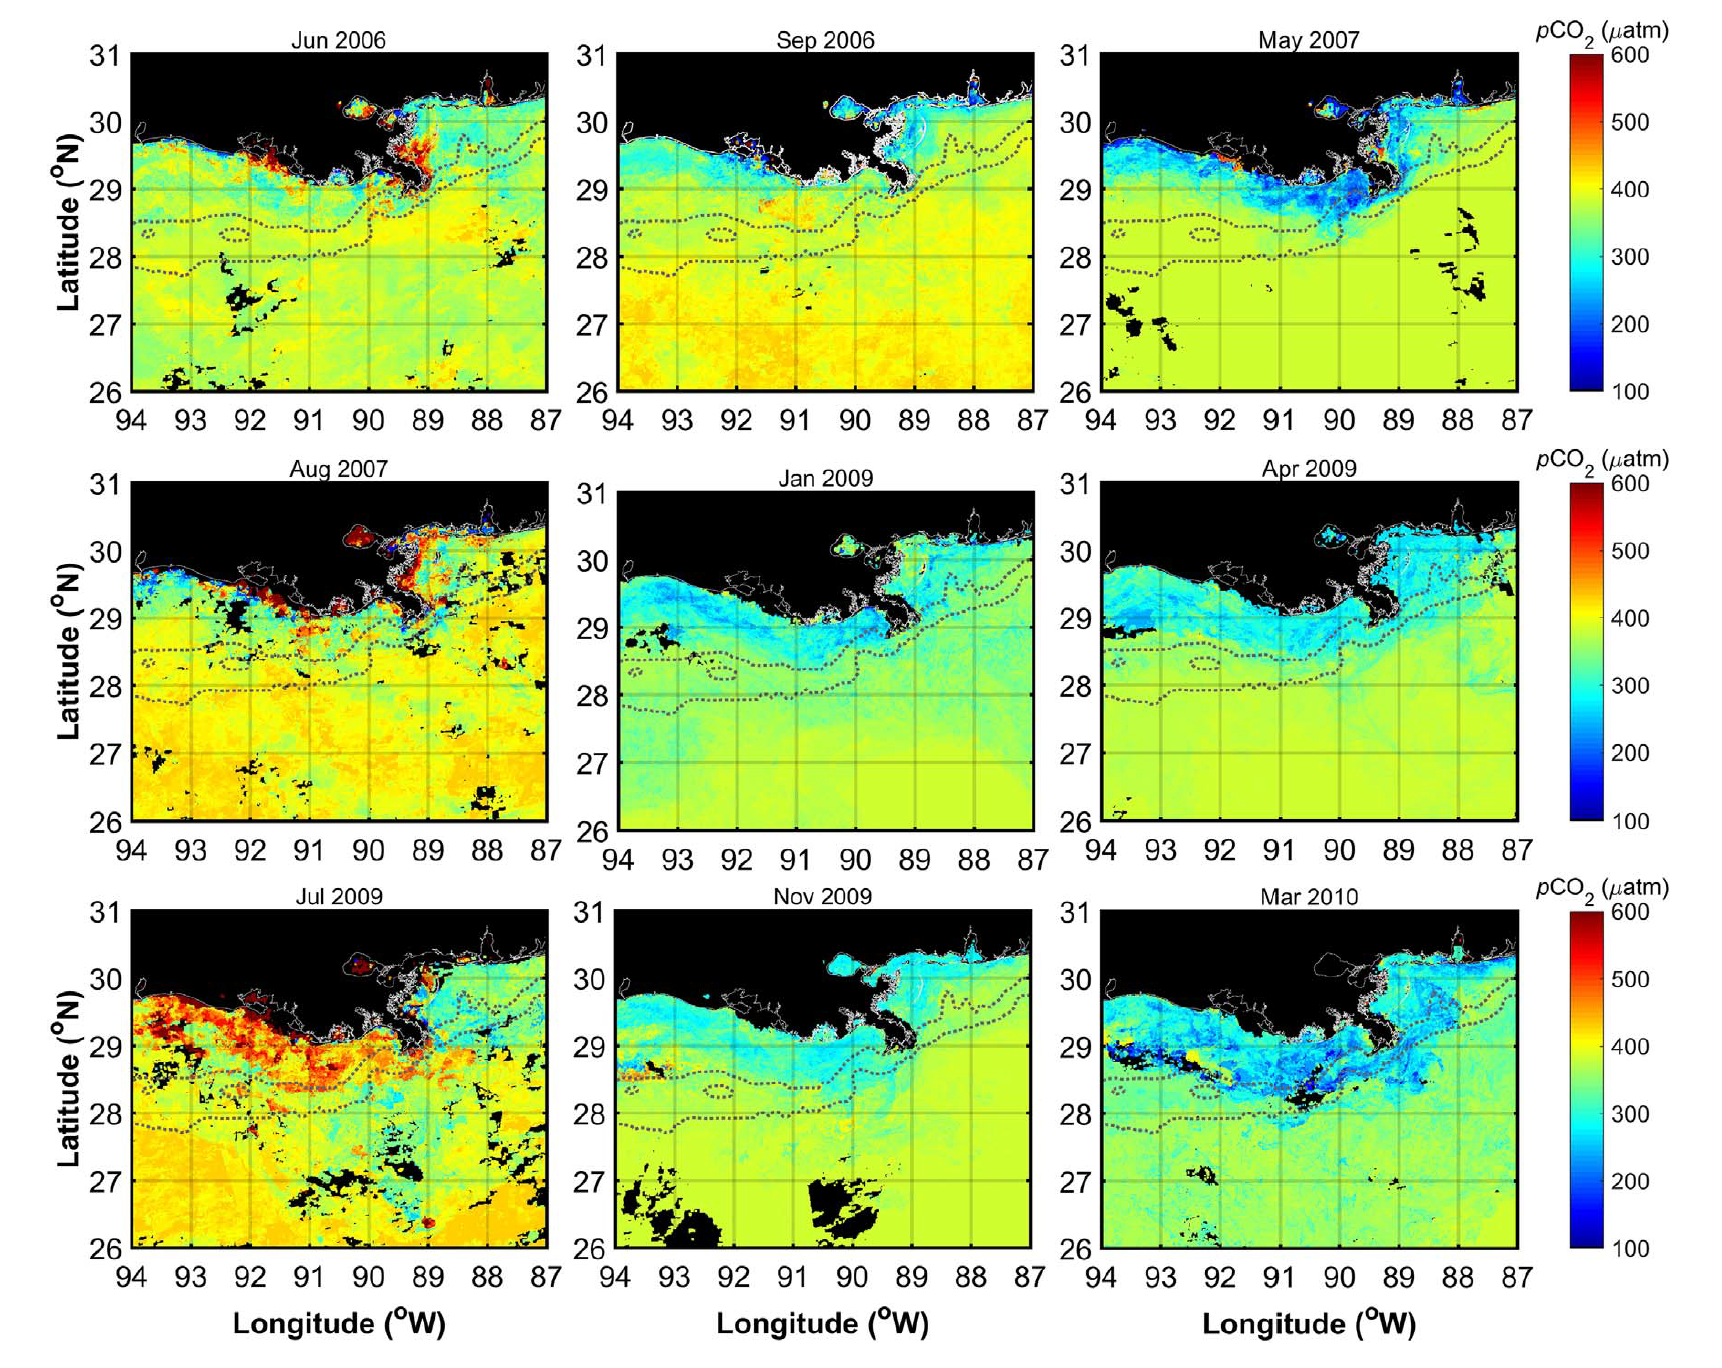
Figure 1. Monthly composite images of satellite-derived pCO2 for the northern Gulf of Mexico, corresponding to each of the cruises for which observational data were acquired. Black pixels in the images correspond to areas that were masked (e.g., land, clouds), and the dotted lines represent the 45 and 200 m isobaths. From Lohrenz et al. (2018).
Citation
Lohrenz, S.E., W.J. Cai, S. Chakraborty, R. He, and H. Tian. 2019. Ocean Surface pCO2 and Air-Sea CO2 Flux in the Northern Gulf of Mexico, 2006-2010. ORNL DAAC, Oak Ridge, Tennessee, USA. https://doi.org/10.3334/ORNLDAAC/1668
Table of Contents
- Dataset Overview
- Data Characteristics
- Application and Derivation
- Quality Assessment
- Data Acquisition, Materials, and Methods
- Data Access
- References
Dataset Overview
This dataset provides 1 km gridded monthly estimates of surface ocean partial pressure of CO2 (pCO2) and air-sea flux of CO2 (CO2 flux) for the northern Gulf of Mexico for the period 2006 through 2010. Estimates of pCO2 were derived from MODIS/Aqua satellite imagery in combination with ship-based observations. Estimates of CO2 flux were derived from estimates of seawater pCO2, wind fields, and atmospheric pCO2.
Field-based measurements of pCO2 were obtained from three vessels during a total of eight cruises. A regression tree algorithm was developed to relate field-based pCO2 observations to variables generated from satellite imagery, including the variables chlorophyll a (chlor_a), detrital and dissolved absorption at 443 nm (adg_443_gsm), and sea surface temperature (sat_sst). The estimates of pCO2 were used in conjunction with estimates of wind fields and atmospheric pCO2 to produce regional-scale estimates of air-sea CO2 fluxes.
Project: Carbon Monitoring System
The NASA Carbon Monitoring System (CMS) is designed to make significant contributions in characterizing, quantifying, understanding, and predicting the evolution of global carbon sources and sinks through improved monitoring of carbon stocks and fluxes. The System will use the full range of NASA satellite observations and modeling/analysis capabilities to establish the accuracy, quantitative uncertainties, and utility of products for supporting national and international policy, regulatory, and management activities. CMS will maintain a global emphasis while providing finer scale regional information, utilizing space-based and surface-based data and will rapidly initiate generation and distribution of products both for user evaluation and to inform near-term policy development and planning.
Related Publication:
Lohrenz, S. E., Cai, W. J., Chakraborty, S., Huang, W. J., Guo, X., He, R., Xue, Z., Fennel, K., Howden, S., Tian H., (2018). Satellite estimation of coastal pCO2 and air-sea flux of carbon dioxide in the northern Gulf of Mexico, Remote Sens Environ, 207:71-83, https://doi.org/10.1016/j.rse.2017.12.039
Related Dataset: He, R., and Z. Xue. 2017. CMS: Simulated Physical-Biogeochemical Data, SABGOM Model, Gulf of Mexico, 2005-2010. ORNL DAAC, Oak Ridge, Tennessee, USA. https://doi.org/10.3334/ORNLDAAC/1510
Acknowledgments:
This work was funded by NASA CMS grant NNX14AO73G.
Data Characteristics
Spatial Coverage: Northern Gulf of Mexico
Spatial Resolution: 1 km
Temporal Coverage: 2006-01-01 to 2011-01-01
Temporal Resolution: monthly
Study Area: (all latitudes and longitudes given in decimal degrees)
| Site | Westernmost Longitude | Easternmost Longitude | Northernmost Latitude | Southernmost Latitude |
|---|---|---|---|---|
| Northern Gulf of Mexico | -96 | -86 | 32 | 25 |
Data File Information:
There is a single data file in netCDF-4 (.nc) format: pco2_co2_flux.nc
For each variable, there are 60 observations (monthly average) collected over the period 2006-01-01 to 2011-01-01.
No data value: -9999
Coordinate reference system: EPSG 4326
Data Dictionary:
| Variable | Units/Format | Description |
|---|---|---|
| CO2_flux | mmol m-2 s-1 | surface upward mole flux of carbon dioxide, averaged for time and location |
| PCO2 | Pa | surface partial pressure of carbon dioxide in sea water, averaged for time and location |
| lat | degrees_north | latitude for center of a grid cell |
| lon | degrees_east | longitude for center of a grid cell |
| time | days since 2006-01-01 | days since January 1, 2006, representing the middle of each month |
| time_bnds | days since 2006-01-01 | days since January 1, 2006, representing the beginning and end of each month |
Application and Derivation
Uncertainties in coastal carbon fluxes are such that the net uptake of carbon in the coastal margins remains a poorly constrained term in global budgets. Satellite approaches for estimation of pCO2 and air-sea flux of CO2 in coastal regions offer the potential to reduce uncertainties in coastal carbon budgets and improve understanding of spatial and temporal patterns and the factors influencing them. In particular, these data contribute to knowledge of the seasonality and spatial heterogeneity in CO2 fluxes. From Lohrenz et al. (2018).
Quality Assessment
To evaluate model uncertainty for estimating pCO2, a cross-validation approach was used by randomly dividing the regression tree training data into ten subsets and training ten new trees, each one on nine parts of the data. The predictive accuracy of each new tree on the data not included in the training set was then examined to determine the prediction error.
To examine effects of collinearity between model variables, a separate analysis was conducted using orthogonal component variables derived from principal component analysis of the input variables. Additionally, the performance of the algorithm trained using standard resolution (1.1 km) rather than the quasi-250 m resolution satellite products was examined. From Lohrenz et al. (2018).
Data Acquisition, Materials, and Methods
Study Region
The study region includes the coastal margin and outer continental shelf of slope of the central northern Gulf of Mexico, including areas influenced by the Mississippi and Atchafalaya River plumes. The Mississippi and Atchafalaya River System has been ranked as the seventh largest freshwater discharge system in the world. Descriptions of field observations and derivations of pCO2 and CO2 flux are excerpted from Lohrenz et al. (2018).

Figure 2. The study region in the northern Gulf of Mexico illustrating the bathymetry (upper panel) and representative ship tracks for the 2006–2007 (magenta line) and 2009–2010 (yellow line) cruises overlaid on a true color MODIS/Aqua image from 14 April 2009. From Lohrenz et al. (2018).
Field Observations
In situ data were obtained during a series of shelf-wide cruises that encompassed inner to outer shelf water mass regimes and were representative of different seasonal and river discharge conditions. The cruise vessels and dates are as follows:
- U.S. Environmental Protection Agency Ocean Survey Vessel Bold
- 6–11 June 2006
- 6–11 September 2006
- 2–8 May 2007
- 18–24 August 2007
- R/V Cape Hatteras
- 8–20 January 2009
- 19 April–1 May 2009
- 18–30 July 2009
- 10–22 March 2010
- R/V Hugh G. Sharp
- 28 October–9 November 2009
Underway determinations of sea surface pCO2 were made by directing flow from the ship's flow-through to a shower head equilibrator plus infrared detector system. Ship-based observations of sea surface salinity and temperature were measured using a Seabird SBE-45 flow-through thermosalinograph.
Partial Pressure of Carbon Dioxide Estimation
MODIS/Aqua imagery was acquired from the NASA Ocean Biology Distributed Active Archive Center (OB.DAAC) at Goddard Space Flight Center. Level 0 (L0) files were processed to quasi-250 m resolution Level 2 (L2) products using the SeaDAS data analysis system version 7.3.3. The satellite products and field-based underway measurements of pCO2 (made within 6 hours of image acquisition) were co-located within a 3 x 3 pixel window.
A regression tree (machine-learning) algorithm was developed to determine the empirical relationship between
field-based pCO2 observations and variables generated as L2 products. The satellite products chlorophyll a (chlor_a), detrital and dissolved absorption at 443 nm (adg_443_gsm), and sea surface temperature (sat_sst) were selected as model variables for all subsequent analyses. The satellite products were processed to 1.1 km resolution Level 3 (L3) daily products, and then the algorithm was applied to those products to derive daily estimates of pCO2.
A time-series of pCO2 imagery was developed using the daily pCO2 estimates averaged over 8-day intervals. Comparisons were made for means for inner shelf (< 45 m), shelf (< 200 m), and open Gulf waters to data from the Surface Ocean Carbon Atlas (SOCAT) for the same regions and time periods, and to modeled simulations of pCO2 from Xue et al. (2016).
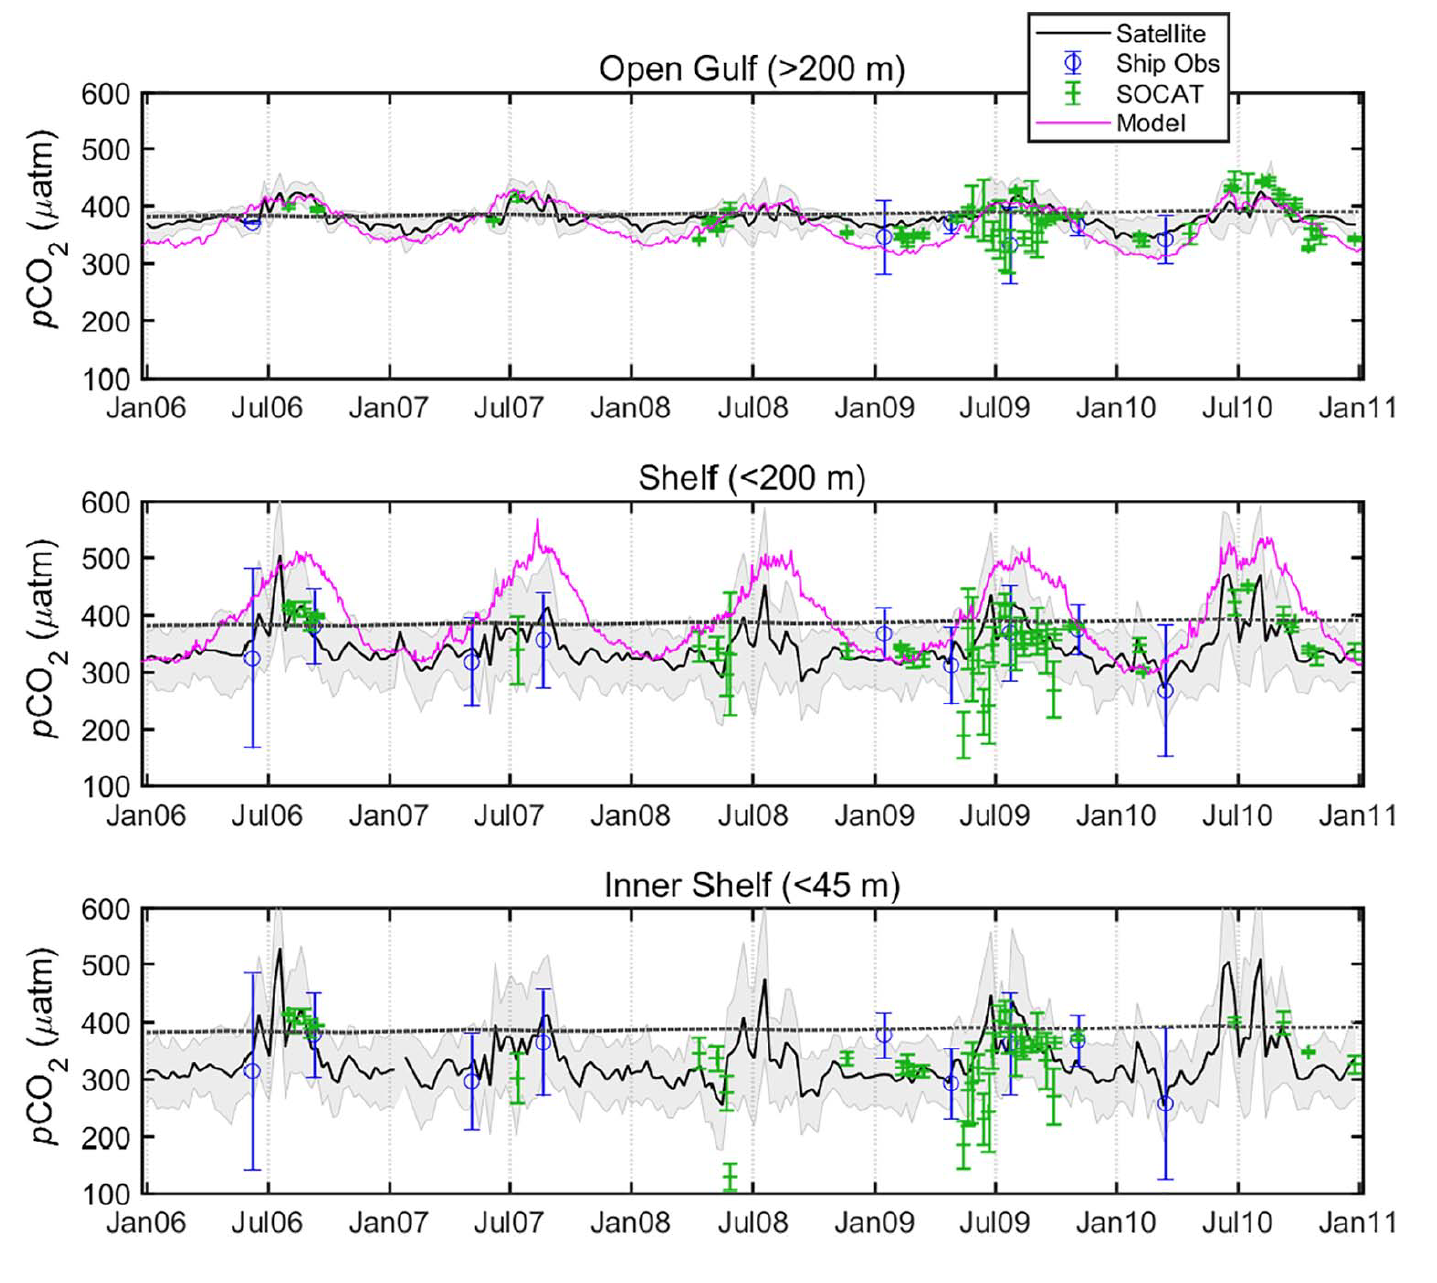
Figure 3. Time-series of surface water pCO2 derived from a satellite algorithm (solid black line) trained using ship-based observations (blue open symbols) and compared to independent observations for the same region from the SOCAT database (green symbols), and to mode simulations of pCO2 from Xue et al. (2016) (magenta line). Shaded areas are plus or minus one standard deviation around the mean satellite-derived pCO2. Symbol error bars also represent plus or minus one standard deviation around the mean. The dashed line represents the atmospheric pCO2. From Lohrenz et al. (2018).
Air-sea Flux of Carbon Dioxide Estimation
The air-sea flux of carbon dioxide was calculated from an equation including the gas transfer velocity of CO2, the solubility coefficient of CO2 at the in situ temperature and salinity, the water-saturated partial pressures of CO2 in seawater (i.e., the pCO2 estimates described above) and the water-saturated partial pressures of CO2 in air. The gas transfer velocity of CO2 was estimated for each 8-day period using satellite wind data (Cross-Calibrated Multi-Platform Ocean Surface Wind Vector L3.0 6 h, 0.25° resolution) acquired from the NASA Physical Oceanography Distributed Active Archive. The water-saturated partial pressure of CO2 in air was calculated by converting the air mole fraction of CO2 (xCO2) acquired from the Atmospheric Infrared Sounder (AIRS) to the water-saturated partial pressure of CO2 in air using the climatological monthly mean barometric pressure at sea surface available from the NCEP Reanalysis and the surface seawater vapor pressure at sea surface temperature and salinity as described in Lohrenz et al. (2018).

Figure 4. Estimates of sea-to-air flux of CO2 derived from the estimates of pCO2 and a wind parameterization. The shaded areas in the top two panels represent plus or minus one standard deviation around the mean. The circle symbols are shelf values (the mean of their inner, middle and outer estimates) from Huang et al. (2015a, 2015b) for comparison. The vertical black arrow indicates the period of strong uptake of CO2 during March 2010. Combined river discharge and dissolved inorganic nitrogen (DIN) loading from the Mississippi and Atchafalaya rivers are provided in the bottom panel for comparison. From Lohrenz et al. (2018).
Data Access
These data are available through the Oak Ridge National Laboratory (ORNL) Distributed Active Archive Center (DAAC).
Ocean Surface pCO2 and Air-Sea CO2 Flux in the Northern Gulf of Mexico, 2006-2010
Contact for Data Center Access Information:
- E-mail: uso@daac.ornl.gov
- Telephone: +1 (865) 241-3952
References
Huang, W.-J., Cai, W.-J., Wang, Y., Lohrenz, S.E., Murrell, M.C., 2015a. The carbon dioxide system on the Mississippi River-dominated continental shelf in the northern Gulf of Mexico: 1. distribution and air-sea CO2 flux. J. Geophys. Res. Oceans 120, 1429–1445. https://doi.org/10.1002/2014JC010498
Huang, W.-J., Cai, W.J., Wang, Y., Hu, X., Chen, B., Lohrenz, S.E., Chakraborty, S., He, R., Brandes, J., Hopkinson, C.S., 2015b. The response of inorganic carbon distributions and dynamics to upwelling-favorable winds on the northern Gulf of Mexico during summer. Cont. Shelf Res. 111 (Part B), 211–222. https://doi.org/10.1016/j.csr.2015.08.020
Lohrenz, S. E., W. J. Cai, S. Chakraborty, W. J. Huang, X. Guo, R. He, Z. Xue, K. Fennel, S. Howden, and H. Tian (2018), Satellite estimation of coastal pCO2 and air-sea flux of carbon dioxide in the northern Gulf of Mexico, Remote Sensing of Environment, 207, 71-83, https://doi.org/10.1016/j.rse.2017.12.039
He, R., and Z. Xue. 2017. CMS: Simulated Physical-Biogeochemical Data, SABGOM Model, Gulf of Mexico, 2005-2010. ORNL DAAC, Oak Ridge, Tennessee, USA. https://doi.org/10.3334/ORNLDAAC/1510