Documentation Revision Date: 2019-11-13
Dataset Version: 2
Summary
There are 9 files in GeoTIFF (.tif) format included in this dataset.
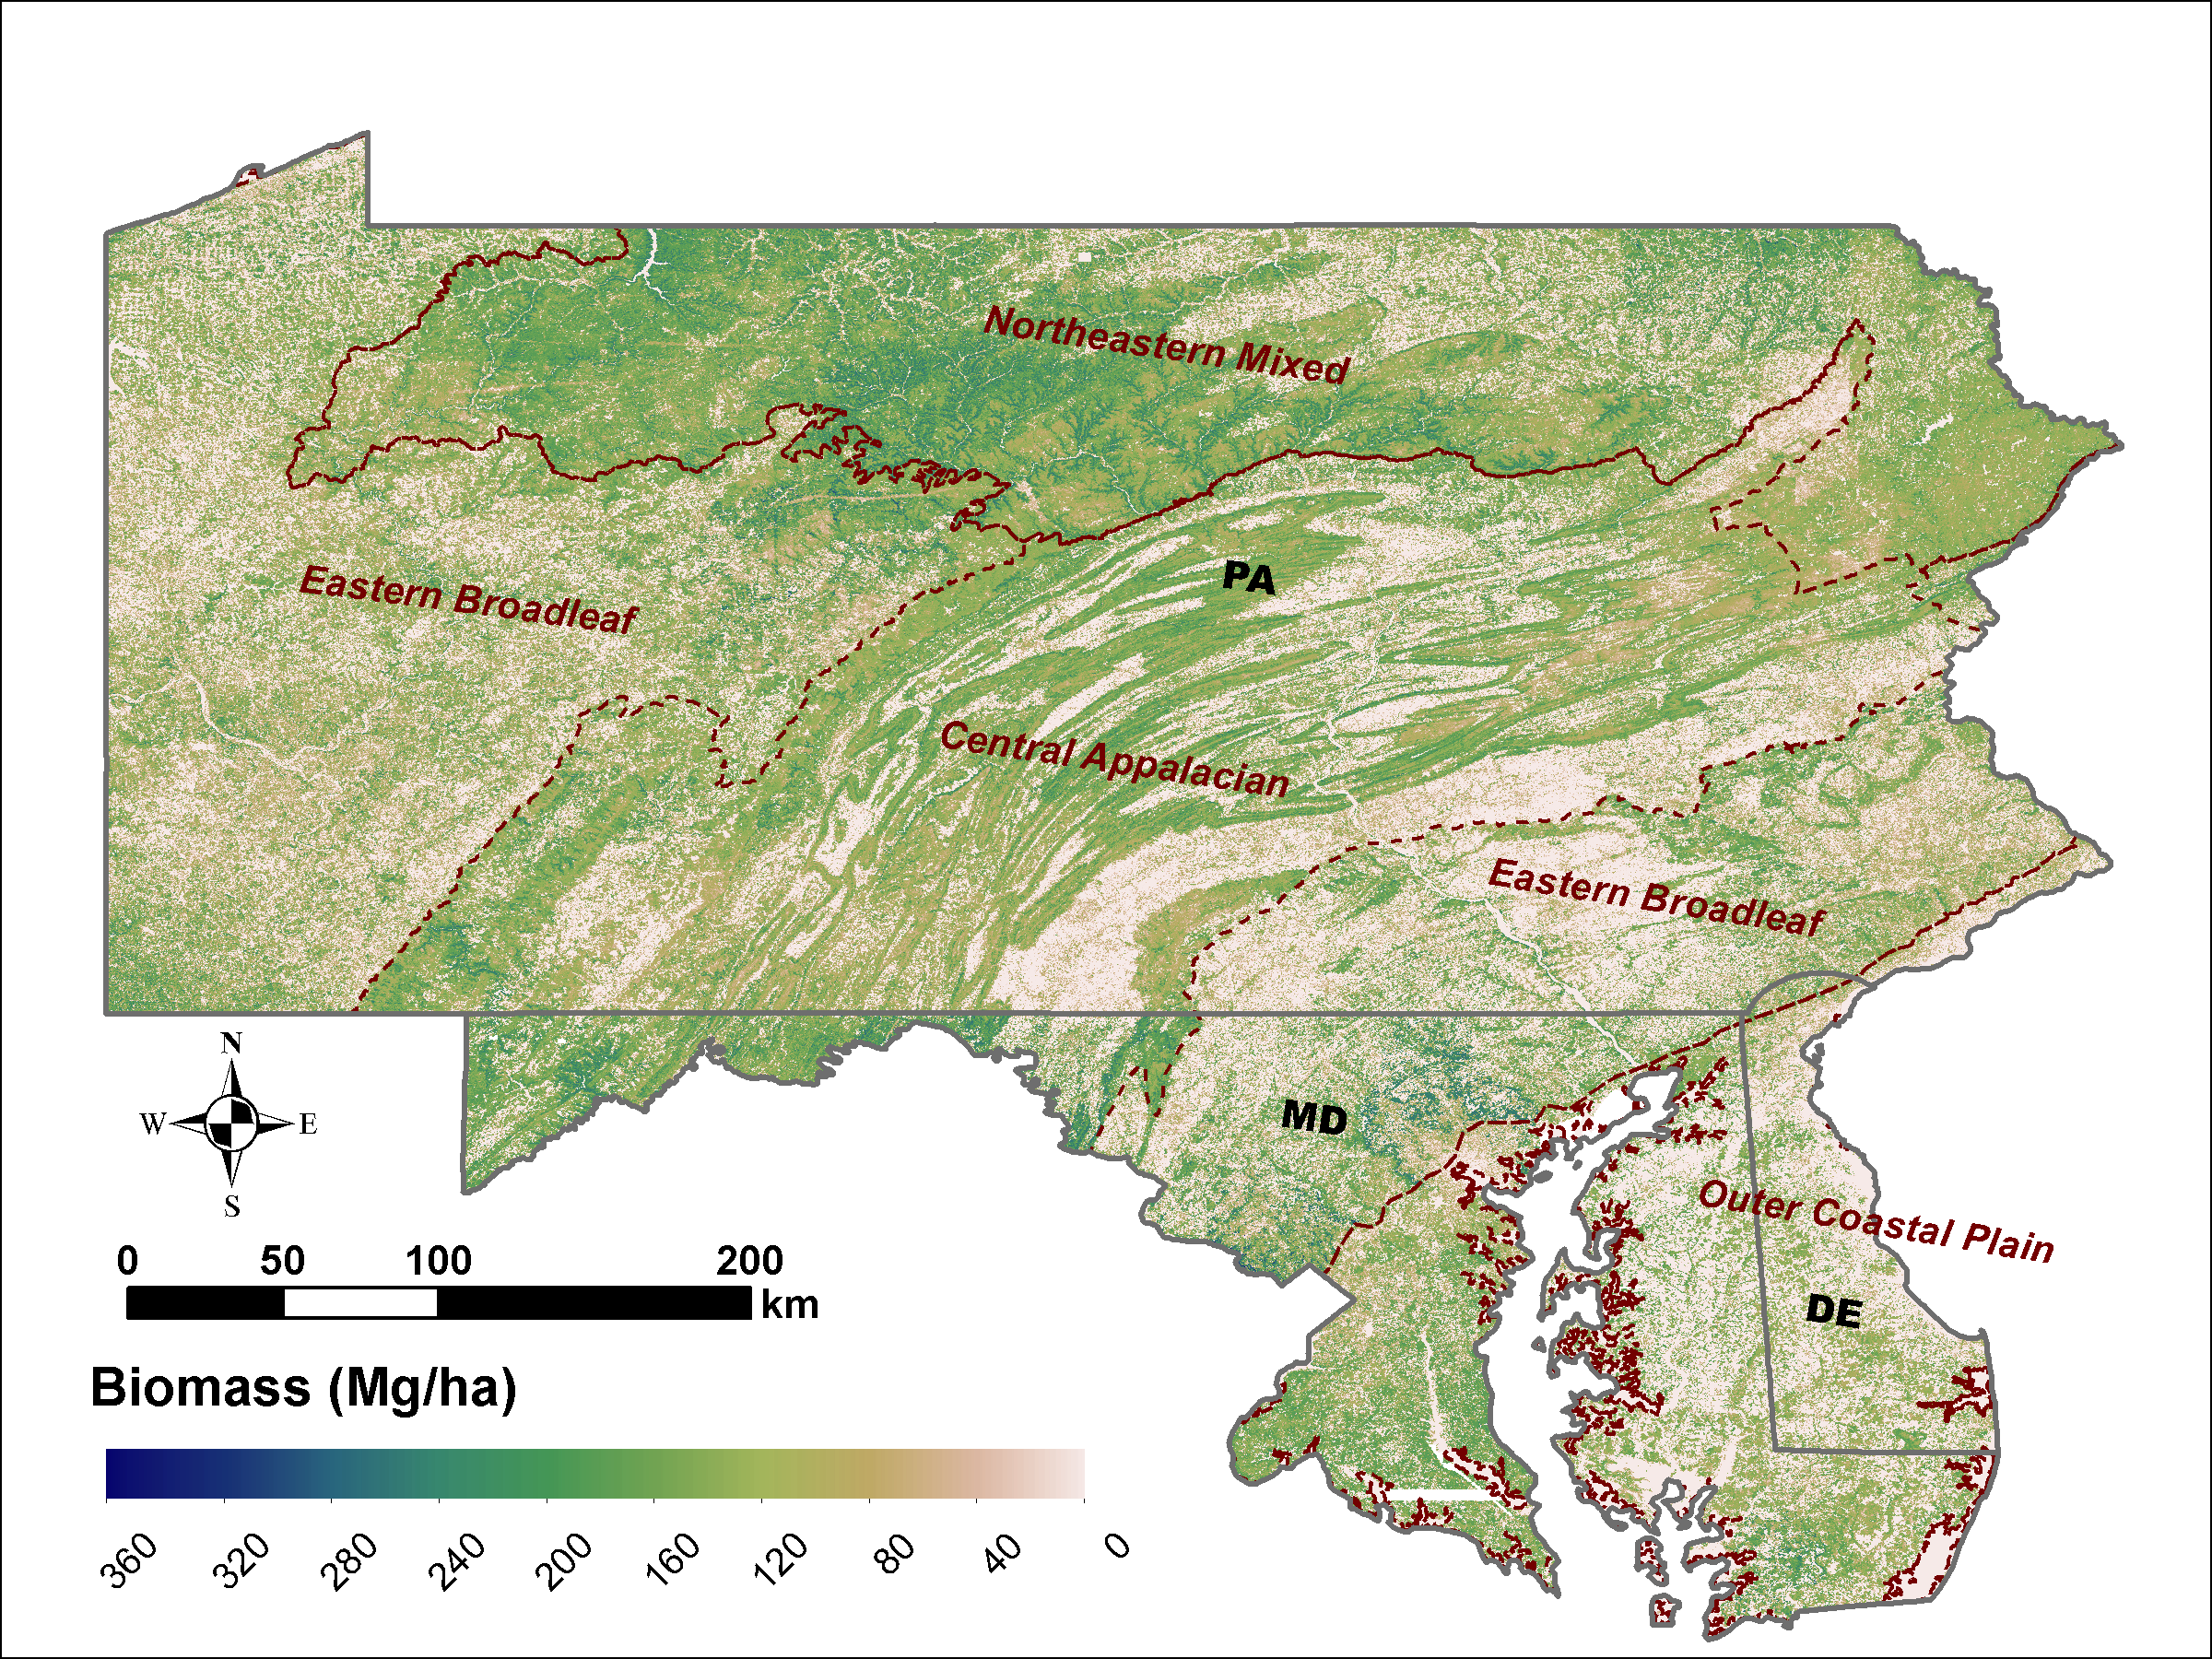
Figure 1. Aboveground biomass (Mg ha-1) at 30-m resolution for the tri-state region of Maryland, Pennsylvania, and Delaware in 2011.
Citation
Dubayah, R.O., A. Swatantran, W. Huang, L. Duncanson, K. Johnson, H. Tang, J. O'Neil-Dunne, and G.C. Hurtt. 2018. LiDAR Derived Biomass, Canopy Height and Cover for Tri-State (MD, PA, DE) Region, V2. ORNL DAAC, Oak Ridge, Tennessee, USA. https://doi.org/10.3334/ORNLDAAC/1538
Table of Contents
- Dataset Overview
- Data Characteristics
- Application and Derivation
- Quality Assessment
- Data Acquisition, Materials, and Methods
- Data Access
- References
- Dataset Revisions
Dataset Overview
This dataset provides 30-meter gridded estimates of aboveground biomass (AGB), canopy height, and canopy coverage for the Maryland, Pennsylvania, and Delaware in 2011. Leaf-off LiDAR data were combined with high-resolution leaf-on agricultural imagery in a model-based stratification that was used to select 848 sampling sites for AGB estimation. Field-based estimates were then related to LiDAR height and volume metrics through random forest regression models across three physiographic regions. Spatial errors were estimated at the pixel level using standard prediction intervals to assess the accuracy of the modeling approach. Estimates of biomass were further validated against the permanent network of FIA plots and compared with existing coarse resolution national biomass maps.
Project: Carbon Monitoring System
The NASA Carbon Monitoring System (CMS) is designed to make significant contributions in characterizing, quantifying, understanding, and predicting the evolution of global carbon sources and sinks through improved monitoring of carbon stocks and fluxes. The System will use the full range of NASA satellite observations and modeling/analysis capabilities to establish the accuracy, quantitative uncertainties, and utility of products for supporting national and international policy, regulatory, and management activities. CMS will maintain a global emphasis while providing finer scale regional information, utilizing space-based and surface-based data and will rapidly initiate generation and distribution of products both for user evaluation and to inform near-term policy development and planning.
Related Publication:
Huang, W., Dolan, K.A., Swatantran, A., Johnson, K.D., Tang, H., ONeil-Dunne, J., Dubayah, R. and Hurtt, G., 2019. High-resolution mapping of aboveground biomass for forest carbon monitoring system in the Tri-State region of Maryland, Pennsylvania and Delaware, USA. Environmental Research Letters. https://doi.org/10.1088/1748-9326/ab2917
Related Data:
Cook, B., A. Swatantran, L. Duncanson, A. Armstrong, N. Pinto, R. Nelson. 2014. CMS: LiDAR-derived Estimates of Aboveground Biomass at Four Forested Sites, USA. ORNL DAAC, Oak Ridge, Tennessee, USA. https://doi.org/10.3334/ORNLDAAC/1257
Hagen, S., N. Harris, S.S. Saatchi, T. Pearson, C.W. Woodall, S. Ganguly, G.M. Domke, B.H. Braswell, B.F. Walters, J.C. Jenkins, S. Brown, W.A. Salas, A. Fore, Y. Yu, R.R. Nemani, C. Ipsan, and K.R. Brown. 2016. CMS: Forest Carbon Stocks, Emissions, and Net Flux for the Conterminous US: 2005-2010. ORNL DAAC, Oak Ridge, Tennessee, USA. https://doi.org/10.3334/ORNLDAAC/1313
Kellndorfer, J., W. Walker, K. Kirsch, G. Fiske, J. Bishop, L. Lapoint, M. Hoppus, and J. Westfall. 2013. NACP Aboveground Biomass and Carbon Baseline Data, V.2 (NBCD 2000), U.S.A., 2000. ORNL DAAC, Oak Ridge, Tennessee, USA. https://doi.org/10.3334/ORNLDAAC/1161
Acknowledgements:
Funding for this work came from the NASA Carbon Monitoring System (CMS) project (NNX12AN07g - PI, Ralph Dubayah). The data for canopy cover, canopy height and biomass were developed through a collaboration between the University of Maryland, the University of Vermont, and the USDA Forest Service.
Data Characteristics
Spatial Coverage: Maryland, Pennsylvania, Delaware
Spatial Resolution: 30-meter or 90-meter
Temporal Resolution: Annual
Temporal Coverage: 2004-01-01 to 2014-12-31
Study Area: (These coordinates are the approximate locations of the study sites and may not match the extent of the data files. All latitude and longitude are given in decimal degrees.)
| Site | Northern Extent | Southern Extent | Eastern Extent | Western Extent |
|---|---|---|---|---|
| MD, PA, DE | 42.71 | 37.80 | -74.02 | -81.22 |
Data File Information
There are nine data files in GeoTIFF (.tif) format included in this dataset. The 30-meter resolution maps depict aboveground biomass, canopy height, and percent tree cover for the states of Maryland, Pennsylvania, and Delaware. Also included are spatial representations of estimated uncertainty and data coverage. All biomass data are given in units of megagrams (Mg) per hectare and the canopy height data is in meters. Descriptions of the files are included in Table 2.
Table 2. File descriptions
| Filename | Description | Values | Scale Factor | Fill | Resolution |
|---|---|---|---|---|---|
| TriState_Biomass_v4e_rf_fia_jks_ht50_90m.tif | Aboveground biomass below 50-m canopy height | UInt16 | 1.0 | 9999 | 90-m |
| TriState_BiomassJKS_QRF_High_30m.tif | 95th percentile of mean AGB (Mg/ha) | UInt16 | 1.0 | 9999 | 30-m |
| TriState_BiomassJKS_QRF_Low_30m.tif | 5th percentile of mean AGB (Mg/ha) | UInt16 | 1.0 | 9999 | 30-m |
| TriState_BiomassJKS_RF_Predicts_30m.tif | Aboveground biomass (Mg/ha) | UInt16 | 1.0 | 9999 | 30-m |
| TriState_CanopyHeight_Mean_30m.tif | Canopy height (m) | UInt16 | 0.1 | 9999 | 30-m |
| TriState_LidarYear_30m.tif | LiDAR survey year | 20## | 1 | 255 | 30-m |
| TriState_LidarCoverage_30m.tif | 30-m LiDAR coverage mask | 0 or 1 | 1 | 255 | 30-m |
| TriState_LidarCoverage_90m.tif | 90-m LiDAR coverage mask | 0 or 1 | 1 | 3 | 90-m |
| TriState_TreeCover_Percent_30m.tif | Tree canopy coverage | 0-100 | 1 | 255 | 30-m |
Application and Derivation
The approach used to generate this dataset can be replicated to provide accurate, unbiased AGB estimates at fine spatial resolution in other areas with LiDAR data coverage. High-resolution maps of AGB provide a valuable bottom-up reference to improve the analysis and interpretation of large-scale maps produced through NASA's CMS project.
Huang et al. (2015) demonstrated this type of application by comparing the modeled biomass data for the state of Maryland with four national biomass products to evaluate their accuracy: (1) the NBCD2000 (http://doi.org/10.3334/ORNLDAAC/1161), and maps developed by (2) Blackard et al. (2008), (3) Wilson et al. (2013), and (4) Hagen et al. (http://doi.org/10.3334/ORNLDAAC/1313). Each biomass map was aggregated to 500-m, 1-km, and 4-km resolutions for comparison at the pixel, county, and state levels for forested and non-forested areas. Spatial patterns of biomass were broadly consistent in all maps, but the accuracy assessment revealed large differences at fine scales. Discrepancies reduce with aggregation and the agreement of the modeled biomass product improves at the county level. Further details of their analysis can be found in Huang et al. (2015).
Quality Assessment
Uncertainty in the AGB estimates derives from multiple factors, including, but not limited to: field sampling errors and uneven spatial distribution, uncertainty in remote-sensing data products, choice of grid cell size, and model error. Random forest is a well-known machine learning procedure widely employed in biomass estimation. It suffers from a common problem of underestimation of high biomass values. To overcome this limitation and to provide robust error bounds, a quantile random forest approach was utilized that allows for error bounds to be predicted. This approach was evaluated in a pilot study for two Maryland counties. The resulting data set is available at the ORNL DAAC (http://doi.org/10.3334/ORNLDAAC/1257).
Spatially-gridded estimates of the upper and lower bounds of the 95% confidence interval of the mean are provided at 30-m spatial resolution as part of this data set.
Data Acquisition, Materials, and Methods
The biomass map was generated using the LiDAR data and field estimates from 848 variable and fixed radius plots selected through stratified sampling of the National Land Cover Database (NLCD) for 2011 (Homer et al. 2015). The map in Figure 2 depicts the year that the LiDAR surveys were conducted for different areas in each state. Tree measurements of diameter at breast height were recorded in each plot. Allometric estimates of aboveground biomass (Mg ha-1) were calculated for each tree using equations from Jenkins et al. (2003) and appropriate blow up factors were applied to estimate biomass density for the variable radius plots. Model validation was performed through local comparisons with FIA data. Field sample data will be made available in forthcoming data sets.
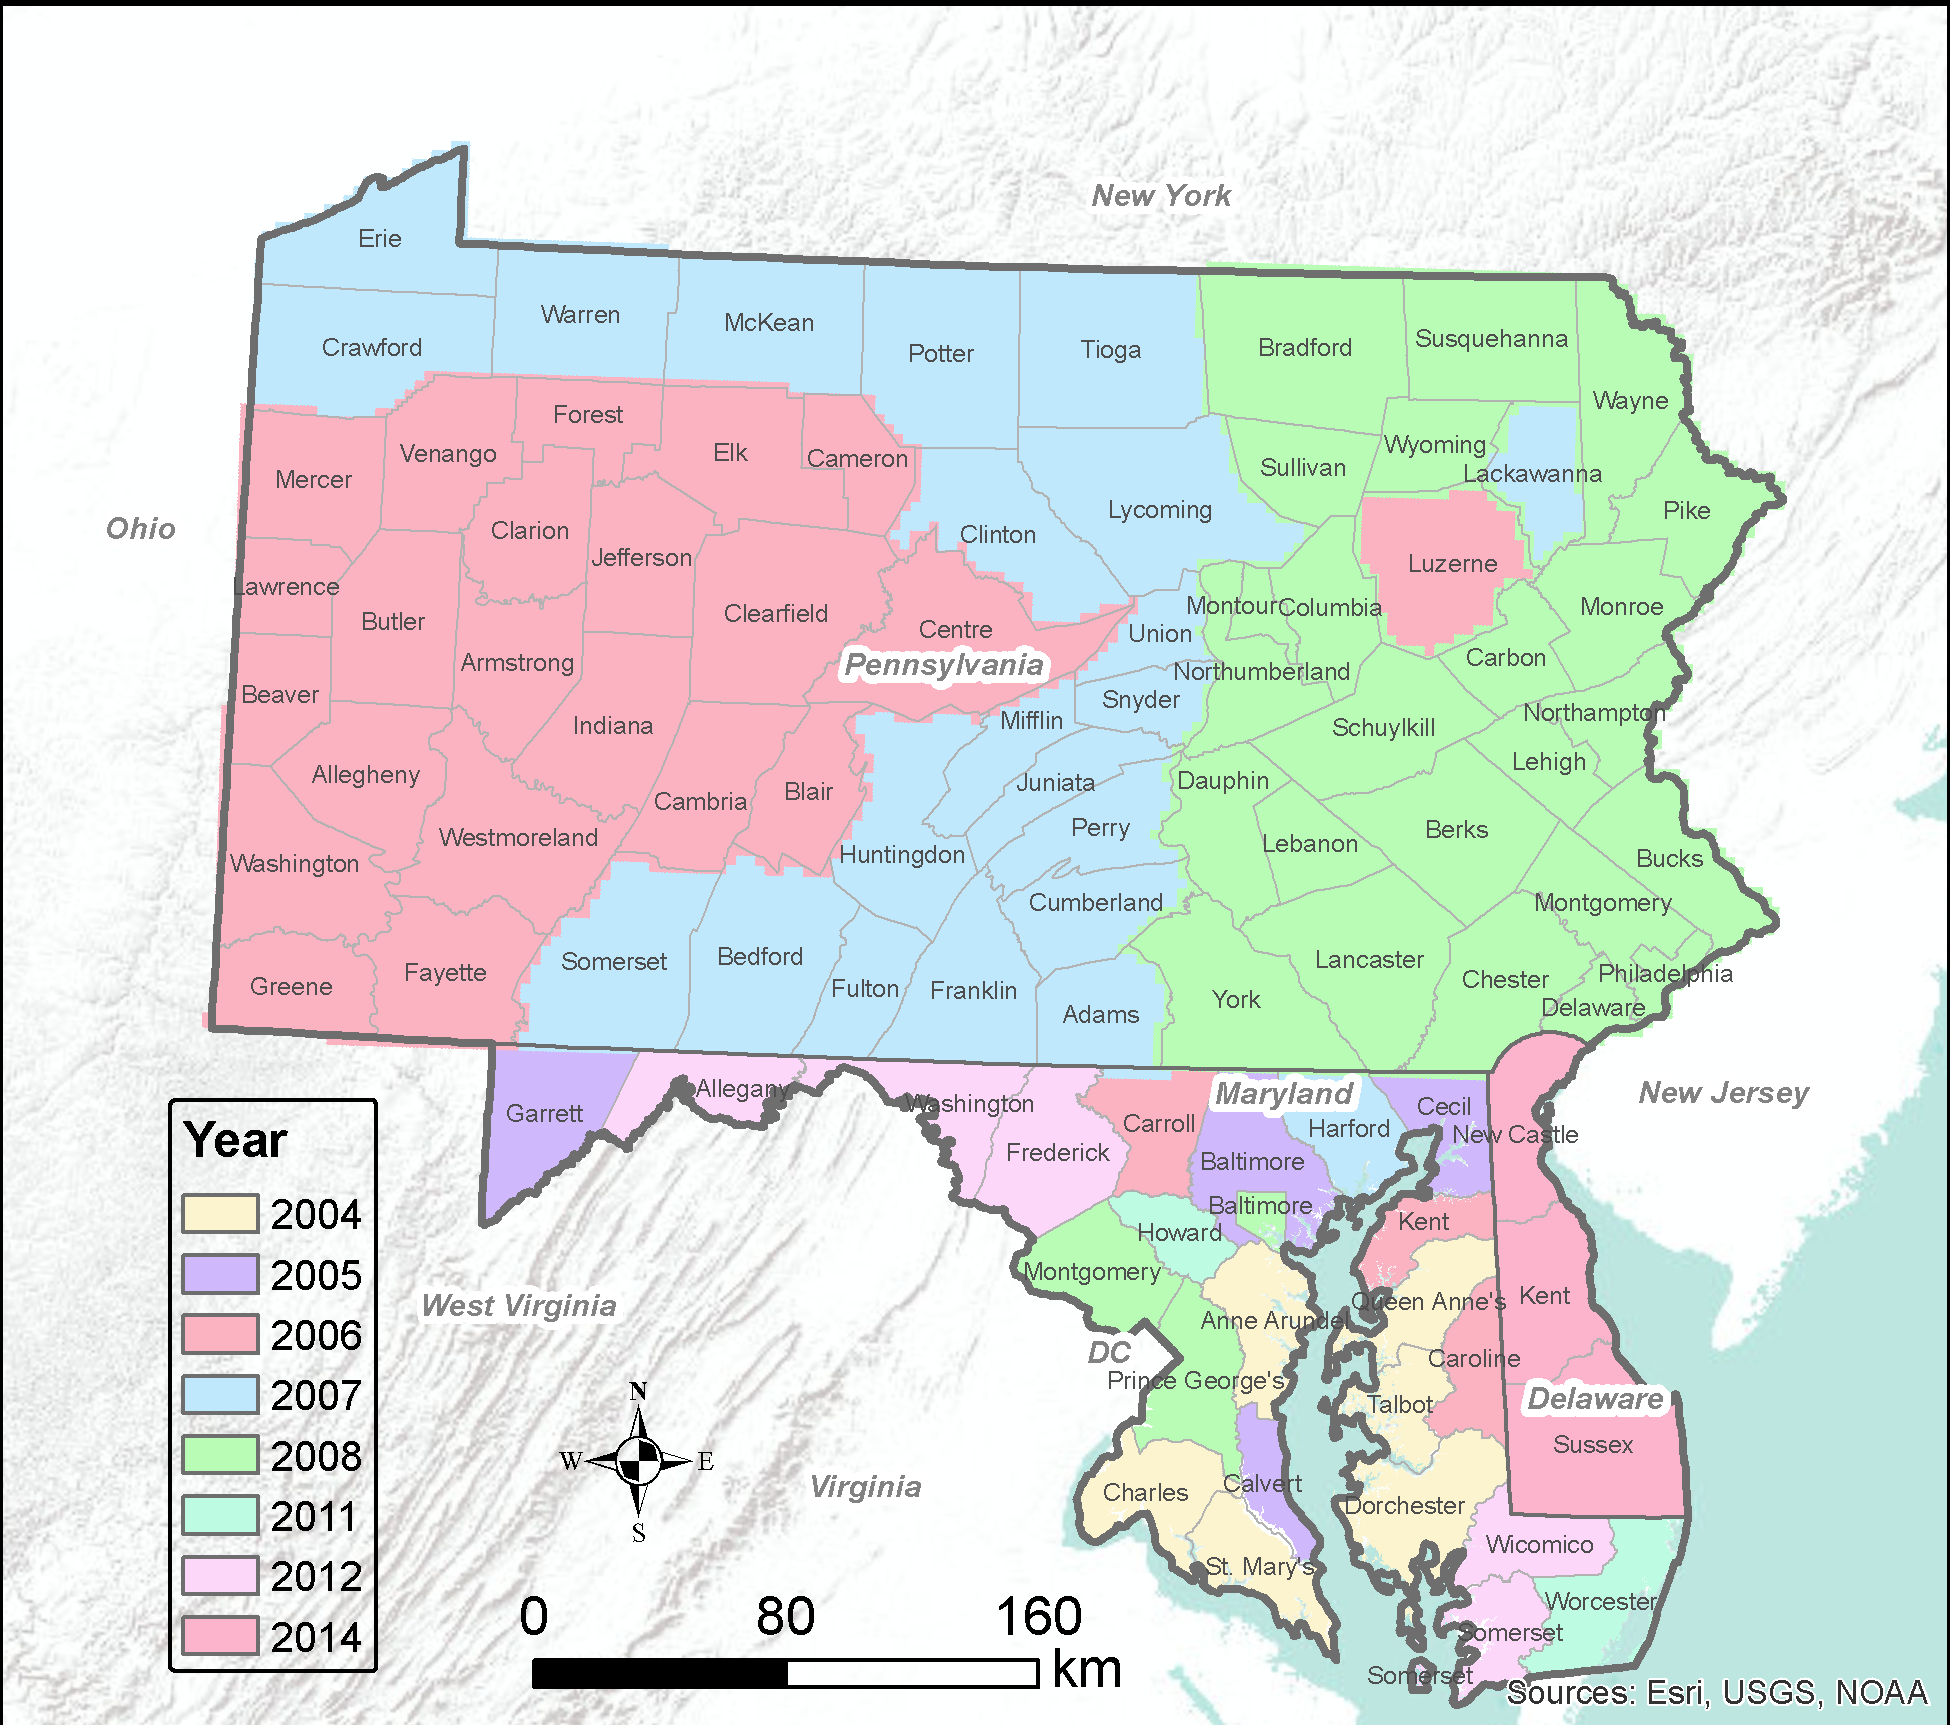
Figure 2. LiDAR acquisition year
Field-based estimates of biomass were then related to the LiDAR metrics using Random Forests regression models. Three separate models were applied to predict biomass for three distinct physiographic regions based on species-composition and environmental gradients: (1) the Eastern Coastal Plain, (2) the combined Western Coastal Plain and Piedmont, and (3) the combined blue Ridge, Valley, and Central Appalachians. Predictions over individual counties within each physiographic region were merged to produce the statewide biomass map at 30-meter resolution (Huang et al., 2015). A generalized workflow for these methods and how they relate to national mapping efforts is depicted below in Figure 2.
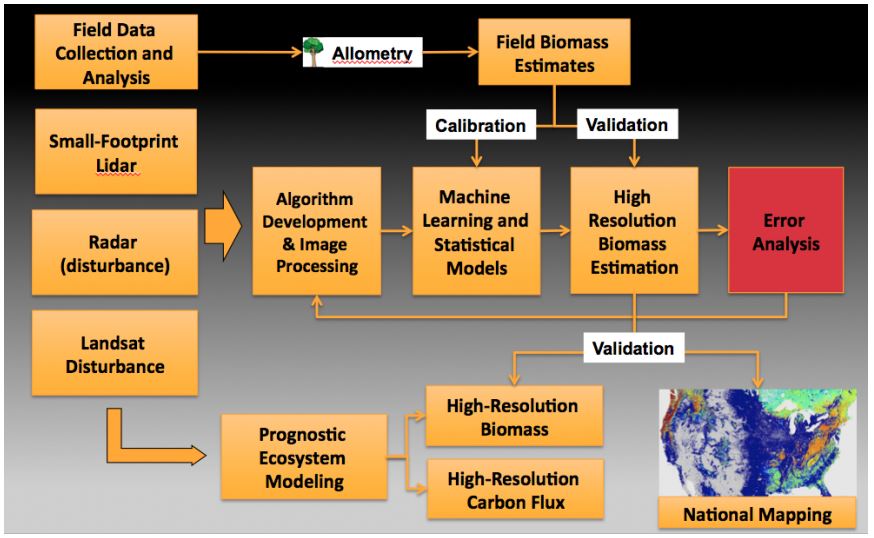
Figure 3. Overall methodology for integrating local-scale field and remote sensing measurements and their relationship to national mapping efforts, from Huang et al. (2015).
Tree canopy height and forest cover were mapped at 1-meter resolution using the first and last returns within the LiDAR data. Heights for forested areas within each pixel were then aggregated to create a percentile height distribution within 30-meter pixels.
Data Access
These data are available through the Oak Ridge National Laboratory (ORNL) Distributed Active Archive Center (DAAC).
LiDAR Derived Biomass, Canopy Height and Cover for Tri-State (MD, PA, DE) Region, V2
Contact for Data Center Access Information:
- E-mail: uso@daac.ornl.gov
- Telephone: +1 (865) 241-3952
References
Blackard J, Finco M, Helmer E, Holden G, Hoppus M, Jacobs D et al (2008) Mapping U.S. forest biomass using nationwide forest inventory data and moderate resolution information. Remote Sens Environ 112(4):1658–1677. https://doi.org/10.1016/j.rse.2007.08.021
Cook, B., A. Swatantran, L. Duncanson, A. Armstrong, N. Pinto, R. Nelson. 2014. CMS: LiDAR-derived Estimates of Aboveground Biomass at Four Forested Sites, USA. ORNL DAAC, Oak Ridge, Tennessee, USA. https://doi.org/10.3334/ORNLDAAC/1257
Homer, C.G., J.A. Dewitz, L. Yang, S. Jin, P. Danielson, G. Xian, J. Coulston, N.D. Herold, J.D. Wickham, and K. Megown. 2015. Completion of the 2011 National Land Cover Database for the conterminous United States-Representing a decade of land cover change information. Photogrammetric Engineering and Remote Sensing 81(5): 345-354.
Hagen, S., N. Harris, S.S. Saatchi, T. Pearson, C.W. Woodall, S. Ganguly, G.M. Domke, B.H. Braswell, B.F. Walters, J.C. Jenkins, S. Brown, W.A. Salas, A. Fore, Y. Yu, R.R. Nemani, C. Ipsan, and K.R. Brown. 2016. CMS: Forest Carbon Stocks, Emissions, and Net Flux for the Conterminous US: 2005-2010. ORNL DAAC, Oak Ridge, Tennessee, USA. https://doi.org/10.3334/ORNLDAAC/1313
Huang, W., A. Swatantran, K. Johnson, L. Duncanson, H. Tang, J.O. Dunne, G. Hurtt, and R. Dubayah (2015) Local discrepancies in continental scale biomass maps: a case study over forested and non-forested landscapes in Maryland, USA. Carbon Balance and Management 10:19. https://doi.org/10.1186/s13021-015-0030-9
Jenkins J.C., D.C. Chojnacky, L.S. Heath, R.A. Birdsey (2003). National-scale biomass estimators for United States tree species. For. Sci. 49(1):12–35.
Kellndorfer, J., Walker, W., Kirsch, K., Fiske, G., Bishop, J., LaPoint, L., Hoppus, M., and Westfall, J. 2013. NACP Aboveground Biomass and Carbon Baseline Data, V. 2 (NBCD 2000), U.S.A., 2000. Data set. Available on-line [http://daac.ornl.gov] from ORNL DAAC, Oak Ridge, Tennessee, U.S.A. https://doi.org/10.3334/ORNLDAAC/1161
Wilson B.T., C.W. Woodall, D.M. Griffith (2013). Imputing forest carbon stock estimates from inventory plots to a nationally continuous coverage. Carbon Balance Manag. 8(1):1. https://doi.org/10.1186/1750-0680-8-1
Dataset Revisions
This is Version 2.
This dataset supersedes a previously published version which included only the state of Maryland:
Dubayah, R.O., A. Swatantran, W. Huang, L. Duncanson, K. Johnson, H. Tang, J.O. Dunne, and G.C. Hurtt. 2016. CMS: LiDAR-derived Aboveground Biomass, Canopy Height and Cover for Maryland, 2011. ORNL DAAC, Oak Ridge, Tennessee, USA. https://doi.org/10.3334/ORNLDAAC/1320