Documentation Revision Date: 2018-08-14
Data Set Version: 1
Summary
There are 9,504 files in compressed shapefile format (*.shp contained in *.zip) and 212 files in GeoTIFF format (*.tif) included in this dataset.
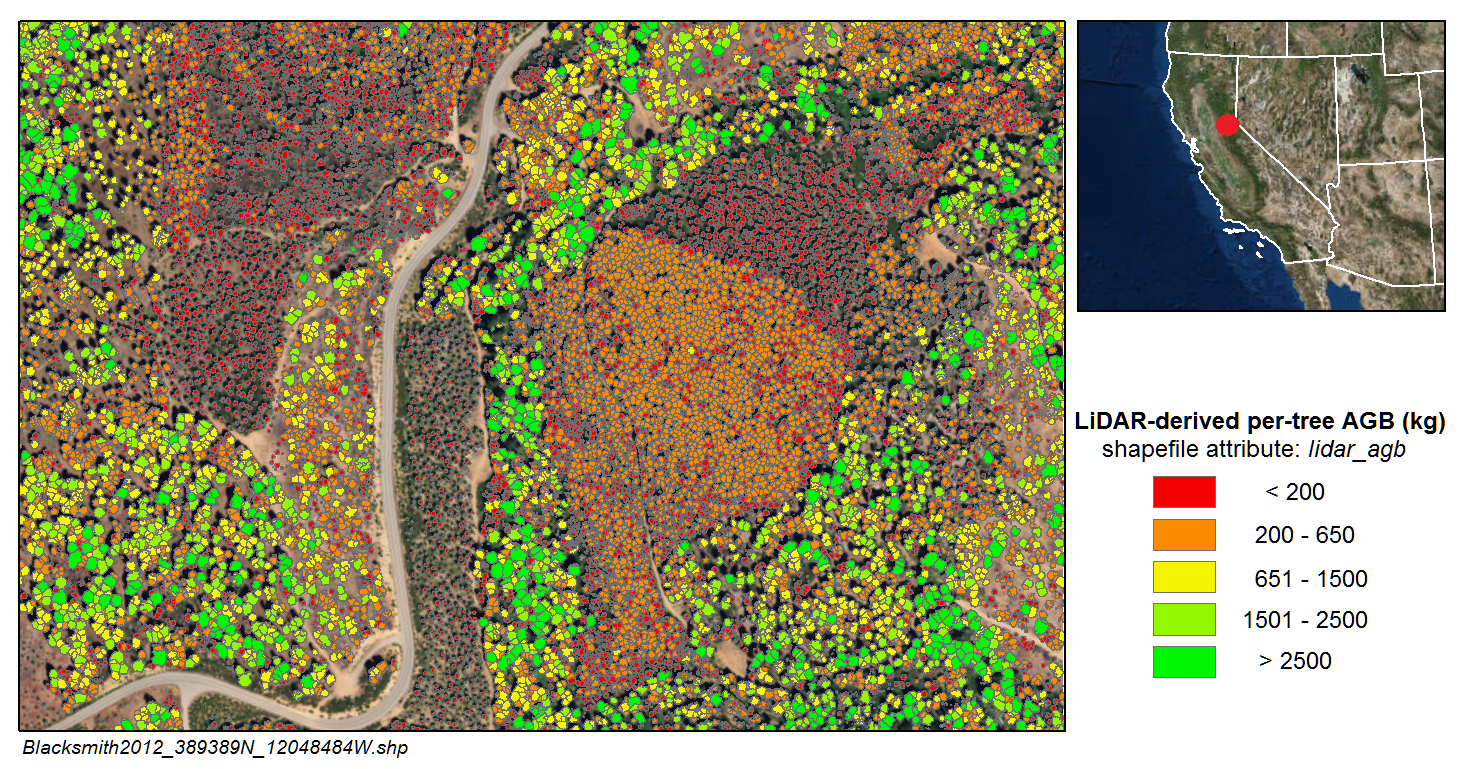
Figure 1. Per-tree aboveground biomass (kg) derived from LiDAR-measured tree heights for the Blacksmith site in 2012 (from Blacksmith2012_389389N_12048484W.zip).
Citation
Xu, Q., A. Man, M.M. Fredrickson, Z. Hou, J. Pitkanen, B. Wing, C. Ramirez, B. Li, and J. Greenberg. 2018. LiDAR-Derived Aboveground Biomass and Uncertainty for California Forests, 2005-2014. ORNL DAAC, Oak Ridge, Tennessee, USA. https://doi.org/10.3334/ORNLDAAC/1537
Table of Contents
- Data Set Overview
- Data Characteristics
- Application and Derivation
- Quality Assessment
- Data Acquisition, Materials, and Methods
- Data Access
- References
Data Set Overview
Project: Carbon Monitoring System
The NASA Carbon Monitoring System (CMS) is designed to make significant contributions in characterizing, quantifying, understanding, and predicting the evolution of global carbon sources and sinks through improved monitoring of carbon stocks and fluxes. The System will use the full range of NASA satellite observations and modeling/analysis capabilities to establish the accuracy, quantitative uncertainties, and utility of products for supporting national and international policy, regulatory, and management activities. CMS will maintain a global emphasis while providing finer scale regional information, utilizing space-based and surface-based data and will rapidly initiate generation and distribution of products both for user evaluation and to inform near-term policy development and planning.
Related Publication:
Xu, Q., Man, A., Fredrickson, M., Hou, Z., Pitkänen, J., Wing, B., Ramirez, C., Li, B. & Greenberg, A. J. 2018. Quantification of uncertainty in aboveground biomass estimates derived from small-footprint airborne LiDAR. Remote Sensing of Environment, 216, 514-528. .https://doi.org/10.1016/j.rse.2018.07.022
Acknowledgements:
The study is funded by NASA Carbon Monitoring System (Proposal number: 14-CMS14-0048; Grant number: NNX14AO80G) under the title of “Reducing uncertainties in estimating California’s forest carbon stocks”.
Data Characteristics
Spatial Coverage: Surveyed areas throughout California, see Figure 1.
Spatial Resolution:
Shapfiles: one polygon feature per tree canopy
GeoTIFFs: 30-m (AGB, uncertainty, coefficient of variation) and 25-cm (CHM)
Temporal Coverage: 20050101 - 20141231
Temporal Resolution: Each study site was surveyed once.
Study Area (These coordinates are the approximate locations of the study sites and may not match the extents of the data files. All latitude and longitude given in decimal degrees.)
| Site | Westernmost Longitude | Easternmost Longitude | Northernmost Latitude | Southernmost Latitude |
|---|---|---|---|---|
| Survey areas in California | -123.746 | -117.739 | 41.983 | 34.051 |
Data File Information
There are 9,504 *.zip files that contain compressed shapefiles (*.shp) and 212 files in GeoTIFF format (*.tif) included in this dataset.
- Shapefiles give the tree-level AGB estimates and uncertainties for a survey area. Spatial reference properties for the data files are listed below.
- GeoTIFFs give plot-level aboveground biomass (AGB) estimates and uncertainties for each of the 53 LiDAR survey areas included in the dataset as well as a canopy height model.
Spatial Reference Properties
Geographic Coordinate System: GCS_North_American_1983
Angular Unit: Degree (0.0174532925199433)
Prime Meridian: Greenwich (0.0)
Datum: D_North_American_1983
Spheroid: GRS_1980
Semimajor Axis: 6378137.0
Semiminor Axis: 6356752.314140356
Inverse Flattening: 298.257222101
NAD_1983_UTM_zone_10N
WKID: 26910 Authority: EPSG
Projection: Transverse_Mercator
false_easting: 500000.0
false_northing: 0.0
central_meridian: -123.0
scale_factor: 0.9996
latitude_of_origin: 0.0
Linear Unit: Meter (1.0)
NAD_1983_UTM_Zone_11N
WKID: 26911 Authority: EPSG
Projection: Transverse_Mercator
false_easting: 500000.0
false_northing: 0.0
central_meridian: -117.0
scale_factor: 0.9996
latitude_of_origin: 0.0
Linear Unit: Meter (1.0)
Tree-level Metrics
A number of shapefiles with coverages ranging between 1- and 2-km2 are provided for each of the 53 survey areas. Each shapefile is provided in a zip (*.zip) containing four files (*.shp, *.shx, *.dbf, *.prj).
- Shapefiles are named according to the survey area, year, and upper-left coordinate of the bounding box encompassing the shapefile features, e.g.: <survey area><year>_######N_######W.zip.
- The shapefiles contain one feature per tree delineated from the canopy height model. The tree segmentation method is described in Section 5. Spatial data properties for the shapefiles are given below.
- Shapefile feature attributes, units, and descriptions are provided in Table 1.
Spatial Data Properties
Spatial Representation Type: Vector
Geometry Type: Polygon
Geographic Coordinate System: North_American_1983
Prime Meridian: Greenwich
Angular Unit: Degree
Table 1. Shapefile feature attributes, units, and descriptions.
|
Attribute |
Units |
Description |
|---|---|---|
|
DN |
|
segment ID |
|
x_max |
m |
x coordinate of local maximum |
|
y_max |
m |
y coordinate of local maximum |
|
max_h |
m |
z coordinate of local maximum |
|
size_mx |
|
number of local maxima |
|
x_cen |
m |
x coordinate of segment geometric center |
|
y_cen |
m |
y coordinate of segment geometric center |
|
area |
m2 |
segment area |
|
diam_mx |
m |
max diameter of the segment |
|
diam_prp |
m |
diameter perpendicular to the maximum diameter |
|
diam_dr |
|
direction of the max diameter |
|
mask_rgr |
|
mask region |
|
D_N_L |
m |
distance to the nearest segment |
|
D_mean_L |
m |
mean distance to all segments in a 30-m pixel cell |
|
D_25p_L |
m |
25% percentile of the distances to all segments in a 30-m pixel cell |
|
D_50p_L |
m |
50% percentile of the distances to all segments in a 30-m pixel cell |
|
N_T_L |
|
number of segments in a 5-m neighborhood |
|
ellip_L |
m2 |
ellipse area using the two diameters |
|
lidar_agb |
kg |
LiDAR-derived per-tree AGB |
|
GAE_sd |
kg |
total standard deviation of the LiDAR-derived AGB |
|
GAE_CV |
|
coefficient of variation of the LiDAR-derived AGB |
|
lidar_comp |
kg |
standard deviation of the LiDAR-derived AGB associated with LiDAR height measurement |
|
param_comp |
kg |
standard deviation of the LiDAR-derived AGB associated with model parameters |
|
resid_comp |
kg |
standard deviation of the LiDAR-derived AGB associated with model residuals |
Plot-level Metrics
Four GeoTIFFs are provided for each of the 53 survey areas.
- Files are named by survey area and year followed by the measurement type.
- Spatial data properties for the GeoTIFFs are given below.
- Example filenames, units, and their descriptions are listed in Table 2.
Spatial Data Properties
Spatial Representation Type: Raster
Pixel Depth: 64bit
Pixel Type: 30-m (AGB) and 25-cm (CHMs)
Compression Type: LZW
Number of Bands: 1
Raster Format: GeoTIFF
No Data Value: -9999
Scale Factor: 1
Table 2. Filenames, units, and descriptions for GeoTIFFs.
| Filename | Units | Description |
|---|---|---|
| <survey area><year>_agb.tif | Mg/ha | Aboveground biomass density |
| <survey area><year>_sd_total.tif | Mg/ha | Total of allometric and remote sensing associated uncertainties |
| <survey area><year>_coefficient_variance.tif | AGB coefficient of variation | |
| <survey area><year>_chm.tif | m | Canopy height model |
Application and Derivation
This dataset is among the first examples of AGB estimation and uncertainty analysis based on an individual tree detection method. Aboveground biomass is an important metric for assessing carbon sequestration in forests.
Quality Assessment
Estimates of uncertainty associated with the plot- and tree-level AGB take into account potential error introduced by the allometry, the remote sensing height measurements and the individual tree detection algorithms.
Data Acquisition, Materials, and Methods
Estimates of aboveground biomass (AGB) and their uncertainties were established at the plot- and tree-level. A "remote sensing aware" allometric equation relating LiDAR-derived height to AGB was used to estimate AGB and uncertainty at the plot-level. LiDAR-derived height estimates were used to determine and propagate tree-level estimates of AGB.
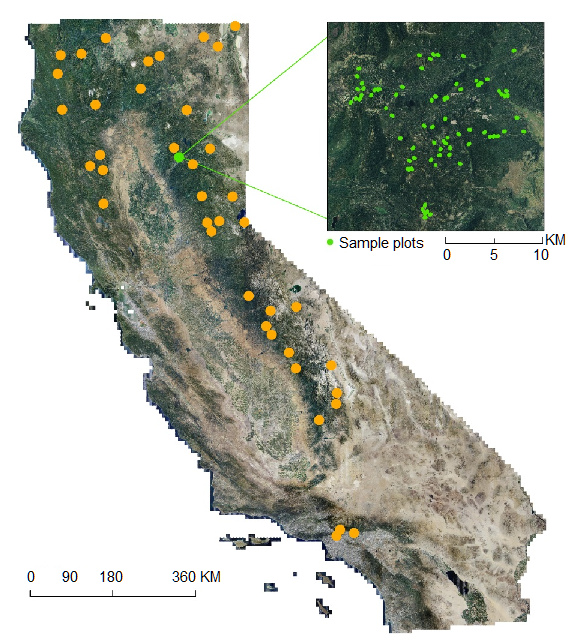
Figure 2. Site locations included in this dataset. The inset map depicts sample plots in the Lassen National Forest. (from Xu et al. 2017)
Tree segmentation
Tree heights were measured using the individual tree crown delineation approach outlined in the flow chart in Figure 2. A local maxima-incorporated watershed segmentation algorithm (Gauch 1999; Pitkänen et al. 2004) was applied to the low-pass filtered CHM to identify each individual tree by delineating the crown boundary. Tree height was extracted from the maximum height value around each local maximum. Crown diameters were measured by taking the maximum diameter of each segmented local maximum. Other tree-level attributes were calculated as the distance to the nearest tree and mean distance to all trees in a sample plot, to account for the local stem density.
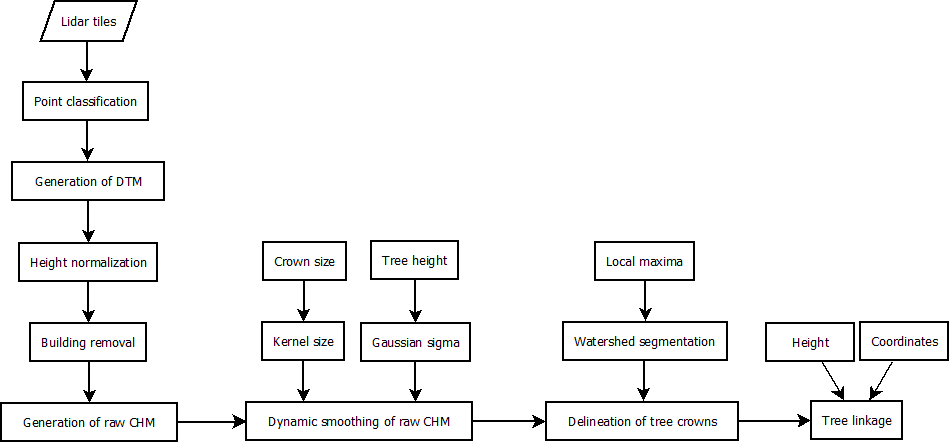
Figure 3. Flowchart of the standardized preprocessing chain and individual tree detection.
Tree-level aboveground biomass
The "remote sensing aware" allometric equation relating per-tree heights to AGB in a species-agnostic fashion was developed using a generalized allometric equation approach calibrated using trees in the Forest Inventory Analysis (FIA) database. This approach applies published allometric equations compiled as part of the GlobAllomeTree database (GlobAllomeTree 2013) to estimate a distribution of AGB for trees in the FIA. The result was a database of AGB estimates that was used to generate a novel allometric equation for relating per-tree heights to AGB (Eq. 1; Xu et al. 2017).
Estimates of uncertainty associated with the tree- and plot-level AGB take into account potential error introduced by the allometry and remote sensing height measurements. Detailed tree information for 8313 trees in 146 circular fixed-area sample plots in Lassen National Forest (USDA Forest Service; PNW-FIA Field Manual, 2015) was used to determine the LiDAR height measurement error, omission errors, and commission errors. The equations for deriving per-tree uncertainty (Eqs. 2-5), can be found in Xu et al. (2017).
Plot-level aboveground biomass
Plot-level biomass (Mg/ha) was obtained using a new method for predicting biomass density that takes omission and commission errors as a correction to the LiDAR direct detection of AGB. Plot-level AGB and variance are calculated using Equations 6 and 7 from Xu et al. (2017), respectively.
Data Access
These data are available through the Oak Ridge National Laboratory (ORNL) Distributed Active Archive Center (DAAC).
LiDAR-Derived Aboveground Biomass and Uncertainty for California Forests, 2005-2014
Contact for Data Center Access Information:
- E-mail: uso@daac.ornl.gov
- Telephone: +1 (865) 241-3952
References
Gauch, J.M. 1999. Image segmentation and analysis via multiscale gradient watershed hierarchies. IEEE Trans. Image Process. 8 (1):69–79. doi: https://doi.org/10.1109/83.736688
Henry, M., A. Bombelli, C. Trotta, A. Alessandrini, L. Birigazzi, G. Sola, G. Vieilledent, P. Santenoise, F. Longuetaud, R. Valentini, and N. Picard. 2013. SaiGlobAllomeTree: international platform for tree allometric equations to support volume, biomass and carbon assessment. iForest 6:326-330. doi: https://dx.doi.org/10.3832/ifor0901-006
Pitkäen, J., M. Maltamo, J. Hyyppä, and X. Yu. 2004. Adaptive methods for individual tree detection on airborne laser based canopy height model. International archives of photogrammetry. Remote Sens. Spatial Inf. Sci. 36 (Part 8/W2): 187–191.
Xu, Q., Man, A., Fredrickson, M., Hou, Z., Pitkänen, J., Wing, B., Ramirez, C., Li, B. & Greenberg, A. J. 2018. Quantification of uncertainty in aboveground biomass estimates derived from small-footprint airborne LiDAR. Remote Sensing of Environment, 216, 514-528. https://doi.org/10.1016/j.rse.2018.07.022