Documentation Revision Date: 2016-07-20
Summary
There are six files with this data set: tree inventory data in two comma-separated (*.csv) format files and also as two shapefiles (*.shp); and one shapefile (*.shp) for each of the inventoried areas that provides measurement plot boundary maps.
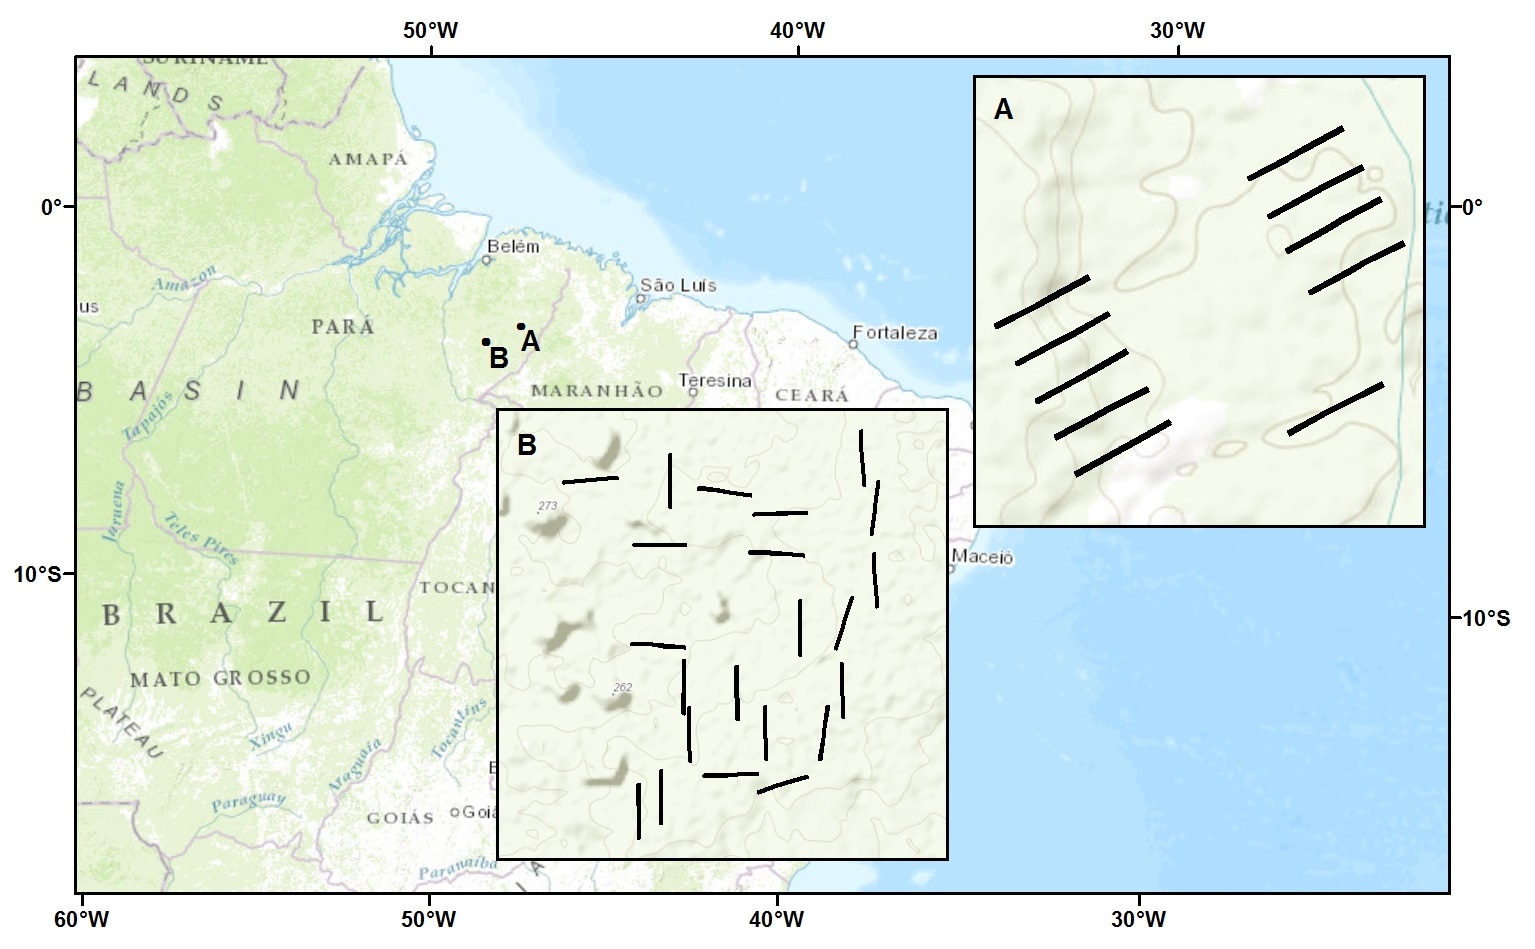
Figure 1. Forest inventory transect locations. Inset A is Fazenda Nova Neonita, Area PAR, and Inset B is Fazenda Cauaxi, Area CAU, in Paragominas, Para, Brazil.
Citation
dos-Santos, M.N., and M.M. Keller. 2016. CMS: Forest Inventory and Biophysical Measurements, Para, Brazil, 2012-2014. ORNL DAAC, Oak Ridge, Tennessee, USA. http://dx.doi.org/10.3334/ORNLDAAC/1301
Table of Contents
- Data Set Overview
- Data Characteristics
- Application and Derivation
- Quality Assessment
- Data Acquisition, Materials, and Methods
- Data Access
- References
Data Set Overview
Project: Carbon Monitoring System (CMS)
Investigators: Maiza Nara dos-Santos and Michael Keller
This data set provides measurements for diameter at breast height (DBH), commercial tree height, and total tree height for forest inventories taken at the Fazenda Cauaxi and the Fazenda Nova Neonita, Paragominas municipality, Para, Brazil. Also included for each tree are the common, family, and scientific name, coordinates, canopy position, and for dead trees the decomposition status. These biophysical measurements were made at Fazenda Cauaxi during 2012 and 2014 and at the Fazenda Nova Neonita during 2013.
The data were collected under the project Sustainable Landscapes, a project supported by the United States Agency for International Development (USAID) and US Department of State.
The CMS is designed to make significant contributions in characterizing, quantifying, understanding, and predicting the evolution of global carbon sources and sinks through improved monitoring of carbon stocks and fluxes. The System will use the full range of NASA satellite observations and modeling/analysis capabilities to establish the accuracy, quantitative uncertainties, and utility of products for supporting national and international policy, regulatory, and management activities. CMS will maintain a global emphasis while providing finer scale regional information, utilizing space-based and surface-based data.
Related Data Set:
CMS: LiDAR Data for Forested Areas in Paragominas, Para, Brazil, 2012-2014: LiDAR data for the areas in this data set and for the same time periods.
Data Characteristics
Spatial Coverage
Forest inventory surveys were conducted at the Fazenda Nova Neonita and Fazenda Cauaxi in the Paragominas municipality, Para, Brazil.
Total area inventoried at the Fazenda Cauaxi was 22 ha: 22 plots of 10,000 m2.
Total area inventoried at the Fazenda Nova Neonita was 10 ha: 10 plots of 10,000 m2.
Spatial Resolution
Plot sizes were 20 x 500 m with a 2 x 500-m subplot within a plot.
Temporal Coverage
Measurements were made at Fazenda Nova Neonita during 2013/03/09 - 2013/04/25.
Measurements were made at the Fazenda Cauaxi from 2012/01/27 - 2012/03/26 and also from 2014/02/18 - 2014/04/25. Commercial and total height measurements were only made in 2012.
Temporal Resolution
Annual
Site boundaries: (All latitude and longitude given in decimal degrees, datum: WGS84)
| Site (Region) | Westernmost Longitude | Easternmost Longitude | Northernmost Latitude | Southernmost Latitude |
|---|---|---|---|---|
| Fazenda Nova Neonita (PAR), Paragominas municipality, Para, Brazil | -47.55805 | -48.511484 | -3.306267 | -3.328857 |
| Fazenda Cauaxi (CAU), Paragominas, Para, Brazil | -48.49755 | -48.47154 | -3.730217 | -3.763814 |
Data File Information
There are two forest inventory files in *.csv format, four shapefiles (two of the inventory data, and two showing the study area boundaries) provided as *.zip files.
| File Name | Area | Measurement Dates | Total Area Inventoried |
|---|---|---|---|
|
File 1: CAU_A01_2012_2014_Forest_Inventory.csv |
Fazenda Cauaxi
|
2012/01/27 - 2012/03/26 |
22 ha in 2012 and 22 ha in 2014 |
| File 2: PAR_A01_2013_Forest_Inventory.csv | Fazenda Nova Neonita | 2013/03/09 - 2013/04/25 | 10 ha |
Table 1. Data file variables (Applies to both files 1 and 2)
| Column | Column Heading | Units/format | Description |
|---|---|---|---|
| 1 | site | Fazenda Cauaxi or Fazenda Nova Neonita. Both located in the Municipality of Paragominas | |
| 2 | area | Code names given to the site areas. The areas are PAR_A01 for the Fazenda Nova Neonita or CAU_A01 for the Fazenda Cauaxi | |
| 3 | transect | The transect ID number within an area. Transect = plot. | |
| 4 | tree_number | Tree number assigned to each tree in each transect | |
| 5 | date_measured | yyyy-mm-dd | Date of measurements |
| 6 | UTM_easting | m | X coordinate of tree individual location. Fazenda Cauaxi is in UTM Zone: 22S. Fazenda Nova Neonita is in UTM Zone: 23S |
| 7 | UTM_northing | m | Y coordinate of tree individual location. Fazenda Cauaxi is in UTM Zone: 22S. Fazenda Nova Neonita is in UTM Zone: 23S |
| 8 | common_name | Common name of tree. MORTA = dead tree | |
| 9 | scientific_name | Scientific name of tree. NI = not identified. For common_name = MORTA (dead) or LIANA, scientific names are not provided. | |
| 10 | family_name | Family name of tree. NI = not identified. For common_name = MORTA (dead) or LIANA, scientific names are not provided | |
| 11 | tree_type | Divided into four classes: Liana (L): woody vines. Note that inclusion in the inventory was based on the position of the vine at 1.3 m above the ground, not the rooting position. Palms (P): leafed palms. Note that inclusion in the inventory was based on the diameter at the ground surface. Litter was removed from around the base for measurement. Trunked palms (Pt): palms with a trunk measurable at 1.3 m Other (O): Trees |
|
| 12 | dead_alive | Tree is either dead or alive. If dead, then standing dead. D: tree is dead A: tree is alive If the tree is dead, then decomp_class was assigned and only DBH and height_total were measured. |
|
| 13 | decomp_class | Decomposition class was assigned to dead trees. Decomposition Class (Keller et al., 2004) as given in -- http://daac.ornl.gov/LBA/guides/TG07_Fallen_Standing_Necromass.html. However, only standing dead trees were measured and classified. Decay class (1- 5): Class 1 - solid wood with some leaves and/or fine twigs still attached; Class 2 - solid wood/ bark still intact / no leaves or fine twigs; Class 3 - still solid/ some bark falling off; Class 4 - somewhat rotten/ will break when kicked/ bark falling off or lost; Class 5 - rotten/ can break with fingers (No Class 5 trees were included in this inventory) |
|
| 14 | canopy_position | Position of crown with respect to surrounding canopies, split into 3 classes. E: Emergent, above surrounding tree canopies C: Canopy level, at the same height as the main forest canopy of surrounding trees. This class includes both dominant and super-dominants. S: Suppressed, trees below the height of the dominant canopy layer. |
|
| 15 | crown_light | Crown Illumination Index, divided into three classes. 1: Entire crown surface gets direct sunlight. 2: A section of the crown surface receives direct sunlight. 3: The crown surface only receives indirect light. |
|
| 16 | DBH | cm | Diameter at breast height (DBH), 1.3 m above the ground. Measured on both live and standing dead trees. |
| 17 | height_commercial | m | Commercial Height (m), measured using a clinometer and tape as the height of the lowest leaf (bottom of the canopy). Measured only on alive trees. Fazenda Cauaxi site 2012 only -- not measured in 2014. |
| 18 | height_total | m | Total Height (m), measured using a clinometer and tape as the height to the highest point of the tree crown. Measured on both alive and standing dead trees. Fazenda Cauaxi site 2012 only -- not measured in 2014. |
| 19 | radius_north | m | Radius to the north of the tree crown. Measured only on alive trees. Not measured on lianas. Measured standing directly under the north-most leaf, with the measuring tape pulled due South until directly east/west of the trunk. If the canopy is offset from the trunk, any of the radius measurements can be negative. Same for other directions. |
| 20 | radius_south | m | Radius to the south of the tree crown. |
| 21 | radius_east | m | Radius to the east of the tree crown. |
| 22 | radius_west | m | Radius to the west of the tree crown. |
Shapefiles
There are four shape files (*.shp) provided in zip files (*.zip) described below:
- CAU_A01_2012_2014_Forest_Inventory_Plot_Boundary.shp (CAU_A01_2012_2014_Forest_Inventory_Plot_Boundary.zip): Provides a boundary map of the Fazenda Cauaxi plots.
- CAU_A01_2012_2014_Forest_Inventory.shp (CAU_A01_2012_2014_Forest_Inventory.zip): Provides the same variables as the corresponding .csv file (File 1).
- PAR_A01_2013_Forest_Inventory_Plot_Boundary.shp (PAR_A01_2013_Forest_Inventory_Plot_Boundary.zip): Provides a boundary map of the Fazenda Nova Neonita plots.
- PAR_A01_2013_Forest_Inventory.shp (PAR_A01_2013_Forest_Inventory.zip): Provides the same variables as the corresponding .csv file (File 2).
File 1. CAU_A01_2012_2014_Forest_Inventory_Plot_Boundary.shp
This shapefile contains six files (*.shx, *.dbf, *.prj, *.sbn, *.sbx, and *.shp).
Parameters of the shapefile:
Geometry Type: Polygon
Projected Coordinate System: SIRGAS_2000_UTM_Zone_22S
Geographic Coordinate System: GCS_SIRGAS_2000
Datum: D_SIRGAS_2000
Prime Meridian: Greenwich
Angular Unit: Degree
Projection: Transverse_Mercator
false_easting: 500000.00000000
false_northing: 10000000.00000000
central_meridian: -51.00000000
scale_factor: 0.99960000
latitude_of_origin: 0.00000000
Linear Unit: Meter
Extent in file’s coordinate system:
North: 9587290.219689
South: 9583578.889811
East: 780851.906964
West: 777960.795787
Extent in decimal degrees:
North: -3.730217
South: -3.763814
East: -48.47154
West: -48.497551
Attributes:
FID: Internal feature number; sequential unique whole numbers that are automatically generated
Shape: Feature geometry
TransectID: Identification code that corresponds to a specific transect
plot: Denotes if this polygon is a plot boundary or subplot boundary
File 2. CAU_A01_2012_2014_Forest_Inventory.shp
This shapefile contains six files (*.shx, *.dbf, *.prj, *.sbn, *.sbx, and *.shp).
Parameters of the shapefile:
Geometry Type: Point
Projected Coordinate System: SIRGAS_2000_UTM_Zone_22S
Geographic Coordinate System: GCS_SIRGAS_2000
Datum: D_SIRGAS_2000
Prime Meridian: Greenwich
Angular Unit: Degree
Projection: Transverse_Mercator
false_easting: 500000.00000000
false_northing: 10000000.00000000
central_meridian: -51.00000000
scale_factor: 0.99960000
latitude_of_origin: 0.00000000
Linear Unit: Meter
Extent in file’s coordinate system:
North: 9587278.953
South: 9583583.441
East: 780844.1099
West: 777971.1767
Extent in decimal degrees:
North: -3.730319
South: -3.763772
East: -48.471610
West: -48.497458
Attributes:
FID: Internal feature number; sequential unique whole numbers that are automatically generated
Shape: Feature geometry
TransectID: Identification code that corresponds to a specific transect
***ALL OTHER ATTRIBUTES ARE THE SAME AS THE CORRESPONDING .CSV****
File 3. PAR_A01_2013_Forest_Inventory_Plot_Boundary.shp
This shapefile contains six files (*.shx, *.dbf, *.prj, *.sbn, *.sbx, and *.shp).
Parameters of the shapefile:
Geometry Type: Polygon
Projected Coordinate System: SIRGAS_2000_UTM_Zone_23S
Geographic Coordinate System: GCS_SIRGAS_2000
Datum: D_SIRGAS_2000
Prime Meridian: Greenwich
Angular Unit: Degree
Projection: Transverse_Mercator
false_easting: 500000.00000000
false_northing: 10000000.00000000
central_meridian: -45.00000000
scale_factor: 0.99960000
latitude_of_origin: 0.00000000
Linear Unit: Meter
Extent in file’s coordinate system:
North: 9634035.944136
South: 9632401.007957
East: 220834.016197
West: 218920.137419
Extent in decimal degrees:
North: -3.307752
South: -3.3225
East: -48.51216
West: -47.52938
Attributes:
FID: Internal feature number; sequential unique whole numbers that are automatically generated
Shape: Feature geometry
TransectID: Identification code that corresponds to a specific transect
plot: Denotes if this polygon is a plot boundary or subplot boundary
File 4. PAR_A01_2013_Forest_Inventory.shp
This shapefile contains six files (*.shx, *.dbf, *.prj, *.sbn, *.sbx, and *.shp).
Parameters of the shapefile:
Geometry Type: Polygon
Projected Coordinate System: SIRGAS_2000_UTM_Zone_23S
Geographic Coordinate System: GCS_SIRGAS_2000
Datum: D_SIRGAS_2000
Prime Meridian: Greenwich
Angular Unit: Degree
Projection: Transverse_Mercator
false_easting: 500000.00000000
false_northing: 10000000.00000000
central_meridian: -45.00000000
scale_factor: 0.99960000
latitude_of_origin: 0.00000000
Linear Unit: Meter
Extent in file’s coordinate system:
North: 9634021.826
South: 9632409.973
East: 220822.9324
West: 218928.9926
Extent in decimal degrees:
North: -3.307879
South: -3.322419
East: -47.512260
West: -47.512260
Attributes:
FID: Internal feature number; sequential unique whole numbers that are automatically generated
Shape: Feature geometry
TransectID: Identification code that corresponds to a specific transect
***ALL OTHER ATTRIBUTES ARE THE SAME AS THE CORRESPONDING .CSV FILES****
Application and Derivation
Brazilian tropical forests contain approximately one-third of the global carbon stock in above-ground tropical forest biomass. Deforestation has cleared about 15% of the extensive forest on the Brazilian Amazon frontier. In response to the potential climatic effects of deforestation, policy makers have suggested reductions in emissions through deforestation and forest degradation and enhanced forest carbon stocks (REDD+). Carbon accounting for REDD+ requires knowledge of deforestation, degradation, and associated changes in forest carbon stocks.
These data may be used to validate LiDAR data in a related data set (See Section 1 and Figure 2.) and in the quantification of carbon stocks, changes, and associated uncertainties in Paragominas, a jurisdiction in the eastern Brazilian Amazon with a high proportion of logged and burned degraded forests where political change has opened the way for REDD+.
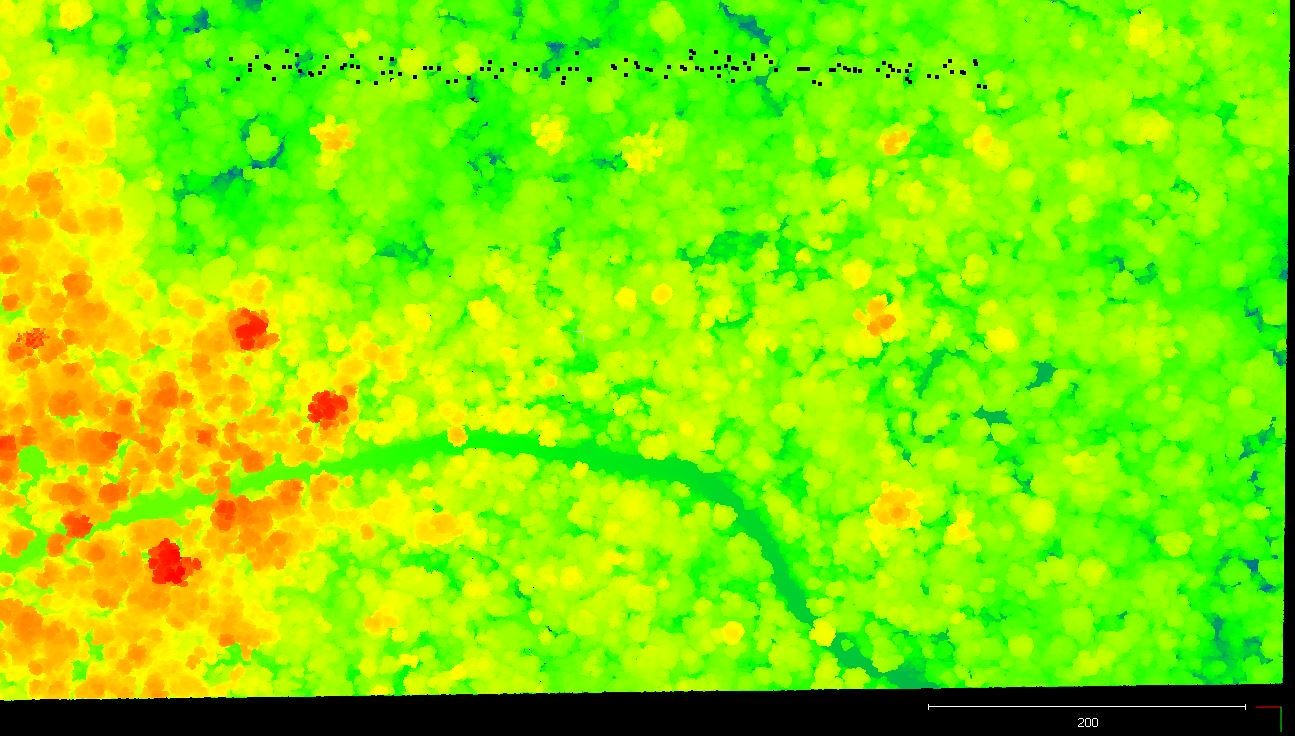
Figure 2. Tree locations within a plot boundary/transect are indicated by the black dots. Tree locations are shown on LiDAR point cloud data obtained for the same area and same time period. See Section 1., Related Data Set.
Quality Assessment
Data published by the Sustainable Landscapes Project undergo a strict process of quality control. Please refer to http://mapas.cnpm.embrapa.br/paisagenssustentaveis/ for additional information.
Data Acquisition, Materials, and Methods
Site Description:
The forest inventory areas were located in the Fazenda Cauaxi and Fazenda Nova Neonita, Paragominas municipality, Para, Brazil. Paragominas is located in the eastern Brazilian Amazon. The dominant vegetation in this region is humid forest with predominantly oxisols perenefólia and ultisols soils. Paragominas was a large agricultural and timber center of the country, with its exploitation started in the 70's and expansion in the 80's. During the period 1989 to 1990 it is estimated that 67,845 ha were explored for wood intended to supply the 238 sawmills operating in the region. Paragominas was once considered the largest timber source of Brazil (Nara dos-Santos et al., 2015; Verissimo et al., 1992).
Plots:
Ten plots (transects) were established in the Fazenda Nova Neonita and 22 plots (transects) were established in the Fazenda Cauaxi. Plots are 20 x 500-m transects with a centrally located 2 x 500-m subplot (Fig. 3).

Figure 3. Representation of the 20 x 500-m plot (blue polygon) and the 2 x 500-m subplot (grey area).
Measurements:
Measurements were made at Fazenda Nova Neonita during 2013/03/09 - 2013/04/25. Measurements were made at the Fazenda Cauaxi from 2012/01/27 - 2012/03/26 and also from 2014/02/18 - 2014/04/25.
Tree types:
Trees were identified, geolocated, assigned numbers, and divided into four classes:
- Liana (L): woody vines. Note that inclusion in the inventory was based on the position of the vine at 1.3 m above the ground, not the rooting position. No lianas were reported for the Fazenda Nova Neonita site.
- Palms (P): leafed palms. Note that inclusion in the inventory was based on the diameter at the ground surface. Litter was removed from around the base for measurement. No palms were reported for Fazenda Cauaxi or Fazenda Nova Neonita sites.
- Trunked palms (Pt): palms with a trunk measurable at 1.3 m
- Other (O): Trees
Biophysical Measurements:
Trees with diameter at breast height (DBH) equal to or greater than 35 cm were accounted for and measured within the plot area (Fig. 2); trees with DBH equal to or greater than 10 cm were only measured within the subplot area (Fig. 2).
Commercial Height (m) was measured on live trees using a clinometer and tape as the height of the lowest leaf (bottom of the canopy). Measurements were only made at the Fazenda Cauaxi site in 2012-- not measured in 2014.
Total Height (m) was measured on live trees and standing dead trees using a clinometer and tape as the height to the highest point of the tree crown. Measurements were only made at the Fazenda Cauaxi site in 2012-- not measured in 2014.
The radius to the north, south, east, and west was measured standing directly under the north-most leaf, with the measuring tape pulled due south until directly east/west of the trunk. If the canopy is offset from the trunk, any of the radius measurements can be negative.
Tree Decomposition:
A decomposition class was assigned to dead trees (Keller et al, 2004) as given in --
http://daac.ornl.gov/LBA/guides/TG07_Fallen_Standing_Necromass.html. However, only standing dead trees were measured and classified. Decay class (1- 5):
Class 1 - solid wood with some leaves and/or fine twigs still attached;
Class 2 - solid wood/ bark still intact / no leaves or fine twigs;
Class 3 - still solid/ some bark falling off;
Class 4 - somewhat rotten/ will break when kicked/ bark falling off or lost;
Class 5 - rotten/ can break with fingers
(No Class 5 trees were included in this inventory)
Crown Position and Illumination:
Position of the crown was noted with respect to surrounding canopies- split into 3 classes:
E: Emergent, above surrounding tree canopies
C: Canopy level, at the same height as the main forest canopy of surrounding trees. This class includes both dominant and super-dominants.
S: Suppressed, trees below the height of the dominant canopy layer.
Crown Illumination Index was noted- divided into three classes:
1: Entire crown surface gets direct sunlight.
2: A section of the crown surface receives direct sunlight.
3: The crown surface only receives indirect light.
Data Access
This data is available through the Oak Ridge National Laboratory (ORNL) Distributed Active Archive Center (DAAC).
CMS: Forest Inventory and Biophysical Measurements, Para, Brazil, 2012-2014
Contact for Data Center Access Information:
- E-mail: uso@daac.ornl.gov
- Telephone: +1 (865) 241-3952
References
dos-Santos, M.N., E.R. Pinage, M. Longo, L. Spinelli-Araujo, and M. Keller. 2015. Characterized edge effect with the use of LiDAR data in a degraded forest landscape in the municipality of Paragominas (PA). Proceedings of the XVII Brazilian Symposium on Remote Sensing - SBSR , Joao Pessoa, Brazil, 25 to 29 April 2015, INPE.
Verissimo, A., P. Barreto, M. Mattos, R. Tarifa, and C. Uh. 1992. Logging lmpacts and prospects for sustainable forest management in an old Amazonian frontier: the case of Paragominas, Forest Ecology and Management, 55:169-199 .