Documentation Revision Date: 2021-03-15
Dataset Version: 1
Summary
Image selection for each year from January-August was based on (1) selecting the same season to minimize the sudden change in land cover/use (e.g., owing to burning), (2) using a single image where cloud cover is less than 5%, or (3) using composite images available from January to August with only good pixels specified. The 2015 LUC map was successfully verified by comparison to Worldview 2 and SPOT 6/7 images collected in 2015.
There are seven data files in GeoTIFF (.tif) format with this dataset. The files provide annual land cover estimates for each five-year period: 1994, 1999, 2004, 2009, 2014, and 2019. The year 2015 was used for accuracy assessment.
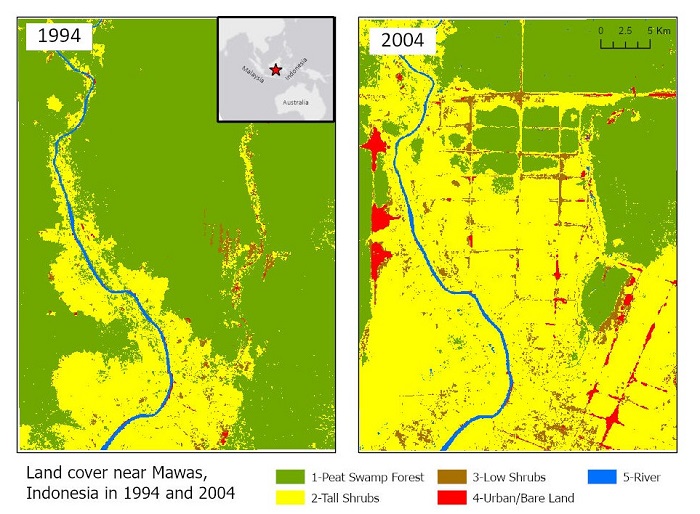
Figure 1. Land cover maps at 30 m resolution across Mawas, Central Kalimantan, Indonesia in 1994 (left) and 2004 (right).
Citation
Vetrita, Y., and M.A. Cochrane. 2021. Land Use and Cover Maps from Landsat, Mawas, Central Kalimantan, Indonesia, 1994-2019. ORNL DAAC, Oak Ridge, Tennessee, USA. https://doi.org/10.3334/ORNLDAAC/1838
Table of Contents
- Dataset Overview
- Data Characteristics
- Application and Derivation
- Quality Assessment
- Data Acquisition, Materials, and Methods
- Data Access
- References
Dataset Overview
This dataset contains annual land use/cover (LUC) maps at 30 m resolution across Mawas, Central Kalimantan, Indonesia. There are six files, each representing a five-year interval over the period 1994-2019. An additional file for 2015 was created for accuracy assessment. A high-quality and low-cloud coverage image from Landsat 5 or Landsat 8 over each 5-year period was selected or composited for the January-August timeframe. Investigators used their knowledge to manually identify training polygons in these images for five LUC classes: peat swamp forest, tall shrubs/ secondary forest, low shrubs/ferns/grass, urban/bare land/open flooded areas, and river. Pixel values of Landsat Tier 1 surface reflectance products and selected indices were extracted for each LUC and used to predict LUC classes across the Mawas study area using the Classification and Regression Trees (CART) method. These data can be used to evaluate the relationship between fire occurrence and land cover type in the study site.
Image selection for each year from January-August was based on (1) selecting the same season to minimize the sudden change in land cover/use (e.g., owing to burning), (2) using a single image where cloud cover is less than 5%, or (3) using composite images available from January to August with only good pixels specified. The 2015 LUC map was successfully verified by comparison to Worldview 2 and SPOT 6/7 images collected in 2015.
Project: Carbon Monitoring System
The NASA Carbon Monitoring System (CMS) is designed to make significant contributions in characterizing, quantifying, understanding, and predicting the evolution of global carbon sources and sinks through improved monitoring of carbon stocks and fluxes. The System will use the full range of NASA satellite observations and modeling/analysis capabilities to establish the accuracy, quantitative uncertainties, and utility of products for supporting national and international policy, regulatory, and management activities. CMS will maintain a global emphasis while providing finer scale regional information, utilizing space-based and surface-based data and will rapidly initiate generation and distribution of products both for user evaluation and to inform near-term policy development and planning.
Related Dataset
Vetrita, Y., and M.A. Cochrane. 2019. Annual Burned Area from Landsat, Mawas, Central Kalimantan, Indonesia, 1997-2015. ORNL DAAC, Oak Ridge, Tennessee, USA. https://doi.org/10.3334/ORNLDAAC/1708
Acknowledgments
This work was supported by NASA's Carbon Monitoring System (grants NNX17AC95G and 80NSSC18K0235).
Data Characteristics
Spatial Coverage: Central Kalimantan, Indonesia
Spatial Resolution: 30 m
Temporal Coverage: Every fifth year, for the period 1994–2019
Temporal Resolution: Annual
Study Area: Latitude and longitude are given in decimal degrees.
| Sites | Westernmost Longitude | Easternmost Longitude | Northernmost Latitude | Southernmost Latitude |
|---|---|---|---|---|
| Central Kalimantan, Indonesia | 114.3555722 | 114.6478917 | -2.16208333 | -2.560936111 |
Data File Information
There are seven data files in GeoTIFF (.tif) format with this dataset. The files provide annual land cover maps for each five-year period, including 1994, 1999, 2004, 2009, 2014, 2019, and the year 2015 for accuracy assessment.
The files are named Mawas_LUC_YYYY_001.tif, where YYYY is the year of the dataset and 001 is the version of the product (e.g., Mawas_LUC_1994_001.tif).
Data File Details
For all files,
- Land cover classes: 1–5 (Table 1)
- No data value: 0
- EPSG: 32750
- Projection: UTM Zone 50S
- Datum: WGS 1984
Application and Derivation
These data can be used to evaluate the relationship between fire occurrence and land cover type in the study area.
Quality Assessment
From a clear Landsat 8 image in August of 2015, a land use/cover type map was derived. The complete workflow, including the accuracy assessment for 2015, is provided in Figure 3.
Worldview 2 and SPOT 6/7 images (multispectral imagery 1.84 m and 6 m spatial resolutions, respectively) scanned in April, May, and early August of 2015 (provided by the Indonesian National Institute of Aeronautics and Space for 2015, https://inderaja.lapan.go.id/index.php) were used to verify the 2015 Landsat LUC classification. Stratified random samples of validation points were generated to verify the accuracy of each class. Validation points were removed that were 1) affected by cloudy pixels on either the LUC image or the reference image; 2) located within the 3x3 pixel windows of training points (none found), or 3) when pixels were later detected (after the reference image acquisition) as burned in the LC file (one pixel only).
Of the initial 97 validation points created, a total of 17, 22, 17, 14, and 15 points remained, respectively, for peat swamp forest, tall shrubs, low shrubs, urban/bare land, and river. This number of validating points reaches a standard error of 0.01 within this relatively small site (50,000 ha). The confusion matrix indicates a 0.96 overall accuracy with the tall shrubs class as the least accurate.
Table 1. Description of the land use/cover classes and accuracy assessment.
| ID | Class | Explanation | Producer’s Accuracy | User’s Accuracy |
|---|---|---|---|---|
| 1 | Peat swamp forest | Both pristine and degraded peat swamp forest | 1.00 | 0.89 |
| 2 | Tall shrubs | Shrubland or secondary forest with an average height above 2 m; including agricultural fields, plantation, and swamp shrubland | 0.86 | 0.95 |
| 3 | Low shrubs | Ferns and grass or shrubland with average height less than 2 m with soil/water exposed (just regrowth) | 1.00 | 0.94 |
| 4 | Urban/bare land | Including open area with no vegetation, just burned, flooded area, and villages. | 1.00 | 1.00 |
| 5 | River | Permanent water bodies | 0.93 | 1.00 |
Caveats and Known Issues
- Error sources include: 1) thin cloud/cloud shadow interference that was not masked by quality assurance pixels; 2) confusion between tall shrubs and peat swamp forest; 3) very few cloud-free images throughout 2014 that exacerbated the low quality of the LUC map.
- A canal (< 10 m width) or seasonal water along the river may each be classified differently. Users who need to identify the land use/cover change or identify the water canal should use the datasets cautiously.
Data Acquisition, Materials, and Methods
Landsat data series (TM, OLI/TIR) from 1994 to 2019 were used to classify the land use/cover types. The complete workflow is provided in Figure 3.
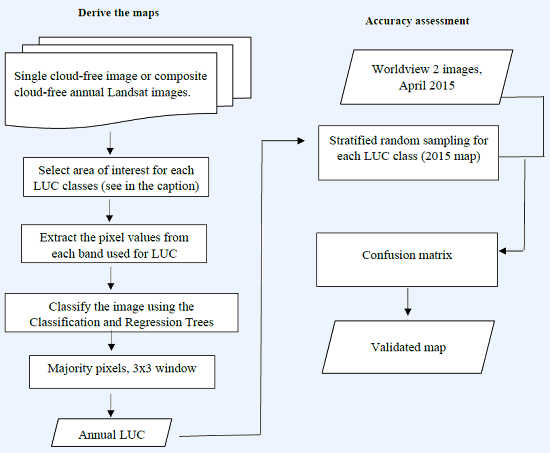
Figure 3. Image processing to create a land use/cover (LUC) map across Mawas, Central Kalimantan, Indonesia. First, cloud-free Landsat images were derived from a single image or a composited annual pixel value. The image was used to select training points based on investigator knowledge for five LUC classes: peat swamp forest, tall shrubs/ secondary forest, low shrubs/ferns/grass, urban/bare land/open flooded areas, and river (see Table 1). Finally, LUC classes were predicted using the Classification and Regression Trees (CART) method based on the training samples extracted from selected bands and indices: Blue (0.45–0.51 µm), Green (0.53–0.60 µm), Red (0.63–µm), Near Infrared (0.85–0.88 µm), Shortwave Infrared (1.56–1.66 µm and 2.10–2.30 µm), and longwave Infrared (only for Landsat 8 TIR, 10.30–11.30 µm and 11.50–12.50 µm).
The surface reflectance Tier 1 product was selected from several bands and indices. Image selection for each year used was based on the following criteria. First, selecting the same season to minimize the sudden change in the land cover/use (e.g., owing to burning). In this area, the fire season typically begins from mid-August, so the image acquisition dates range from January to August. Second, using a single image where cloud cover is less than 5% or using composite images available from January to August with only good pixels specified. Good pixels were flagged in pixel quality assurance, meaning cloud and water masked out. The remaining cloud pixels, usually thin clouds, were removed using the <0.045 reflectance threshold in the blue band.
Table 2. Landsat image selection for the annual land use/cover area maps.
| Year | Satellite/Sensor | Acquisition Date* |
|---|---|---|
| 2019 | Landsat 8 OLI/TIR | 20190814 |
| 2015 | Landsat 8 OLI/TIR | 20150803 |
| 2014 | Landsat 8 OLI/TIR | Composited image only |
| 2009 | Landsat 5 TM | 20090207 |
| 2004 | Landsat 5 TM | 20040516 |
| 1999 | Landsat 5 TM | 19990722 |
| 1994 | Landsat 5 TM | 19940708 |
* The initial image selected. Pixels may have been removed due to cloud masking and were filled with the second classified image generated from the composite image in that particular year.
The training polygons were drawn for five classes: pristine/degraded peat swamp forest (PSF), ferns/low shrubs, river/water body, tall shrubs, and secondary forest. Frequently the swamp/flooded tall shrubs were identified as PSF, so another class was added called swamp-shrubs and polygon samples were used to locate misidentified pixels. The majority pixels, a 3 x 3 window, were used to remove the salt-pepper noise of the predicted classes. Three classes (tall shrubs, secondary forest, swamp/flooded tall shrubs) were merged into one class (tall shrubs). The gap pixels produced by the cloud cover on the first map were filled with the second image classification produced from the composite image. Overall, very few land-use/cover types changed from January to August, so the same polygon samples were used as the first image classification and a few samples were added if needed. Because cloud cover also influenced the water body pixels, a river map was created with the NDWI value ≤-0.55 of the clearest image in 2015, and then overlaid on all LUC maps. Pixel values of Landsat Tier 1 surface reflectance products and selected indices were extracted for each LUC and used to predict LUC classes across Mawas using the Classification and Regression Trees (CART) classifier (Breiman et al., 1984) in the Google Earth Engine platform.
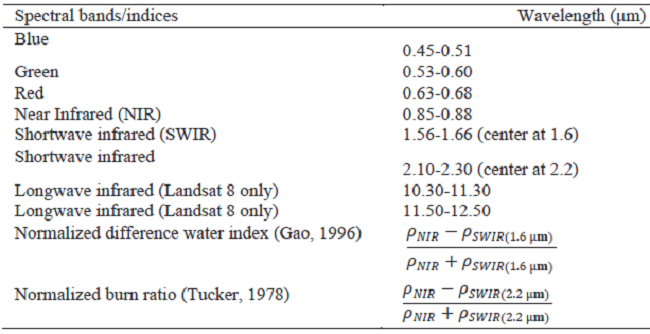
Table 3. The surface reflectance Tier 1 product and indices used to derive the annual land use/cover area maps.
Data Access
These data are available through the Oak Ridge National Laboratory (ORNL) Distributed Active Archive Center (DAAC).
Land Use and Cover Maps from Landsat, Mawas, Central Kalimantan, Indonesia, 1994-2019
Contact for Data Center Access Information:
- E-mail: uso@daac.ornl.gov
- Telephone: +1 (865) 241-3952
References
Breiman, L., J. Friedman, R. Olshen, and C. Stone. 1984. Classification and Regression Trees. Chapman and Hall, Wadsworth, New York.
Gao, B. C. (1996). NDWI—A normalized difference water index for remote sensing of vegetation liquid water from space. Remote sensing of environment, 58(3), 257-266.
Tucker, C. J. (1979). Red and photographic infrared linear combinations for monitoring vegetation. Remote sensing of Environment, 8(2), 127-150.