Documentation Revision Date: 2021-04-29
Dataset Version: 1.3
Summary
Spatially explicit maps of mangrove canopy height and AGB derived from space-borne remote sensing data and in situ measurements can be used to assess local-scale geophysical and environmental conditions that may regulate forest structure and carbon cycle dynamics. Maps revealed a wide range of canopy heights, including maximum values (> 62 m) that surpass maximum heights of other forest types.
There are 348 data files in GeoTIFF format (.tif) with this dataset representing three data products for each of 116 countries. The in situ tree measurements are provided in a single .csv file.
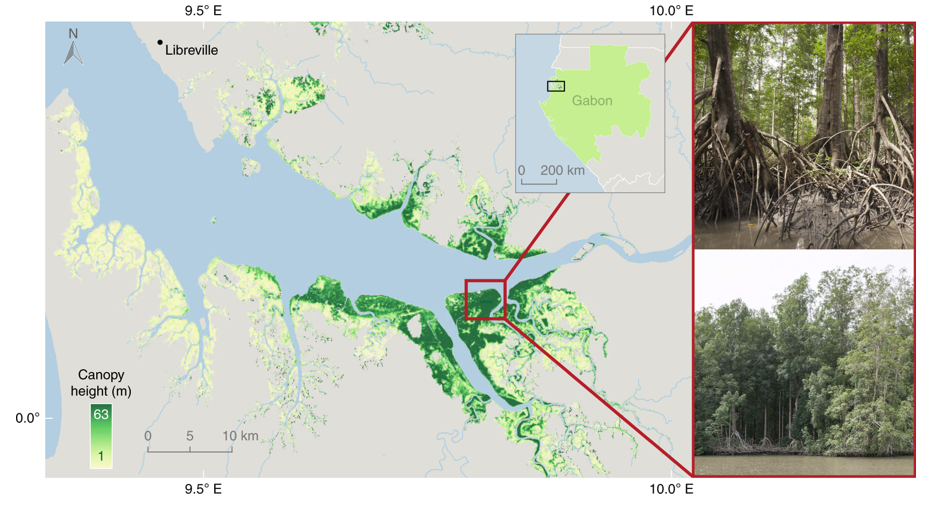
Figure 1. Mangrove forests in coastal Gabon are the tallest globally with forest stands that were estimated up to 63 m. The photo insets show locations where individual trees were measured in situ up to 65 m tall (Simard et al., 2019).
Citation
Simard, M., T. Fatoyinbo, C. Smetanka, V.H. Rivera-monroy, E. Castaneda, N. Thomas, and T. Van der stocken. 2019. Global Mangrove Distribution, Aboveground Biomass, and Canopy Height. ORNL DAAC, Oak Ridge, Tennessee, USA. https://doi.org/10.3334/ORNLDAAC/1665
Table of Contents
- Dataset Overview
- Data Characteristics
- Application and Derivation
- Quality Assessment
- Data Acquisition, Materials, and Methods
- Data Access
- References
- Dataset Revisions
Dataset Overview
This dataset characterizes the global distribution, biomass, and canopy height of mangrove-forested wetlands based on remotely sensed and in situ field measurement data. Estimates of (1) mangrove aboveground biomass (AGB), (2) maximum canopy height (height of the tallest tree), and (3) basal-area weighted height (individual tree heights weighted in proportion to their basal area) for the nominal year 2000 were derived across a 30-meter resolution global mangrove ecotype extent map using remotely-sensed canopy height measurements and region-specific allometric models. Also provided are (4) in situ field measurement data for selected sites across a wide variety of forest structures (e.g., scrub, fringe, riverine and basin) in mangrove ecotypes of the global equatorial region. Within designated plots, selected trees were identified to species and diameter at breast height (DBH) and tree height was measured using a laser rangefinder or clinometer. Tree density (the number of stems) can be estimated for each plot and expressed per unit area. These data were used to derive plot-level allometry among AGB, basal area weighted height (Hba), and maximum canopy height (Hmax) and to validate the remotely sensed estimates.
These spatially explicit maps of mangrove canopy height and AGB derived from space-borne remote sensing data and in situ measurements can be used to assess local-scale geophysical and environmental conditions that may regulate forest structure and carbon cycle dynamics. Maps revealed a wide range of canopy heights, including maximum values (> 62 m) that surpass maximum heights of other forest types.
User Note: This Version 1.3 now includes the in situ tree measurement data and documentation added in March 2021. No changes to previously archived data.
Project: Carbon Monitoring System
The NASA Carbon Monitoring System (CMS) is designed to make significant contributions in characterizing, quantifying, understanding, and predicting the evolution of global carbon sources and sinks through improved monitoring of carbon stocks and fluxes. The System will use the full range of NASA satellite observations and modeling/analysis capabilities to establish the accuracy, quantitative uncertainties, and utility of products for supporting national and international policy, regulatory, and management activities. CMS will maintain a global emphasis while providing finer scale regional information, utilizing space-based and surface-based data and will rapidly initiate generation and distribution of products both for user evaluation and to inform near-term policy development and planning.
Related Publication:
Simard, M., L. Fatpyinbo, C. Smetanka, V.H. Rivera-Monroy, E. Castaneda-Moya, N. Thomas, and T. Van der Stocken. 2019. Mangrove canopy height globally related to precipitation, temperature and cyclone frequency. Nature Geoscience, 12: 40–45. https://doi.org/10.1038/s41561-018-0279-1
Related Datasets:
Lagomasino, D., T. Fatoyinbo, S. Lee, E. Feliciano, M. Simard, and C. Trettin. 2016. CMS: Mangrove Canopy Height Estimates from Remote Imagery, Zambezi Delta, Mozambique. ORNL DAAC, Oak Ridge, Tennessee, USA. http://dx.doi.org/10.3334/ORNLDAAC/1357
Fatoyinbo, T., E. Feliciano, D. Lagomasino, S. Lee, and C. Trettin. 2017. CMS: Aboveground Biomass for Mangrove Forest, Zambezi River Delta, Mozambique. ORNL DAAC, Oak Ridge, Tennessee, USA. https://doi.org/10.3334/ORNLDAAC/1522
Lagomasino, D., T. Fatoyinbo, S. Lee, E. Feliciano, C. Trettin, A. Shapiro, and M. Mwita. 2019. CMS: Mangrove Forest Cover Extent and Change across Major River Deltas, 2000-2016. ORNL DAAC, Oak Ridge, Tennessee, USA. https://doi.org/10.3334/ORNLDAAC/1670
Acknowledgements: Carbon Monitoring Systems grant N4-CMS14-0028.
Data Characteristics
Spatial Coverage: Global within a circum-equatorial band from 31 degrees north to 39 degrees south
Spatial Resolution: 30 m
Temporal Coverage: 2000-01-01 to 2009-12-31
Temporal Resolution: One-time estimates for nominal year 2000 of AGB, maximum canopy height, and basal-area weighted height across the global mangrove ecotype extent. In situ data were collected within a 15-year period after the SRTM data were obtained (2000): August 20, 2004 to May 22, 2014.
Study Area (All latitudes and longitudes are given in decimal degrees)
| Site | Westernmost Longitude | Easternmost Longitude | Northernmost Latitude | Southernmost Latitude |
|---|---|---|---|---|
| Global equatorial | -180 | 180 | 31.000138889 | -39.00013889 |
Data File Information
There are 348 data files in GeoTIFF format (.tif) with this dataset. The three data products: mangrove aboveground biomass (agb), maximum height (hmax), and basal area weighted height (hba) are provided in separate files for each of the 116 countries. Filenames include the country name. The in situ tree measurements are provided in a single .csv file.
Table 1. Data file descriptions
| File name | Variable/Description | Units |
|---|---|---|
| Mangrove_agb_country.tif | Aboveground mangrove biomass | Mg ha-1 |
| Mangrove_hba_country.tif | Mangrove basal-area weighted height (individual tree heights weighted in proportion to their basal area) | meters |
| Mangrove_hmax_country.tif | Mangrove canopy maximum height (height of the tallest tree) | meters |
| North_South_America_tree_measurements.csv | In situ mangrove tree measurements for locations on the coasts of North and South America. |
GeoTIFF File Properties: No data value: 0, Number of bands: one, Resolution: 30 m, EPSG: 4326
Table 2. Variables in North_South_America_tree_measurements.csv
| Column name | Units/format | Type | Description |
|---|---|---|---|
| ID | Character | A unique identifier for locating a specific observation. A combination of plot_name and tree number fields. | |
| region | Character | Continent or subcontinent of observation | |
| subregion | Character | Country or state of observation | |
| biome | Character | Biome type of observation - all mangrove | |
| date | yyyy-mm-dd | Date | Date of observation |
| plot_name | Character | Plot name | |
| tree_number | Character | Unique identifier for a tree in a specific plot. Trees characterized as “Severe inclined” were sometimes measured without assigning a number. These trees have been assigned M1, M2, M3, etc. within a plot. | |
| genus | Character | Genus | |
| species | Character | Species | |
| dbh | cm | Numeric | Diameter at breast height (1.3 m), check tree_notes as some were estimated dbh |
| height | meters | Numeric | height of tree, check tree_notes as some were modeled height |
| live | Numeric | 1 indicates tree is alive. 0 indicates tree is dead | |
| tree_notes | Character | specific notes about a tree | |
| use_for_allometry | Numeric | 1 indicates tree was used for allometry, 0 indicates it was not. | |
| plot_type | Character | f = fixed plot size, v = variable plot size | |
| plot_shape | Character | shape of plot: s and square; r, circle, and circular. Missing when plot_type = v. | |
| baf | Numeric | basal area factor: with a value of 5 for plot_type = v, otherwise missing | |
| plot_area | m^2 | Numeric | plot area |
| lat1 | Numeric | latitude of plot location (center of circular and variable shape plots or a plot corner for square plots) | |
| lon1 | Numeric | longitude of plot location (center of circular and variable shape plots or a plot corner for square plots) | |
| lat2 | Numeric | latitude of plot location (latitude of a plot corner for square plots, otherwise missing) | |
| lon2 | Numeric | longitude of plot location (longitude of a plot corner for square plots, otherwise missing) | |
| lat3 | Numeric | latitude of plot location (latitude of a plot corner for square plots, otherwise missing) | |
| lon3 | Numeric | longitude of plot location (longitude of a plot corner for square plots, otherwise missing) | |
| lat4 | Numeric | latitude of plot location (latitude of a plot corner for square plots, otherwise missing) | |
| lon4 | Numeric | longitude of plot location (longitude of a plot corner for square plots, otherwise missing) | |
| collected_by | Character | Collector of field observations | |
| digitized_by | Character | Performer of GIS activities |
Application and Derivation
Mangrove wetlands are among the most productive and carbon-dense ecosystems in the world. Their structural attributes vary considerably across spatial scales, yielding large uncertainties in regional and global estimates of carbon stocks. This study offers a baseline to monitor national and regional trends in mangrove carbon stocks (Simard et al., 2019).
Quality Assessment
Uncertainty was addressed by calibration with ICESat/GLAS Spaceborne Lidar mission data, refining the range of elevation data identified as mangrove cover, and subsequent validation by field data. The study only included areas with Shuttle Radar Topography Mission (SRTM) elevation values ranging from 0 to 55 m to eliminate inland areas over-classified as mangrove wetlands.
The relationship between SRTM and Basal Area Weighted Height (Hba) had a correlation coefficient R2 value of 0.78 and RMSE of 3.60 m at global scales. Additionally, SRTM values versus field measurements of max height (Hmax) had a correlation coefficient R2 of 0.70 and RMSE of 5.80 m globally. Analysis of canopy height variance obtained from SRTM, lidar, and field measurements demonstrated that SRTM height characterizes mean overstory canopy height and maintains consistency over time when measuring canopy height in established mangrove forests. Regional biomass allometric models developed for this study had a combined RMSE of 57.2 Mg ha-1 (ranging from 46.6 Mg ha-1 to 72.0 Mg ha-1) and an R2 of 0.77. The global biomass allometric model had a root mean square error (RMSE) of 87.9 and correlation coefficient R2 of 0.62. See Simard et al. (2019) for more details.
Data Acquisition, Materials, and Methods
Following is a brief synopsis of the data collection, data processing, and modeling methods implemented to produce the three mangrove products and in situ field data. See Simard et al. (2019) for more details.
Mangrove ecotype extent map
To identify mangrove ecotype areas and mask non-mangrove regions in the SRTM elevation dataset, we used the global mangrove extent map from Giri et al. (2011). This map is coincidental with the SRTM data set (that is, they are both from 2000) and, so far, it is the only one that specifically maps mangroves from Landsat data at 30-m resolution. Only areas with SRTM elevation values ranging from 0 to 55 m above mean sea level were included so as to remove some areas falsely identified as mangroves. This threshold value preserves the tallest mangrove forest stands.
Mangrove canopy height estimation with SRTM and ICESat/GLAS
The canopy height maps were generated using SRTM DEM data collected in February 2000 and lidar heights from the ICESat/GLAS Spaceborne Lidar mission. GLAS lidar altimetry data were collected globally from 2003 to 2009, providing the only global lidar canopy and height measurement, with sparse samples distributed across the globe. The GLAS lidar-derived maximum canopy height is defined as the height of the lidar pulse containing all its energy between the ground and the top of the tallest tree (referred to as the relative height of the 100th percentile, RH100). A regression model was applied relating GLAS RH100 to SRTM elevation measurements obtain a global map of maximum canopy height:
SRTMHmax = 1.697 × HSRTM
where HSRTM represents the original SRTM DEM, and SRTMHmax is the new maximum canopy height data set. The mean and maximum SRTMHmax values were computed for each country.
The SRTM estimates of Hmax (that is, SRTMHmax) were validated with in situ collected data in Pongara National Park to confirm the validity of the tallest canopy height values in Gabon. The heights of five of the tallest observed trees were measured using a laser rangefinder, confirming the location of the areas with the tallest mangrove canopy in the world (with all five trees measuring between 62 m and 65 m). In addition to Hmax, a map of Hba, the basal area weighted height was generated and used as input for the AGB map. SRTMHba was calculated by relating field values of Hba to SRTM DEM elevations:
SRTMHba = 1.0754 × HSRTM
where HSRTM represents the original SRTM DEM and SRTMHba the new basal area weighted canopy height dataset.
In situ forest measurement locations
The selected field sites (331 plots in total) included a wide variety of forest structure and mangrove ecotypes (for example, scrub, fringe, riverine and basin) with measured in situ tree heights ranging from 1 to 65 m. The mangrove field sites (Figure 2a) were distributed along a latitudinal range from 26º S (Maputo Reserve, Mozambique) to 25º N (Everglades, USA), encompassing the equatorial region. In situ data were collected within a 15-year period after the SRTM data were obtained (2000).
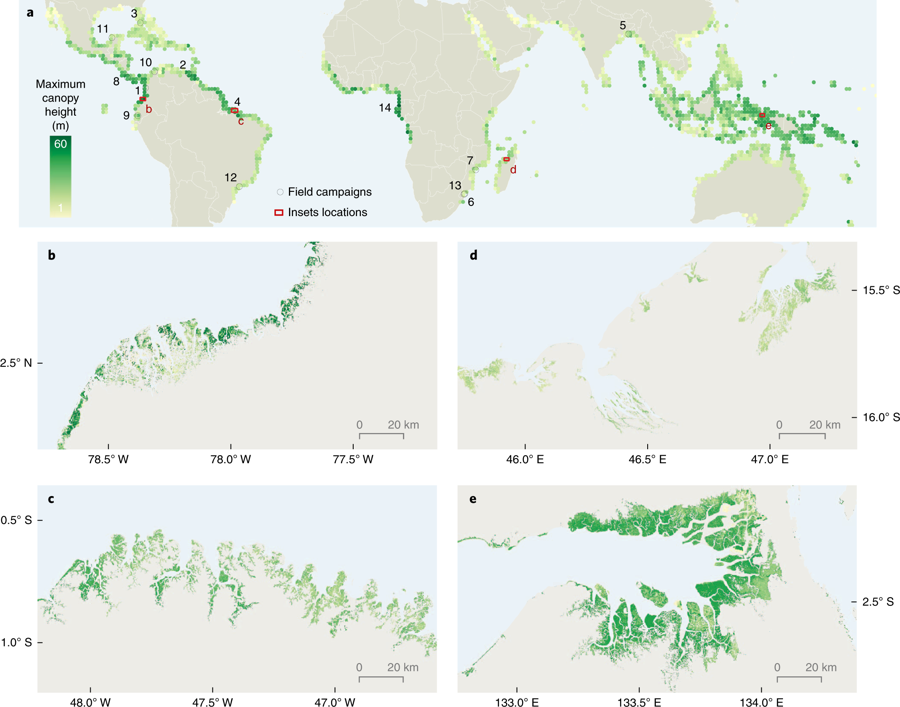
Figure 2. Global map of mangrove maximum canopy height and location of sampling sites (numbers) where in situ data were collected. High-resolution insets in b–e: (b) Coastal Nariño and Cauca (Colombia),(c) Coastal Pará (Brazil), (d) Bombetoka Bay (Madagascar), and (e) Bintuni Bay (West Papua, Indonesia). From Simard et al. (2019).
Data Source User Notes:
- Only data for North and South American locations are provided in this dataset.
- Data for the Zambezi delta are publicly available at: https://www.fs.usda.gov/rds/archive/catalog/RDS-2017-0053.
- The data collected at the Sundarbans, Khulna, Bangladesh location are not public. See the publication: Rahman, M. M., Khan, M. N. I., Hoque, A. K. F. & Ahmed, I. Carbon stock in the Sundarbans mangrove forest: spatial variations in vegetation types and salinity zones. Wetl. Ecol. Manag. 23, 269–283 (2015). https://doi.org/10.1007/s11273-014-9379-x
Estimating forest structure attributes
Field data were used to estimate forest structure attributes (that is, Hba, Hmax and AGB). Most of the data were collected in field plots throughout the Americas and Africa, using fixed or variable plot sizes. Within variable plots, trees were selected using a fixed-angle gauge. For each selected tree, the species was identified and the diameter at breast height (DBH) and height were measured using a laser rangefinder or clinometer.
For all sites, field basal area weighted height Hba was calculated as
Hba = ∑i(πr2i×Hi) / ∑i(πr2i)
where Hi and ri are the height and radius (that is, DBH/2) of tree i, respectively, in meters.
Hmax was defined as the height of the tallest tree within a plot.
Tree density
Users can estimate the tree density, as the total number of trees within the plot normalized by plot area. However, for the plots sampled with the “variable plot method (v)”, a fixed plot area is not available. For tree density estimates in plots using a variable plot method, each tree has its own plot size given the tree dbh and the ‘baf’ (Basal Area Factor) (Simard et al., 2009). For all variable plots: baf = 5. At baf=5, the cruising angle is 0.02249719.
Thus, plot area can be derived from the following equation:
Plot area (m^2) = Pi *(DBH/(100*CA))^2, where DBH is diameter at breast height and CA is the cruising angle.
After applying this equation to all trees within the variable plot, normalize tree density by hectares. To do this, divide the number of m^2 in a hectare by the average plot area: 10000/ average plot area = tree density per hectare.
Global mangrove biomass allometry development
The in situ field data were used to derive stand-level allometry between AGB, basal area weighted height Hba and maximum canopy height Hmax. AGB was estimated for each individual tree tagged inside the plot, using regional or site-specific allometric equations as described by previous studies. The Chave et al. (2014) generalized pantropical tree allometric model was used with species-specific wood density from the global wood density database (Chave et al., 2009) to calculate the above- and belowground (root) biomass of individual trees. The sum of individual trees within the plot was then computed and normalized, using plot sizes, to represent total forest stand AGB density in Mg ha–1. Regional and global models were generated between plot-level canopy height and plot-level AGB density, where height and AGB relationships were fitted to the regression model:
AGB = a × Hxb
where Hx can represent either Hba or Hmax. The global model was generated using all of the plot data (n = 331) and Hba of the field data, while the regional models were generated for the Americas (using data from Colombia, USA, Venezuela, Brazil, Costa Rica, Ecuador, Mexico, n = 81), East Africa (using data from Mozambique, n = 101) and South Asia (using data from Bangladesh, n = 149).
Large-scale AGB estimation with SRTM
The global mangrove forest AGB map was generated by linking the field-measured biomass–height allometry (described above) with SRTM estimates of Hba (that is, SRTMHba). This procedure is a two-step process where SRTM is converted to SRTMHba and then to AGB using appropriate field-derived Hba to AGB allometry. Total (above- and belowground) biomass and carbon stock estimates by country were generated by summing all corresponding pixels, while accounting for belowground biomass and soil carbon. The total aboveground carbon stocks per country were calculated assuming a stoichiometric factor of 0.451 as the AGB conversion factor. Total root biomass was estimated as 49% of the AGB.
Data Access
These data are available through the Oak Ridge National Laboratory (ORNL) Distributed Active Archive Center (DAAC).
Global Mangrove Distribution, Aboveground Biomass, and Canopy Height
Contact for Data Center Access Information:
- E-mail: uso@daac.ornl.gov
- Telephone: +1 (865) 241-3952
References
Chave, J., D. Coomes, S. Jansen, S.L. Lewis, N.G. Swenson, and A.E. Zanne. 2009. Towards a worldwide wood economics spectrum. Ecology Letters, 12: 351–366. https://doi.org/10.1111/j.1461-0248.2009.01285.x
Chave, J., M. Rejou-Mechain, A. Búrquez, E. Chidumayo, M.S. Colgan, W.B.C. Delitti, A. Duque, T. Eid, P.M. Fearnside, R.C. Goodman, M. Henry, A. Martinez-Yrizar, W.A. Mugasha, H.C. Muller-Landau, M. Mencuccini, B.W. Nelson, A. Ngomanda, E.M. Nogueira, E. Ortiz-Malavassi, R. Pélissier, P. Ploton, C.M. Ryan, J.G. Saldarriaga, and G. Vieilledent. 2014. Improved allometric models to estimate the aboveground biomass of tropical trees. Global Change Biology, 20, 3177–3190. https://doi.org/10.1111/gcb.12629
Giri, C., Ochieng, E., Tieszen, L. L., Zhu, Z., Singh, A., Loveland, T., Masek, J. and Duke, N. 2011. Status and distribution of mangrove forests of the world using earth observation satellite data. Global Ecology and Biogeography, 20: 154-159. https;//doi.org/:10.1111/j.1466-8238.2010.00584.x
Rahman, M. M., Khan, M. N. I., Hoque, A. K. F. & Ahmed, I. Carbon stock in the Sundarbans mangrove forest: spatial variations in vegetation types and salinity zones. Wetl. Ecol. Manag. 23, 269–283 (2015). https://doi.org/10.1007/s11273-014-9379-x
Simard M, Fatoyinbo T.E., Pinto N (2009), ”Mangrove Canopy 3D Structure and Ecosystem Productivity Using Active Remote Sensing”, book chapter In Remote Sensing of Coastal environments, Taylor and Francis Group LLC, Yeqiao Wang ed. ISBN 978-1-4200-9441-1
Simard, M., L. Fatoyinbo, C. Smetanka, V.H. Rivera-Monroy, E. Castaneda-Moya, N. Thomas, and T. Van der Stocken. 2019. Mangrove canopy height globally related to precipitation, temperature and cyclone frequency. Nature Geoscience, 12: 40–45. https://doi.org/10.1038/s41561-018-0279-1
Dataset Revisions
Version 1.3: The in situ tree measurement data file and documentation were added in April 2021. No changes to previously archived data.
Version 1.2: Data files were updated in May 2019 because the height to biomass (AGB) conversion equations in the associated Nature Geoscience publication were correct but were implemented incorrectly when generating the publicly available data files. These have now been corrected. The Hba and Hmax data were updated so that they are now capped at the 95th percentile of the maximum value (55 m), as outlined in the publication. Countries without Hba and Hmax data have been omitted.
Version 1.1: Science-quality data were released in March 2019. All preliminary data files were replaced with new files that incorporated some changes to the aboveground biomass estimation algorithm. In addition, several files with missing data were replaced.
Version 1.0: Preliminary data were released in November 2018 to accompany the publication of the Simard et al, 2019 paper in Nature Geosciences.