Documentation Revision Date: 2022-03-17
Dataset Version: 1
Summary
There are 115 data files in GeoTiff (*.tif) format included in this dataset, generally three files for each of 39 countries. Also included is one companion file in Portable Document (*.pdf) format.
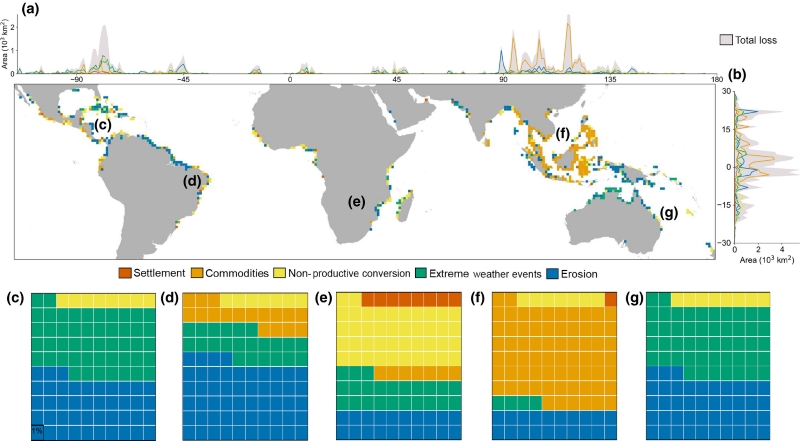
Figure 1. Global distribution of mangrove loss and its drivers. (a) The longitudinal distribution of total mangrove loss and the relative contribution of its primary drivers. Different colors represent unique drivers of mangrove loss. (b) The latitudinal distribution of total mangrove loss and the relative contribution of its primary drivers. (c-g) Global distribution of mangrove loss and associated drivers from 2000 to 2016 at 1-degree x 1-degree resolution, with the relative contribution (percentage) of primary drivers per continent: (c) North America, (d) South America, (e) Africa, (f) Asia, (g) Australia together with Oceania. Source: Goldberg et al. (2020)
Citation
Goldberg, L., D. Lagomasino, N. Thomas, and T. Fatoyinbo. 2022. Global Mangrove Loss Extent, Land Cover Change, and Loss Drivers, 2000-2016. ORNL DAAC, Oak Ridge, Tennessee, USA. https://doi.org/10.3334/ORNLDAAC/1768
Table of Contents
- Dataset Overview
- Data Characteristics
- Application and Derivation
- Quality Assessment
- Data Acquisition, Materials, and Methods
- Data Access
- References
Dataset Overview
This dataset provides estimates of the extent of mangrove loss, land cover change, and its anthropogenic or climatic drivers in three periods: 2000–2005, 2005–2010, and 2010–2016. Landsat-based Normalized Difference Vegetation Index (NDVI) anomalies were used to determine loss extent in each period. The drivers of mangrove loss were determined by examining land cover changes using a random forest machine learning technique that considered change from mangrove to wet soil, dry soil, and water at each loss pixel. A series of decision trees used several global-scale land-use datasets to identify the ultimate driver of the mangrove loss. Loss drivers include commodity production (agriculture, aquaculture), settlement, erosion, extreme climatic events, and non-productive conversion. Maps of loss extent per period, mangrove land cover changes, and loss drivers are provided for each of 39 mangrove holding nations.
Project: Carbon Monitoring System
The NASA Carbon Monitoring System (CMS) is designed to make significant contributions in characterizing, quantifying, understanding, and predicting the evolution of global carbon sources and sinks through improved monitoring of carbon stocks and fluxes. The System will use the full range of NASA satellite observations and modeling/analysis capabilities to establish the accuracy, quantitative uncertainties, and utility of products for supporting national and international policy, regulatory, and management activities. CMS will maintain a global emphasis while providing finer scale regional information, utilizing space-based and surface-based data and will rapidly initiate generation and distribution of products both for user evaluation and to inform near-term policy development and planning.
Related Publication
Goldberg, L., D. Lagomasino, N. Thomas, and T. Fatoyinbo. 2020. Global declines in human-driven mangrove loss. Global Change Biology 26:5844-5855. https://doi.org/10.1111/gcb.15275
Related Datasets
Lagomasino, D., T. Fatoyinbo, S. Lee, E. Feliciano, C. Trettin, and M.C. Hansen. 2017. CMS: Mangrove Canopy Characteristics and Land Cover Change, Tanzania, 1990-2014. ORNL DAAC, Oak Ridge, Tennessee, USA. https://doi.org/10.3334/ORNLDAAC/1377
Lagomasino, D., T. Fatoyinbo, S. Lee, E. Feliciano, C. Trettin, A. Shapiro, and M. Mwita. 2019. CMS: Mangrove Forest Cover Extent and Change across Major River Deltas, 2000-2016. ORNL DAAC, Oak Ridge, Tennessee, USA. https://doi.org/10.3334/ORNLDAAC/1670
Simard, M., T. Fatoyinbo, C. Smetanka, V.H. Rivera-monroy, E. Castaneda, N. Thomas, and T. Van der stocken. 2019. Global Mangrove Distribution, Aboveground Biomass, and Canopy Height. ORNL DAAC, Oak Ridge, Tennessee, USA. https://doi.org/10.3334/ORNLDAAC/1665
Acknowledgments
This study was funded by the NASA Carbon Monitoring Systems (grant 16-CMS16-0073) and NASA New Investigator Program (grant 15-NIP15-0068).
Data Characteristics
Spatial Coverage: Global within a circum-equatorial band from 31 degrees north to 39 degrees south
Spatial Resolution: 0.0003 degrees (~30 m)
Temporal Coverage: 2000-01-01 to 2016-12-31
Temporal Resolution: Three time periods: 2000-01-01 to 2005-12-31, 2005-12-31 to 2010-12-31, 2010-12-31 to 2016-12-31
Study Area: Latitude and longitude are given in decimal degrees.
| Site | Westernmost Longitude | Easternmost Longitude | Northernmost Latitude | Southernmost Latitude |
|---|---|---|---|---|
| Global, equatorial | -94.56069 | 164.69125 | 27.04319 | -58.44958 |
Data File Information
There are 115 data files in GeoTiff (*.tif) format included in this dataset, generally* three files for each of 39 countries. The cell values for the data are described in Table 1 and the abbreviated country names used in the file name are provided in Table 2. Also included is one companion file in Portable Document (*.pdf) format named Mangrove_Loss_Driver_ErrorMatrix.pdf, which provides the uncertainties in mangrove loss driver maps.
Table 1. File names and descriptions. XXX in the file names refers to the country abbreviation (Table 2).
| File Name | Description | Cell Values |
|---|---|---|
| loss_epoch_XXX.tif * | 39 files providing losses for the time periods (epoch) 2000–2005, 2005–2010, and 2010–2016. | 0: Lost between 2000-2005 1: Lost between 2005-2010 2: Lost between 2010-2016 |
| land_cover_change_class_XXX.tif * | 38 files providing land cover changes. | 0: Conversion from mangrove to dry soil 1: Conversion from mangrove to water 2: Conversion from mangrove to wet soil (mud flat) |
| loss_driver_class_XXX.tif | 39 files- providing loss drivers for 39 countries. | 0: Erosion 1: Conversion by extreme weather events 2: Commodities 3: Settlement 4: Non-productive conversion |
* Data are not provided for Gabon.
Data File Details
The Coordinate Reference System is "WGS 84" (EPSG:4326).
Table 2. Country names and abbreviations used in file names.
| Country Name | Country Code |
|---|---|
| Australia | AUS |
| Bangladesh | BGD |
| Belize | BLZ |
| Benin | BEN |
| Brunei Darussalam | BRN |
| Cambodia | KHM |
| Cameroon | CMR |
| Costa Rica | CRI |
| Djibouti | DJI |
| Dominican Republic | DOM |
| El Salvador | SLV |
| French Guiana | GUF |
| Gabon (1 file-loss driver class) | GAB |
| Gambia | GMB |
| Ghana | GHA |
| Guatemala | GTM |
| Guinea | GIN |
| Guinea-Bissau | GNB |
| Guyana | GUY |
| Haiti | HTI |
| Jamaica | JAM |
| Lao People's Democratic Republic | LAO |
| Liberia | LBR |
| Nicaragua | NIC |
| Panama | PAN |
| Puerto Rico | PRI |
| Qatar | QAT |
| Senegal | SEN |
| Sierra Leone | SLE |
| Singapore | SGP |
| Suriname | SUR |
| Tanzania, United Republic of | TZA |
| Thailand | THA |
| Timor-Leste | TLS |
| Togo | TGO |
| Trinidad and Tobago | TTO |
| Turks and Caicos Islands | TCA |
| Venezuela (Bolivarian Republic of) | VEN |
| Viet Nam | VNM |
User Note: This dataset includes data for 39 countries and 115 data files. 236 data files were not included in the dataset (i.e., files for 78 countries) owing to missing data.
Application and Derivation
The high ecological and economic value of global mangrove ecosystems, combined with their high loss rates, has incentivized a range of global restoration and conservation initiatives in recent years. However, widespread restoration failures reveal a lack of knowledge of the initial cause of mangrove loss. Without spatially explicit, locally-relevant information on the extent and causes of both the initial loss and continued forest threats, mitigating these anthropogenic or climatic pressures is extremely difficult. This study expanded regional loss driver analysis to the global scale, substantially increasing the spatial resolution of past driver maps from 10 km to 30 m resolution and disaggregating anthropogenic and climatic stressors.
Quality Assessment
A stratified random sampling approach was used to calculate the loss area uncertainty in each driver class.
The class assignment of each validation point was evaluated using an RSGISLib-based QGIS class accuracy plugin that enabled reference to the most recent Google Earth imagery in all locations. An error matrix was derived for the 2,476 sample counts, calculating the producer’s accuracy, user’s accuracy, and overall accuracy. The variance was then calculated for each of the accuracies to estimate the 95% confidence interval. Using the original area proportions for each class and the estimated area proportions from the reference data, a reference-corrected estimate of the total areas was derived for each mangrove loss driver.
An error matrix table for each driver class is included as the companion file Mangrove_Loss_Driver_ErrorMatrix.pdf.
See Goldberg et al. (2020) for details of this analysis and its results.
Data Acquisition, Materials, and Methods
Mapping Mangrove Loss
The study area for this research was based on a global map of mangrove extent produced by Giri et al. (2011). A Landsat-based NDVI anomaly algorithm was used to aggregate changes in mangrove greenness over time, identifying pixels of loss. A reference period was designated using the median NDVI value from January 1998 through December 2001 covering Landsat 5 TM and Landsat 7 ETM+ images. The reference NDVI for the period 1998–2001 was then subtracted from each of the images in the observation period, which ranged from January 2001 through December 2016 as outlined in Lagomasino et al. (2019). The differences were summed to represent the cumulative anomaly. Anomaly values were normalized and a value of -0.2 was considered to be a permanent loss of mangrove forest. This analysis was repeated for three time periods: 2000–2005, 2005–2010, and 2010–2016.
User Note: This dataset includes data for 39 countries and 115 data files; 236 data files (i.e., for 78 countries) are not included in this dataset owing to missing data.
Land Cover Changes Associated with Mangrove Loss
A machine learning-based classification approach to map land cover changes in all loss pixels. Land cover type was classified for three training points in a sample of 1-degree x 1-degree grid cells (n=1168) holding mangrove forest in 2000. Pixels within a circular 1-ha window were classified using a random forest algorithm. Since spectral characteristics alone were insufficient to distinguish some land cover (e.g., natural water bodies vs. aquaculture), a decision tree model was used to separate land covers into five drivers of mangrove loss: erosion, commodity production, settlement, non-productive conversion, and extreme weather events. Commodity-based drivers include the conversion of mangroves to agriculture or aquaculture uses.
Validation
Accuracy of land use change maps and of area estimates of mangrove loss was estimated by examining 2476 validation points across the global study area. For each point, mangrove forest status and land covers were examined using Google Earth imagery. This validation process resulted in an error matrix available in the companion file Mangrove_Loss_Driver_Error_Matrix.pdf.
Overall map accuracy was 81.5%. The user's accuracies for each class were 88.3% for commodities, 81.6% for erosion, 77.5% for settlement, 72.3% for non-productive conversion, and 68.1% for extreme weather events. Producer's accuracies for each class were 89.0% for commodity production, 85.2% for settlement, 78.0% for extreme weather events, 75.5% for erosion, and 74.6% for non-productive conversion.
See Goldberg et al. (2020) for details of this analysis and its results.
Data Access
These data are available through the Oak Ridge National Laboratory (ORNL) Distributed Active Archive Center (DAAC).
Global Mangrove Loss Extent, Land Cover Change, and Loss Drivers, 2000-2016
Contact for Data Center Access Information:
- E-mail: uso@daac.ornl.gov
- Telephone: +1 (865) 241-3952
References
Giri, C., E. Ochieng, L.L. Tieszen, Z. Zhu, A. Singh, T. Loveland, J. Masek, and N. Duke. 2011. Status and distribution of mangrove forests of the world using earth observation satellite data. Global Ecology and Biogeography 20:154-159. https;//doi.org/:10.1111/j.1466-8238.2010.00584.x
Goldberg, L., D. Lagomasino, N. Thomas, and T. Fatoyinbo. 2020. Global declines in human-driven mangrove loss. Global Change Biology 26:5844-5855. https://doi.org/10.1111/gcb.15275
Lagomasino, D., T.L. Fatoyinbo, S.K. Lee, E.A. Feliciano, C. Trettin, A.C. Shapiro, and M.M. Mangora. 2019. Measuring mangrove carbon loss and gain in deltas. Environmental Research Letters 14:025002. https://doi.org/10.1088/1748-9326/aaf0de