Documentation Revision Date: 2020-07-20
Dataset Version: 1.1
Summary
There are 17 total data files in GeoTIFF (.tif) format: nine files with estimates of forest carbon stocks and fluxes and eight files of model input data.
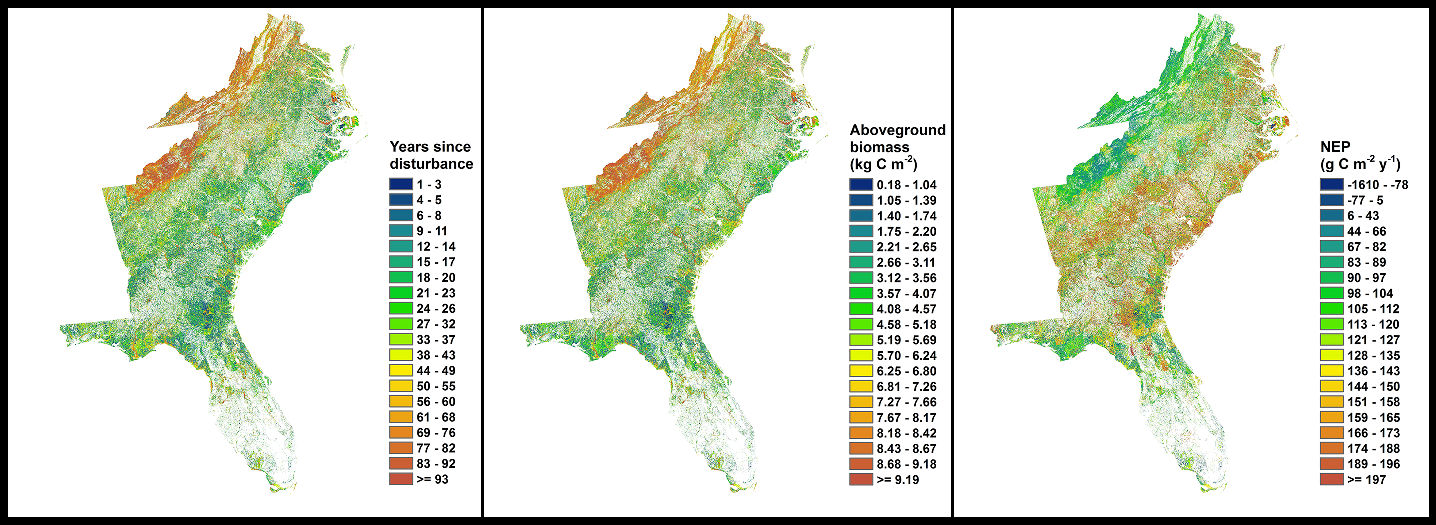
Figure 1. Maps of the number of years since the most recent disturbance, aboveground biomass, and net ecosystem productivity in the year 2010. After Gu et al. (2019).
Citation
Gu, H., C.A. Williams, N. Hasler, and Y. Zhou. 2019. Forest Carbon Stocks and Fluxes After Disturbance, Southeastern USA, 1990-2010. ORNL DAAC, Oak Ridge, Tennessee, USA. https://doi.org/10.3334/ORNLDAAC/1728
Table of Contents
- Dataset Overview
- Data Characteristics
- Application and Derivation
- Quality Assessment
- Data Acquisition, Materials, and Methods
- Data Access
- References
- Dataset Revisions
Dataset Overview
This dataset provides estimates of forest carbon stocks and fluxes in the form of aboveground woody biomass (AGB) and net ecosystem productivity (NEP), as a function of the number of years since the most recent disturbance (i.e., stand age) for forests in the southeastern USA at a 30 m resolution for the benchmark years 1990, 2000, and 2010. The study area includes: Virginia, North Carolina, South Carolina, Georgia, and Florida. Estimates were derived from an inventory-constrained version of the Carnegie-Ames-Stanford Approach (CASA) carbon cycle process model that accounts for disturbance processes as a function of years since disturbance for each combination of forest type, site productivity, and pre-disturbance biomass. Also provided are the core CASA model data inputs including: the year of the most recent disturbance according to the North American Forest Dynamics (NAFD), the Aerial Detection Survey (ADS), and the Monitoring Trends in Burn Severity (MTBS) data products; the type of disturbance; biomass estimates from the year 2000 according to the National Biomass and Carbon Dataset (NBCD); forest type group; a site productivity classification; and the number of years since stand-replacing disturbance, which is akin to forest stand age.
Project: Carbon Monitoring System
The NASA Carbon Monitoring System (CMS) is designed to make significant contributions in characterizing, quantifying, understanding, and predicting the evolution of global carbon sources and sinks through improved monitoring of carbon stocks and fluxes. The System will use the full range of NASA satellite observations and modeling/analysis capabilities to establish the accuracy, quantitative uncertainties, and utility of products for supporting national and international policy, regulatory, and management activities. CMS will maintain a global emphasis while providing finer scale regional information, utilizing space-based and surface-based data and will rapidly initiate generation and distribution of products both for user evaluation and to inform near-term policy development and planning.
Related Publication
Gu H., C.A. Williams, N. Hasler and Y. Zhou. 2019. The Carbon Balance of the Southeastern Forest Sector as Driven by Recent Disturbance Trends. Journal of Geophysical Research – Biogeosciences:124. https://doi.org/10.1029/2018JG004841
Related Datasets
Kellndorfer, J., W. Walker, K. Kirsch, G. Fiske, J. Bishop, L. Lapoint, M. Hoppus, and J. Westfall. 2013. NACP Aboveground Biomass and Carbon Baseline Data, V.2 (NBCD 2000), U.S.A., 2000. ORNL DAAC, Oak Ridge, Tennessee, USA. https://doi.org/10.3334/ORNLDAAC/1161
Goward, S.N., C. Huang, F. Zhao, K. Schleeweis, K. Rishmawi, M. Lindsey, J.L. Dungan, and A. Michaelis. 2015. NACP NAFD Project: Forest Disturbance History from Landsat, 1986-2010. ORNL DAAC, Oak Ridge, Tennessee, USA. https://doi.org/10.3334/ORNLDAAC/1290
Acknowledgments
This work was funded by NASA’s CMS program (NNH14ZDA001N-CMS) under award NNX14AR39G, NASA’s Carbon Cycle Science program (NNH13ZDA001N-CARBON) under a subcontract on award NNX14AJ17G, as well as NASA’s EVS-2 Atmospheric Carbon and Transport America project (ACT-America) on award NNX16AN17G.
Data Characteristics
Spatial Coverage: Southeastern USA
Spatial Resolution: 30 m
Temporal Coverage: 1990-01-01 to 2010-12-31
Temporal Resolution: annual data for selected years
Study Area: All latitude and longitude given in decimal degrees.
| Site | Westernmost Longitude |
Easternmost Longitude |
Northernmost Latitude |
Southernmost Latitude |
|---|---|---|---|---|
| Southeastern USA | -89.010314 | -71.27984 | 40.88943 | 23.228331 |
Data File Information
There are 17 total data files in GeoTIFF (.tif) format: nine files with estimates of forest carbon stocks and fluxes and eight files of model input data.
| Filename | Units | Description |
|---|---|---|
| agb_1990.tif | Kg C m-2 | aboveground biomass in kilograms of carbon per square meter for the year 1990 |
| age_1990.tif | years | number of years since the most recent disturbance relative to the year 1990 (i.e., forest stand age) |
| nep_1990.tif | g C m-2 year-1 | net ecosystem productivity in grams of carbon per square meter per year for the year 1990 |
| agb_2000.tif | Kg C m-2 | aboveground biomass in kilograms of carbon per square meter for the year 2000 |
| age_2000.tif | years | number of years since the most recent disturbance relative to the year 2000 (i.e., forest stand age) |
| nep_2000.tif | g C m-2 year-1 | net ecosystem productivity in grams of carbon per square meter per year for the year 2000 |
| agb_2010.tif | Kg C m-2 | aboveground biomass in kilograms of carbon per square meter for the year 2010 |
| age_2010.tif | years | number of years since the most recent disturbance relative to the year 2010 (i.e., forest stand age) |
| nep_2010.tif | g C m-2 year-1 | net ecosystem productivity in grams of carbon per square meter per year for the year 2010 |
| Input Data Products | ||
| biomass_NBCD.tif | Kg C m-2 | aboveground biomass in kilograms of carbon per square meter according to the National Biomass and Carbon Dataset (NBCD) |
| forest_productivity_NAFD.tif | decimal fraction | fraction of high productivity according to the North American Forest Dynamics (NAFD) |
| forest_group_NAFD.tif | category | category of forest according to the North American Forest Dynamics (NAFD). Categories listed below. |
| type_cover_years_disturb_NAFD.tif | category | category of landcover and, for the disturbed landcover category only, and the number of years since the most recent disturbance according to the North American Forest Dynamics (NAFD); for values 16 and greater, add 1970 to get the year of the disturbance. Categories listed below. |
| type_disturb_composite.tif | category | category of disturbance according to the North American Forest Dynamics (NAFD), the Aerial Detection Survey (ADS), and the Monitoring Trends in Burn Severity (MTBS) composite. Categories listed below. |
| years_disturb_composite.tif | years since 1970 | number of years since the most recent disturbance according to the North American Forest Dynamics (NAFD), the Aerial Detection Survey (ADS), and the Monitoring Trends in Burn Severity (MTBS) composite; add 1970 to the pixel value to get the year of the disturbance |
| years_disturb_ADS.tif | years since 1970 | number of years since the most recent disturbance according to the Aerial Detection Survey (ADS); add 1970 to the pixel value to get the year of the disturbance |
| years_disturb_MTBS.tif | years since 1970 | number of years since the most recent disturbance according to the Monitoring Trends in Burn Severity (MTBS); add 1970 to the pixel value to get the year of the disturbance |
Data File Details
The coordinate reference system is EPSG:42303 (NAD83 / Albers NorthAm) except for biomass_NBCD.tif which uses EPSG:5070 (NAD83 / Conus Albers).
| Filename | Min value | Max value | No data value |
|---|---|---|---|
| agb_1990.tif | 286 | 11613 | 32767 |
| age_1990.tif | 1 | 120 | 0 |
| nep_1990.tif | -1577 | 331 | 32767 |
| agb_2000.tif | 192 | 12949 | 32767 |
| age_2000.tif | 1 | 120 | 0 |
| nep_2000.tif | -1564 | 263 | 32767 |
| agb_2010.tif | 175 | 13070 | 32767 |
| age_2010.tif | 1 | 126 | 0 |
| nep_2010.tif | -1610 | 333 | 32767 |
| biomass_NBCD.tif | 0 | 343 | 32767 |
| forest_productivity_NAFD.tif | 0 | 1 | -3.4E38 |
| forest_group_NAFD.tif | 100 | 990 | 32767 |
| type_cover_years_disturb_NAFD.tif | 1 | 40 | 0 |
| type_disturb_composite.tif | 1 | 3 | 0 |
| years_disturb_composite.tif | 16 | 40 | 0 |
| years_disturb_ADS.tif | 28 | 40 | 0 |
| years_disturb_MTBS.tif | 16 | 40 | 0 |
Categories for forest_group_NAFD.tif
100 - White/Red/Jack Pine
120 - Spruce/Fir
140 - Longleaf/Slash Pine
160 - Loblolly/Shortleaf Pine
180 - Pinyon/Juniper
400 - Oak/Pine
500 - Oak/Hickory
600 - Oak/Gum/Cypress
700 - Elm/Ash/Cottonwood
800 - Maple/Beech/Birch
980 - Tropical Hardwoods
990 - Exotic Hardwoods
Categories for type_cover_years_disturb_NAFD.tif
1 - Water
2 - Non-forest
3 - Forest
16 to 40 - (Disturbed Forest) Years since most recent disturbance
Categories for type_disturb_composite.tif
1 - Harvest
2 - Fire
3 - Bark beetles
Application and Derivation
Accurate assessment of carbon storage and uptake by forests is critical for evaluating their potential to serve as a nature-based solution for climate change mitigation. Forest carbon assessments must consider not only the contemporary rates of stock changes and fluxes but also historic disturbances.
Quality Assessment
The methods used to generate this dataset allowed the authors to define a within-method random error to assess uncertainty at the pixel scale but this does not translate to uncertainty at larger scales. It would be incorrect to assume that pixel-scale errors are fully additive because the spread in estimates is derived from region-wide samples whose largely-random errors cancel out when aggregating to the regional level. Incorrectly assuming additive errors would significantly over-estimate regional-scale uncertainty. For more information, see Gu et al. (2019).
Data Acquisition, Materials, and Methods
Overview
The methods for creating this dataset involve three major steps:
- Determination of attributes for all forested pixels across the southeastern United States
- forest type
- disturbance type
- year of the most recent forest disturbance (stand age)
- site productivity
- Definition of forest carbon stocks and fluxes for each unique combination of attributes based on a forest carbon cycle model
- aboveground biomass (AGB)
- net ecosystem productivity (NEP)
- Assignment of forest carbon stocks and fluxes for each pixel’s combination of site-level attributes
These methods yielded maps of forest carbon stocks and fluxes at a 30 m resolution for the year 2010 that was also iterated backward in time to provide continuous, annual reporting of forest carbon dynamics for each pixel and for the full region.
Forest Disturbance
For each pixel, the year of the most recent forest disturbance (from 1986 to 2010) and the type of disturbance were determined from each of three satellite-derived data products: the North American Forest Dynamics (NAFD), the Monitoring Trends in Burn Severity (MTBS), and the Aerial Detection Survey (ADS) (Fig. 2). For more information, see Gu et al. (2016). If a pixel was not disturbed between 1986 and 2010, the year of the most recent disturbance was inferred from satellite-derived biomass (compiled in 2000) available from the National Biomass and Carbon Dataset (NBCD), biomass accumulation curves derived from the Forest Inventory and Analysis (FIA) Program, and site productivity. Next, the number of years since the most recent disturbance was iterated back in time for each year of a 25-year time series, and the mean stand age for each pixel was inferred from the pre-disturbance biomass. Pre-disturbance biomass was estimated from the biomass of undisturbed pixels for a given forest type averaged over a local grid of 1 km, or a 10 km if the forest type was undefined at the 1 km scale. For more information, see Gu et al. (2019).
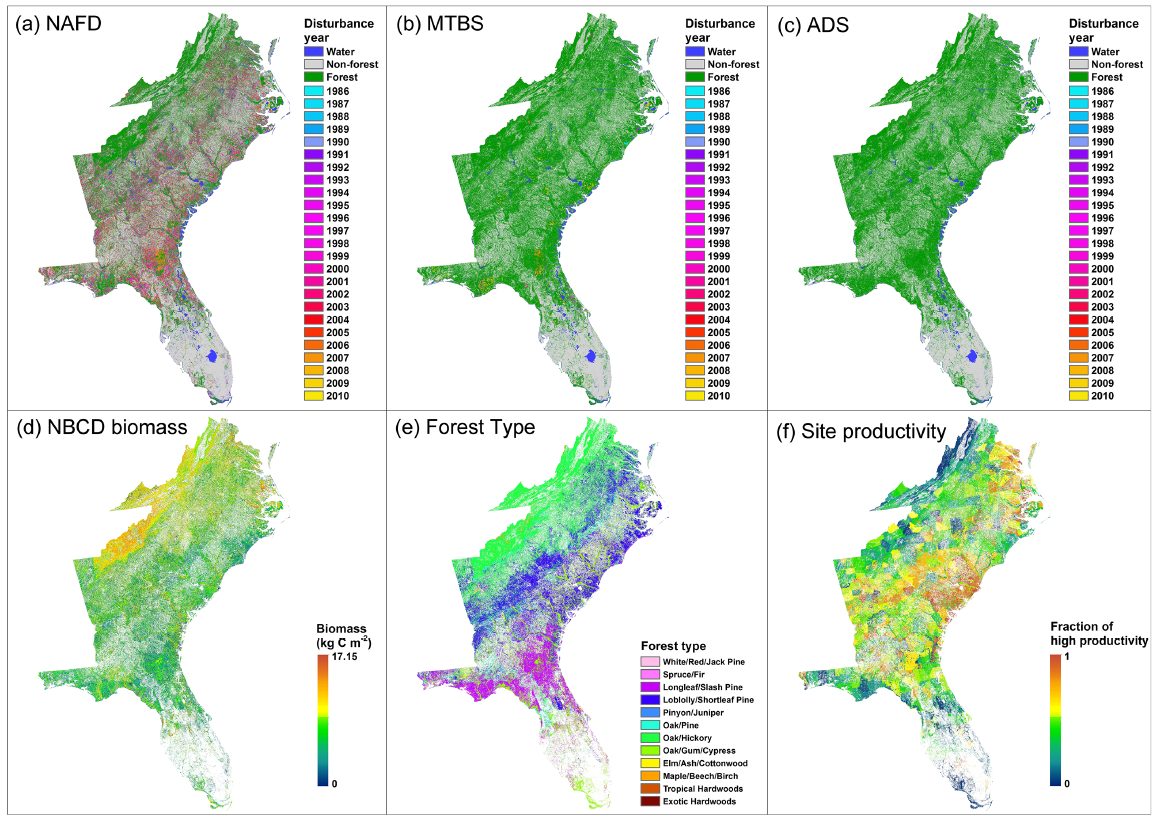
Figure 2. Maps of the year of the most recent disturbance from (a) NAFD, (b) MTBS, (c) ADS, and maps of (d) NBCD 2000, (e) forest type group, and (f) site productivity. From Gu et al. (2019).
Annual Carbon Stocks and Fluxes
Carbon flux and carbon stock trajectories were estimated from an inventory-constrained version of the Carnegie-Ames-Stanford Approach (CASA) carbon cycle process model that accounts for disturbance processes. The model applied a light-use efficiency approach to estimate net primary productivity (NPP), and model parameters were adjusted uniquely for each combination of forest type and site productivity. For each combination of forest-type group, site-productivity class, and pre-disturbance biomass, the model simulated NPP, net ecosystem productivity (NEP), and aboveground biomass (AGB) as a function of the number of years since the most disturbance. The distribution of NEP and AGB and the number of years since the most recent disturbance (i.e., stand age) was mapped for the years 1990, 2000, and 2010.
Data Access
These data are available through the Oak Ridge National Laboratory (ORNL) Distributed Active Archive Center (DAAC).
Forest Carbon Stocks and Fluxes After Disturbance, Southeastern USA, 1990-2010
Contact for Data Center Access Information:
- E-mail: uso@daac.ornl.gov
- Telephone: +1 (865) 241-3952
References
Gu H., C.A. Williams, N. Hasler and Y. Zhou. 2019. The Carbon Balance of the Southeastern Forest Sector as Driven by Recent Disturbance Trends. Journal of Geophysical Research – Biogeosciences:124. https://doi.org/10.1029/2018JG004841
Gu, H., C.A. Williams, B. Ghimire, F. Zhao, and C. Huang. 2016. High-resolution mapping of time since disturbance and forest carbon flux from remote sensing and inventory data to assess harvest, fire, and beetle disturbance legacies in the Pacific Northwest. Biogeosciences, 13:6321. https://doi.org/10.5194/bg-13-6321-2016
Dataset Revisions
Version 1.1 (released 2020-07-20) The data files were revised to use EPSG:42303 (NAD83 / Albers NorthAm) except for biomass_NBCD.tif which uses EPSG:5070 (NAD83 / Conus Albers).