Documentation Revision Date: 2024-04-24
Dataset Version: 1
Summary
There are 22 files in NetCDF version 4 format (.nc) in this dataset.
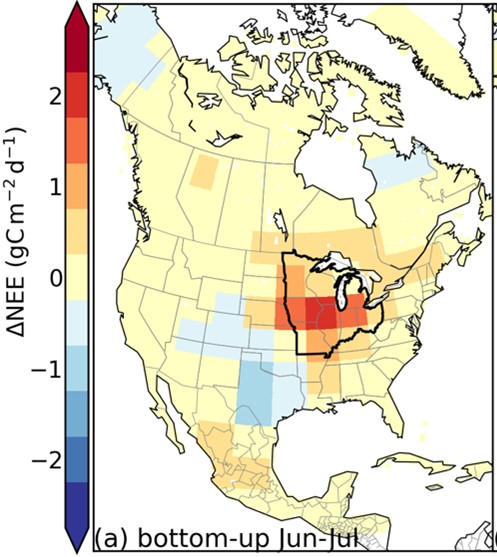
Figure 1. Bottom-up (LNLGOGIS) spatial patterns of June-July mean change in net ecosystem exchange (NEE_2019-NEE_2018) at 4 x 5-degrees spatial resolution.
Citation
Byrne, B.K., J. Liu, K.W. Bowman, Y. Yin, J. Yun, G. Ferreira, S.M. Ogle, L. Baskaran, L. He, X. Li, J. Xiao, and K.J. Davis. 2024. CMS-Flux-NA Fluxes and Aircraft CO2 Co-samples for 2018-2019. ORNL DAAC, Oak Ridge, Tennessee, USA. https://doi.org/10.3334/ORNLDAAC/2336
Table of Contents
- Dataset Overview
- Data Characteristics
- Application and Derivation
- Quality Assessment
- Data Acquisition, Materials, and Methods
- Data Access
- References
Dataset Overview
Project: Carbon Monitoring System
The NASA Carbon Monitoring System (CMS) program is designed to make significant contributions in characterizing, quantifying, understanding, and predicting the evolution of global carbon sources and sinks through improved monitoring of carbon stocks and fluxes. The System uses NASA satellite observations and modeling/analysis capabilities to establish the accuracy, quantitative uncertainties, and utility of products for supporting national and international policy, regulatory, and management activities. CMS data products are designed to inform near-term policy development and planning.
Related Publication
Byrne, B., J. Liu, K.W. Bowman, Y. Yin, J. Yun, G. Ferreira, S. Ogle, L. Baskaran, L. He, X. Li, J. Xiao, and K.J. Davis. 2024. Regional inversion shows promise in capturing extreme-event-driven CO2 flux anomalies but is limited by atmospheric CO2 observational coverage. Journal of Geophysical Research: Atmospheres, 129, e2023JD040006. https://doi.org/10.1029/2023JD040006
Related Dataset
Davis, K.J., M.D. Obland, B. Lin, T. Lauvaux, C. O'Dell, B. Meadows, E.V. Browell, J.P. DiGangi, C. Sweeney, M.J. McGill, J.D. Barrick, A.R. Nehrir, M.M. Yang, J.R. Bennett, B.C. Baier, A. Roiger, S. Pal, T. Gerken, A. Fried, S. Feng, R. Shrestha, M.A. Shook, G. Chen, L.J. Campbell, Z.R. Barkley, and R.M. Pauly. 2018. ACT-America: L3 Merged In Situ Atmospheric Trace Gases and Flask Data, Eastern USA. ORNL DAAC, Oak Ridge, Tennessee, USA. https://doi.org/10.3334/ORNLDAAC/1593
Acknowledgement
This study was supported with the following grants: NASA's Carbon Monitoring System (CMS, grants 80NSSC21K1060 and 80NM0018F0583); NASA's Orbiting Carbon Observatory (OCO) science team (grant 80NM0018F0583); and the National Science Foundation's Macrosystems Biology and NEON-Enabled Science (MSB-NES) program (grant DEB-2017870).
Data Characteristics
Spatial Coverage: North America
Spatial Resolution: 0.500 x 0.625 degrees
Temporal Coverage: 2018-01-01 to 2019-12-31 prior fluxes, 2018-04-08 to 2018-11-18, 2019-04-08 to 2019-11-18 for inversion analyses
Temporal Resolution: 3-hourly
Study Areas: Latitude and longitude are given in decimal degrees.
| Site | Westernmost Longitude | Easternmost Longitude | Northernmost Latitude | Southernmost Latitude |
|---|---|---|---|---|
| North America | -167.8125 | -39.6875 | 76.250 | 13.750 |
Data File Information
There are 22 data files in NetCDF (.nc) format with this dataset.
There are five types of files:
- NorthAmerica_<YYYY>_<experiment>.nc : modeled surface-atmosphere CO2 fluxes for the standard experiment for a given year. Each file contains CO2 fluxes (net ecosystem exchange, NEE) at 3-h intervals using the climatological prior NEE (SiB3, CASA and FLUXCOM) and posterior NEE (SiB3, CASA and FLUXCOM using priors). Files also include emissions from fossil fuels use, biofuels use, and biomass burning (Table 1). Eight files.
- NorthAmerica_Prior_Fluxes.nc : Prior fluxes and uncertainties for the standard experiment. Values are weekly averages over one year (n=52) (Table 2).
- NorthAmerica_<YYYY>_<experiment>_wPriorIAV.nc : modeled surface-atmosphere CO2 fluxes for the experiment using priors with interannual variability (IAV) for a given year (Table 2). Files have the same structure as the standard experiment (1). Eight files.
- <experiment>_aircraft_cosamples.nc : observed in-situ and simulated co-samples of aircraft CO2 measurements for the standard experiment (Table 3). Four files.
- Prior_aircraft_cosamples.nc : aircraft CO2 co-samples simulated using prior fluxes without performing optimization (Table 3).
For NorthAmerica_<YYYY>_<experiment>.nc, NorthAmerica_<YYYY>_<experiment>_wPriorIAV.nc, and <experiment>_aircraft_cosamples.nc,
- <YYYY> is the year (2018 or 2019)
- <experiment> is the type of inversion: ("IS", "LNLG", "LNLGIS", or "LNLGOGIS"). See Section 5 for explanation.
Table 1. Variables in NorthAmerica_<YYYY>_<experiment>.nc and NorthAmerica_<YYYY>_<experiment>_wPriorIAV.nc files.
| Variable | Units | Description |
|---|---|---|
| time | d | Fractional days since 2018-01-01 00:00:00; time step is 0.125 d (3 h) |
| lat | degrees east | Latitude for center of grid cell |
| lon | degrees north | Longitude for center of grid cell |
| area | m2 | Grid cell area |
| posterior_CASA_NEE | g m-2 day-1 | Posterior net ecosystem exchange (NEE) in grams carbon from inversion using the CASA prior |
| posterior_SiB3_NEE | g m-2 day-1 | Posterior NEE in grams carbon from inversion using the SiB3 prior |
| posterior_FLUXCOM_NEE | g m-2 day-1 | Posterior NEE in grams carbon from inversion using the FLUXCOM prior |
| prior_CASA_NEE* | g m-2 day-1 | Prior for CASA NEE in grams carbon |
| prior_SiB3_NEE* | g m-2 day-1 | Prior for SiB3 NEE in grams carbon |
| prior_FLUXCOM_NEE* | g m-2 day-1 | Prior for FLUXCOM NEE in grams carbon |
| Fossil_Fuels | g m-2 day-1 | Fossil fuel CO2 emissions in grams carbon |
| Biomass_Burning | g m-2 day-1 | Biomass burning CO2 emissions in grams carbon |
| Biofuels | g m-2 day-1 | Biofuel CO2 emissions in grams carbon |
*NEE priors were obtained from Byrne et al. (2020).
Table 2. Variables in NorthAmerica_Prior_Fluxes.nc.
| Variable | Units | Description |
|---|---|---|
| time | d | Mid-point of week over one year (n=52); time step is 1 week (7 days) and units are fractional days |
| lat | degrees east | Latitude for center of grid cell |
| lon | degrees north | Longitude for center of grid cell |
| area | m2 | Area of grid cell |
| mask | 1 | Region mask ID; values relate lat-lon grid to state vector |
| NPP | g m-2 day-1 | Prior for net primary production |
| HR_FLUXCOM | g m-2 day-1 | Prior for heterotrophic respiration (NEE_GIT_FLUXCOM - NPP) in grams carbon |
| HR_UNC_FLUXCOM | g m-2 day-1 | Uncertainty on HR_FLUXCOM |
| HR_CASA | g m-2 day-1 | Prior for heterotrophic respiration (NEE_GIT_CASA - NPP) in grams carbon |
| HR_UNC_CASA | g m-2 day-1 | Uncertainty on HR_CASA |
| HR_SiB3 | g m-2 day-1 | Prior for heterotrophic respiration (NEE_GIT_SiB3 - NPP) in grams carbon |
| HR_UNC_SiB3 | g m-2 day-1 | Uncertainty on HR_SiB3 |
| ocean_FLUXCOM* | g m-2 day-1 | Prior for ocean-atmosphere CO2 flux in grams carbon |
| ocean_UNC_FLUXCOM | g m-2 day-1 | Uncertainty on ocean_FLUXCOM |
| ocean_CASA* | g m-2 day-1 | Prior for ocean-atmosphere CO2 flux in grams carbon |
| ocean_UNC_CASA | g m-2 day-1 | Uncertainty on ocean_CASA |
| ocean_SiB3* | g m-2 day-1 | Prior for ocean-atmosphere CO2 flux in grams carbon |
| ocean_UNC_SiB3 | g m-2 day-1 | Uncertainty on ocean_SiB3 |
*Priors obtained from GOSAT+surface+TCCON (GIT) experiments in Byrne et al. (2020).
Table 3. Variables in <experiment>_aircraft_cosamples.nc files and Prior_aircraft_cosamples.nc.
| Variable | Units | Description |
|---|---|---|
| time | h | Time in fractional hours since 2018-01-01 00:00:00 |
| obspack_id | - | Unique identifier of measurement from Obspack dataset |
| year | y | Calendar year of in situ sample |
| month | month | Month of year (range: 1-12) of in situ sample |
| dat_of_month | d | Day of month (range: 1-31) of in situ sample |
| doy | d | Day of year (range: 1-365) in situ sample |
| hour | h | Fractional hour of day (0.00 - 23.99) of in situ sample |
| lat | degrees east | Latitude for center of grid cell |
| lon | degrees north | Longitude for center of grid cell |
| Y | ppm | Observed mole fraction of CO2 in dry air in ppm |
| HX_SiB3 | ppm | Posterior simulated mole fraction of CO2 (based on SiB3 prior) |
| HX_CASA | ppm | Posterior simulated mole fraction of CO2 (based on CASA prior) |
| HX_FLUXCOM | ppm | Posterior simulated mole fraction of CO2 (based on FLUXCOM prior) |
| height | m | Aircraft height (altitude) above the surface |
| site_num | - | Unique number for aircraft campaign |
Application and Derivation
These data provide posterior NEE estimates and posterior CO2 co-samples from the nested CMS-Flux-NA inversion system. The fluxes provided here can be used to study CO2 fluxes over North America (e.g., Figure 2). Atmospheric CO2 inversion analyses are most robust over larger spatial-temporal scales; therefore, limiting analysis to scales of monthly temporal duration and spatial scales of ≥1000 km is recommended.
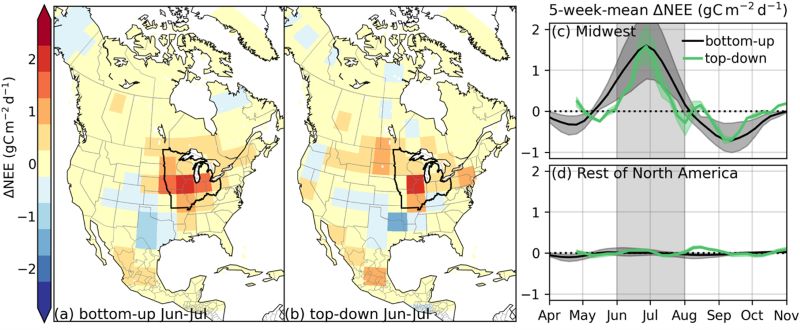
Figure 2. (a) Bottom-up and (b) top-down (LNLGOGIS) spatial patterns of June–July mean change in NEE (NEE2019 − NEE2018) at 4 × 5-degree spatial resolution. (c) US Midwest and (d) rest of North America 5-week-mean change in NEE. The US Midwest is defined as the area within Illinois, Indiana, Iowa, Michigan, Minnesota, Missouri, Ohio, and Wisconsin and is indicated by the black outline in panels (a) and (b). The shading shows the range around the mean estimate for the inversions using three different priors and for the five bottom-up GPP datasets. Source: Byrne et al. (2024).
Quality Assessment
Fluxes were evaluated through comparisons of posterior simulated CO2 concentrations with aircraft CO2 measurements that were not assimilated in the inversions. These co-sample data are also provided here for further analysis. A rough estimate of uncertainty can be obtained through examining the spread in flux estimates resulting from the three different prior NEE models (CASA, SiB3 and FLUXCOM). See Byrne et al. (2024) for a description of this comparison.
Data Acquisition, Materials, and Methods
Atmospheric CO2 inversions were performed with the CMS-Flux-NA model for North America for the months of April to November in 2018 and 2019. The set-up of this inversion system is described in detail in Byrne et al. (2024). In short, atmospheric CO2 data was assimilated using Bayesian inference to optimize weekly CO2 fluxes for land and ocean. Rather than directly optimizing land NEE, the inversion optimized heterotrophic respiration (HR) fluxes that were then combined with prescribed net primary production (NPP) to generate NEE. This approach improved inversion performance, and the component HR and NPP fluxes were not examined. Individual inversions were six weeks long with the first and last week discarded as spin-up/spin-down. A batch of eight six-week inversions, shifted by four weeks, were conducted to cover the entire April 8 to Nov 18 period.
Results for two ensembles of inversions are provided in this dataset. The “standard” experiment is for inversions with climatological prior NEE while the “IAV” experiment has interannual variations in prior NEE. A tree diagram illustrating the 12 individual inversions shown for the “standard” experiment are shown in Figure 3. The diagram shows that four sets of inversions are conducted that differ in assimilated data:
- The “IS” inversions assimilate in situ CO2 measurements from the global network of sites.
- The “LNLG” inversions assimilate OCO-2 land data, including nadir and glint retrievals.
- The “LNLGIS” inversions assimilate both in situ and OCO-2 land data.
- The “LNLGOGIS” inversions assimilate in situ, OCO-2 land data, and OCO-2 ocean glint retrievals.
For each assimilated dataset, three sets of inversions differing in prior fluxes are conducted. These prior NEE estimates were obtained from the GOSAT+surface+TCCON (GIT) experiment of Byrne et al. (2020). These NEE estimates are themselves posterior NEE estimates from inversions that assimilated GOSAT column-averaged dry-air mole fraction (XCO2) retrievals, surface in situ CO2, and TCCON XCO2 in a global inversion over 2010–2015. The three different NEE estimates differ based on prior fluxes used in the inversions, either CASA, SiB3 or FLUXCOM NEE.
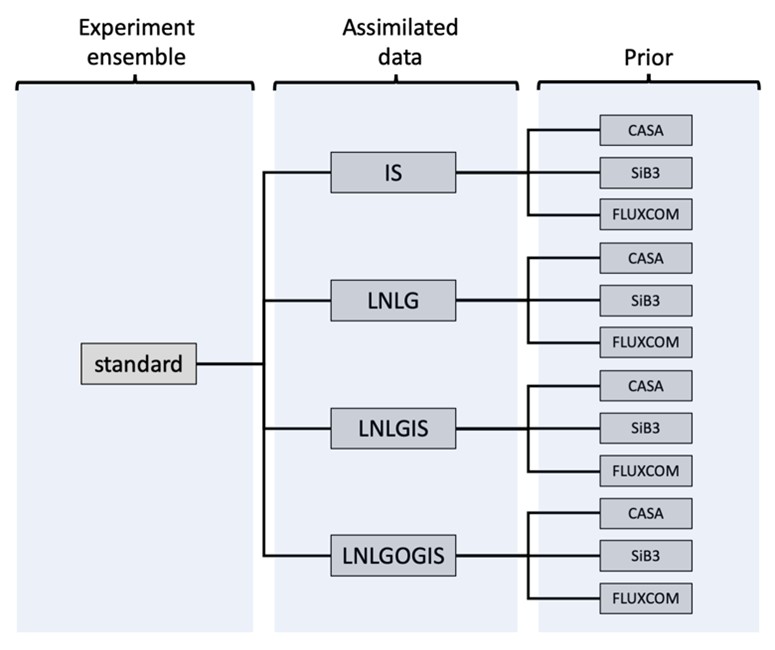
Figure 3. Tree diagram showing the 12 inversions conducted for the standard experiment ensemble. For a given experiment, sub-experiments that assimilate different observation using each prior NEE are performed.
Assimilated data
In situ CO2 measurements are obtained from version 8.0 of the NOAA GLOBALVIEW plus Obspack dataset (Schuldt et al., 2022). These data are provided on the X2019 CO2 scale but were back corrected to the X2007 CO2 scale following Hall et al. (2021). Several filters were applied to the in situ data before assimilation. Surface in situ CO2 measurements are assimilated at their respective height above the surface, with inclusion criteria that the model surface elevation should differ by less than 500 m from the 15 arc-second ETOPO1 global elevation dataset (NOAA, 2022) (to exclude observations whose elevation differs significantly from the model grid). Secondly, only assimilate data with the CT assim flag greater than or equal to one, which indicates data that is deemed assimilable for the NOAA CarbonTracker system. Finally, only measurements obtained between 11:00 and 17:00 local time are assimilated (when the atmospheric boundary layer is well mixed). The sites assimilated were: amt, bck, bmw, bra, brw, cba, cby, chl, cps, crv, egb, esp, est, etl, fsd, inu, inx, key, kum, lef, lew, llb, sct, sgp, uta, wbi, wgc, wkt, wsa. The sites with CT assim≥ 1 that are not assimilated were: mbo, mex, mlo, mwo, nwr, omp, uts, wsd. Some sites with CT assim= 0 may be assimilable, but more work is needed to characterize their suitability for assimilation.The CT MDM “model-data-mismatch” values were applied as uncertainties on assimilated measurements. All aircraft data, including the ACT-America campaign data (Davis et al., 2021, 2018; Wei et al., 2021), were withheld for validation purposes
XCO2 data were retrieved using version 10 of NASA’s Atmospheric CO2 Observations from Space (ACOS) full-physics retrieval algorithm (O’Dell et al., 2018). Subsequently, OCO-2 “buddy” super-observations were calculated by averaging individual soundings into super-observations at a spatial resolution of 0.5 × 0.5 degree within the same orbit, assigning equal weights, following the approach by Liu et al. (2017).
See Byrne et al. (2024) for additional details.
Data Access
These data are available through the Oak Ridge National Laboratory (ORNL) Distributed Active Archive Center (DAAC).
CMS-Flux-NA Fluxes and Aircraft CO2 Co-samples for 2018-2019
Contact for Data Center Access Information:
- E-mail: uso@daac.ornl.gov
- Telephone: +1 (865) 241-3952
References
Byrne, B., J. Liu, K.W. Bowman, Y. Yin, J. Yun, G. Ferreira, S. Ogle, L. Baskaran, L. He, X. Li, J. Xiao, and K.J. Davis. 2024. Regional inversion shows promise in capturing extreme-event-driven CO2 flux anomalies but is limited by atmospheric CO2 observational coverage. Journal of Geophysical Research: Atmospheres, 129, e2023JD040006. https://doi.org/10.1029/2023JD040006
Byrne, B., J. Liu, M. Lee, I. Baker, K.W. Bowman, N.M. Deutscher, D.G. Feist, D.W. T. Griffith, L.T. Iraci, M. Kiel, J.S. Kimball, C.E. Miller, I. Morino, N.C. Parazoo, C. Petri, C.M. Roehl, M.K. Sha, K. Strong, V.A. Velazco, P.O. Wennberg, and D. Wunch. 2020. Improved constraints on northern extratropical CO2 fluxes obtained by combining surface-based and space-based atmospheric CO2 measurements. Journal of Geophysical Research: Atmospheres 125:e2019JD032029. https://doi.org/10.1029/2019JD032029
Davis, K.J., E.V. Browell, S. Feng, T. Lauvaux, M.D. Obland, S. Pal, B.C. Baier, D.F. Baker, I.T. Baker, Z.R. Barkley, K.W. Bowman, Y.Y. Cui, A.S. Denning, J.P. DiGangi, J.T. Dobler, A. Fried, T. Gerken, K. Keller, B. Lin, A.R. Nehrir, C.P. Normile, C.W. O’Dell, L.E. Ott, A. Roiger, A.E. Schuh, C. Sweeney, Y. Wei, B. Weir, M. Xue, and C.A. Williams. 2021. The Atmospheric Carbon and Transport (ACT)-America Mission. Bulletin of the American Meteorological Society 102:E1714–E1734. https://doi.org/10.1175/BAMS-D-20-0300.1
Davis, K.J., M.D. Obland, B. Lin, T. Lauvaux, C. O'Dell, B. Meadows, E.V. Browell, J.P. DiGangi, C. Sweeney, M.J. McGill, J.D. Barrick, A.R. Nehrir, M.M. Yang, J.R. Bennett, B.C. Baier, A. Roiger, S. Pal, T. Gerken, A. Fried, S. Feng, R. Shrestha, M.A. Shook, G. Chen, L.J. Campbell, Z.R. Barkley, and R.M. Pauly. 2018, June 25. ACT-America: L3 Merged In Situ Atmospheric Trace Gases and Flask Data, Eastern USA. ORNL Distributed Active Archive Center. https://doi.org/10.3334/ORNLDAAC/1593
Hall, B.D., A.M. Crotwell, D.R. Kitzis, T. Mefford, B.R. Miller, M.F. Schibig, and P.P. Tans. 2021. Revision of the World Meteorological Organization Global Atmosphere Watch (WMO/GAW) CO2 calibration scale. Atmospheric Measurement Techniques 14:3015–3032. https://doi.org/10.5194/amt-14-3015-2021
Liu, J., K.W. Bowman, D.S. Schimel, N.C. Parazoo, Z. Jiang, M. Lee, A.A. Bloom, D. Wunch, C. Frankenberg, Y. Sun, C.W. O’Dell, K.R. Gurney, D. Menemenlis, M. Gierach, D. Crisp, and A. Eldering. 2017. Contrasting carbon cycle responses of the tropical continents to the 2015–2016 El Niño. Science 358. http://doi.org/10.1126/science.aam5690
NOAA National Centers for Environmental Information. 2022. ETOPO 2022 15 Arc-Second Global Relief Model. NOAA National Centers for Environmental Information. https://doi.org/10.25921/fd45-gt74
O’Dell, C.W., A. Eldering, P.O. Wennberg, D. Crisp, M.R. Gunson, B. Fisher, C. Frankenberg, M. Kiel, H. Lindqvist, L. Mandrake, A. Merrelli, V. Natraj, R.R. Nelson, G.B. Osterman, V.H. Payne, T.E. Taylor, D. Wunch, B.J. Drouin, F. Oyafuso, A. Chang, J. McDuffie, M. Smyth, D.F. Baker, S. Basu, F. Chevallier, S.M. R. Crowell, L. Feng, P.I. Palmer, M. Dubey, O.E. García, D.W. T. Griffith, F. Hase, L.T. Iraci, R. Kivi, I. Morino, J. Notholt, H. Ohyama, C. Petri, C.M. Roehl, M.K. Sha, K. Strong, R. Sussmann, Y. Te, O. Uchino, and V.A. Velazco. 2018. Improved retrievals of carbon dioxide from Orbiting Carbon Observatory-2 with the version 8 ACOS algorithm. Atmospheric Measurement Techniques 11:6539–6576. https://doi.org/10.5194/amt-11-6539-2018
Schuldt, K.N., J. Mund, I.T. Luijkx, T. Aalto, J.B. Abshire, K. Aikin, Arlyn Andrews, S. Aoki, F. Apadula, B. Baier, P. Bakwin, J. Bartyzel, G. Bentz, P. Bergamaschi, A. Beyersdorf, T. Biermann, S.C. Biraud, H. Boenisch, D. Bowling, G. Brailsford, W.A. Brand, P. Van Den Bulk, G. Chen, Huilin Chen, Lukasz Chmura, S. Clark, Sites Climadat, J.D. Coletta, A. Colomb, R. Commane, S. Conil, C. Couret, A. Cox, P. Cristofanelli, E. Cuevas, R. Curcoll, B. Daube, K. Davis, M. Delmotte, J.P. DiGangi, D. Van Dinther, E. Dlugokencky, J.W. Elkins, L. Emmenegger, Shuangxi Fang, M.L. Fischer, G. Forster, A. Frumau, M. Galkowski, L.V. Gatti, T. Gehrlein, C. Gerbig, Francois Gheusi, E. Gloor, V. Gomez-Trueba, D. Goto, T. Griffis, S. Hammer, C. Hanson, L. Haszpra, J. Hatakka, M. Heimann, M. Heimann, M. Heliasz, D. Heltai, A. Hensen, O. Hermanssen, E. Hintsa, A. Hoheisel, J. Holst, V. Ivakhov, D. Jaffe, A. Jordan, W. Joubert, A. Karion, S.R. Kawa, V. Kazan, R. Keeling, P. Keronen, Jooil Kim, T. Kneuer, P. Kolari, K. Kominkova, E. Kort, E. Kozlova, P. Krummel, D. Kubistin, C. Labuschagne, D.H. Y. Lam, X. Lan, R. Langenfelds, O. Laurent, T. Laurila, T. Lauvaux, J. Lavric, B. Law, J. Lee, O.S. M. Lee, I. Lehner, K. Lehtinen, R. Leppert, A. Leskinen, M. Leuenberger, I. Levin, J. Levula, J. Lin, M. Lindauer, Z. Loh, M. Lopez, C.R. Lunder, T. Machida, I. Mammarella, G. Manca, A. Manning, A. Manning, M.V. Marek, M.Y. Martin, Giordane A. Martins, H. Matsueda, M. De Mazière, K. McKain, H. Meijer, F. Meinhardt, L. Merchant, N. Mihalopoulos, N. Miles, C.E. Miller, J.B. Miller, L. Mitchell, M. Mölder, S. Montzka, F. Moore, H. Moossen, E. Morgan, Josep-Anton Morgui, S. Morimoto, J. Müller-Williams, B. Munger, D. Munro, C.L. Myhre, Jaroslaw Necki, S. Newman, S. Nichol, Y. Niwa, S. O'Doherty, F. Obersteiner, B. Paplawsky, J. Peischl, O. Peltola, S. Piacentino, J.M. Pichon, S. Piper, J. Pitt, C. Plass-Duelmer, C. Plass-Duelmer, S.M. Platt, S. Prinzivalli, M. Ramonet, R. Ramos, E. Reyes-Sanchez, S. Richardson, H. Riris, P.P. Rivas, M. Rothe, T. Ryerson, K. Saito, M. Sargent, A.G. Di Sarra, M. Sasakawa, B. Scheeren, M. Schmidt, T. Schuck, M. Schumacher, T. Seifert, M.K. Sha, P. Shepson, M. Shook, C.D. Sloop, P. Smith, L.L. Sørensen, R.A. F. De Souza, M. Steinbacher, B. Stephens, C. Sweeney, P. Tans, K. Thoning, H. Timas, M. Torn, K. Tørseth, P. Trisolino, J. Turnbull, A. Vermeulen, B. Viner, G. Vitkova, S. Walker, A. Watson, R. Weiss, S. De Wekker, S. Wofsy, J. Worsey, D. Worthy, Dickon Young, S. Zaehle, A. Zahn, and Miroslaw Zimnoch. 2022. Multi-laboratory compilation of atmospheric carbon dioxide data for the period 1957-2021; obspack_co2_1_GLOBALVIEWplus_v8.0_2022-08-27. NOAA Global Monitoring Laboratory. https://doi.org/10.25925/20220808
Wei, Y., R. Shrestha, S. Pal, T. Gerken, S. Feng, J. McNelis, D. Singh, M.M. Thornton, A.G. Boyer, M.A. Shook, G. Chen, B.C. Baier, Z.R. Barkley, J.D. Barrick, J.R. Bennett, E.V. Browell, J.F. Campbell, L.J. Campbell, Y. Choi, J. Collins, J. Dobler, M. Eckl, A. Fiehn, A. Fried, J.P. Digangi, R. Barton-Grimley, H. Halliday, T. Klausner, S. Kooi, J. Kostinek, T. Lauvaux, B. Lin, M.J. McGill, B. Meadows, N.L. Miles, A.R. Nehrir, J.B. Nowak, M. Obland, C. O’Dell, R.M. P. Fao, S.J. Richardson, D. Richter, A. Roiger, C. Sweeney, J. Walega, P. Weibring, C.A. Williams, M.M. Yang, Y. Zhou, and K.J. Davis. 2021. Atmospheric Carbon and Transport – America (ACT-America) Data Sets: Description, Management, and Delivery. Earth and Space Science 8. https://doi.org/10.1029/2020EA001634