Documentation Revision Date: 2018-01-25
Data Set Version: 1
Summary
This dataset contains 7400 files in GeoTIFF (.tif) format -- 7080 containing daily fire weather indices and 320 ancillary data files including landscape characteristics and burn information for areas within interior Alaska.

Figure 1. Fire Weather Index (FWI) for Interior Alaska on July 22, 2006. FWI is a numerical rating between 0 and 30 where higher values indicate a higher risk of wildfire.
Citation
Loboda, T.V., and E.E. Hoy. 2018. CMS: Fire Weather Indices for Interior Alaska, 2001-2010. ORNL DAAC, Oak Ridge, Tennessee, USA. https://doi.org/10.3334/ORNLDAAC/1509
Table of Contents
- Data Set Overview
- Data Characteristics
- Application and Derivation
- Quality Assessment
- Data Acquisition, Materials, and Methods
- Data Access
- References
Data Set Overview
This dataset provides daily fire weather indices for interior Alaska during the active fire seasons from 2001 to 2010. Data are gridded at 60-m resolution. The active fire season is defined as May 24-September 18 (days of the year 144-261) in this dataset. Fire weather is the use of meteorological parameters such as relative humidity, wind speed and direction, cloud cover, mixing heights, and soil moisture to determine whether conditions are favorable for fire growth and smoke dispersion. The six indices provided in this dataset are defined and produced following the methodology of the Canadian Forest Fire Weather Index System: Fine Fuel Moisture Code, Duff Moisture Code, Drought Code, Initial Spread Index, Buildup Index, Fire Weather Index. The dataset was developed following point source data interpolation from weather station observations.
Project: Carbon Monitoring System
The NASA Carbon Monitoring System (CMS) is designed to make significant contributions in characterizing, quantifying, understanding, and predicting the evolution of global carbon sources and sinks through improved monitoring of carbon stocks and fluxes. The System will use the full range of NASA satellite observations and modeling/analysis capabilities to establish the accuracy, quantitative uncertainties, and utility of products for supporting national and international policy, regulatory, and management activities. CMS will maintain a global emphasis while providing finer scale regional information, utilizing space-based and surface-based data and will rapidly initiate generation and distribution of products both for user evaluation and to inform near-term policy development and planning.
Related Project: Arctic-Boreal Vulnerability Experiment (ABoVE)
Data Characteristics
Spatial Coverage: Interior Alaska
ABoVE grid cells: Ah0v0, Ah1v0, Ah0v1, Ah1v1
Spatial Resolution: 60-m
Temporal Coverage: 20010101-20100918
Temporal Resolution: Daily
Study Area (These coordinates are the approximate locations of the study sites and may not match the extents of the data files. All latitude and longitude given in decimal degrees.)
| Site | Westernmost Longitude | Easternmost Longitude | Northernmost Latitude | Southernmost Latitude |
|---|---|---|---|---|
| Interior Alaska | -171.593 | -131.813 | 73.661 | 56.627 |
Data File Information
There are 7400 files in GeoTIFF (.tif) format included in this dataset: 7080 containing daily fire weather indices and 320 ancillary data files.
Daily Fire Weather Indices
Six fire weather indices (Table 1) from the Canadian Forest Fire Weather Index System are provided for each day during the active fire seasons from 2001 to 2010. All data are gridded to the common ABoVE grid (3000x3000 pixels; Loboda et al. 2017).
FWI is a numerical rating between 0 and 30 indicating the risk of wildfire. Values rise as fire danger increases. FWI is built upon the three fuel moisture codes (FFMC, DMC, DC) and the two fire behavior indices (ISI, BUI; see Figure 2). See Section 5 for a more detailed explanation of the six indices.
Files follow the naming convention below:
ABoVE.dataset.YYYYDDD.tif
Where:
- ABoVE – campaign name; e.g. "ABoVE"
- dataset – dataset abbreviation; e.g. "fwi"
- YYYYDDD – date (note that for annual datasets the 3-digit day of year is set to 001); e.g. "2001001"
A scale factor (0.1) must be applied to all data files. All data files have a fill value of -9999.
Table 1. Names, abbreviations and descriptions for the six fire weather indices
| Index | Abbreviation | Description |
|---|---|---|
| Fine Fuel Moisture Code | FFMC | The Fine Fuel Moisture Code is a numeric rating of the moisture content of litter and other cured fine fuels. This code is an indicator of the relative ease of ignition and the flammability of fine fuel. |
| Duff Moisture Code | DMC | The Duff Moisture Code is a numeric rating of the average moisture content of loosely compacted organic layers of moderate depth. This code gives an indication of fuel consumption in moderate duff layers and medium-size woody material. |
| Drought Code | DC | The Drought Code is a numeric rating of the average moisture content of deep, compact organic layers. This code is a useful indicator of seasonal drought effects on forest fuels and the amount of smoldering in deep duff layers and large logs. |
| Initial Spread Index | ISI | The Initial Spread Index is a numeric rating of the expected rate of fire spread. It combines the effects of wind and the FFMC on rate of spread without the influence of variable quantities of fuel. |
| Buildup Index | BUI | The Buildup Index is a numeric rating of the total amount of fuel available for combustion. It combines the DMC and the DC. |
| Fire Weather Index | FWI | The Fire Weather Index is a numeric rating of fire danger. It combines the Initial Spread Index and the Buildup Index. It is suitable as a general index of fire danger throughout the forested areas of Canada. |
Ancillary File Information
There are 320 ancillary data files included with the dataset. The data include landscape characteristics and burn information for smaller areas within interior Alaska that are useful for estimating carbon consumption during wildland fires (Kasischke and Hoy 2012). Ancillary data names and descriptions are given in Table 2.
All ancillary data are gridded to the common ABoVE grid (3000x3000 pixels) and follow the name convention below:
ABoVE.dataset.YYYYDDD.AhIvJ.BhKvL.RR.VVV.YYYYDDDHHMMSS.tif
Where:
- ABoVE – campaign name; e.g. "ABoVE"
- dataset – name of the dataset; e.g. "drain" (see Table 2)
- YYYYDDD – date (note that for annual datasets the 3-digit day of year is set to 001); e.g. "2001001"
- AhIvJ – I is a single-digit number of horizontal tile in grid A, J is a single-digit number of the vertical tile in grid A; e.g."Ah0v0"
- BhKvL – K is a single-digit number of horizontal tile in grid B, L is a single-digit number of the vertical tile in grid B; e.g. "Bh5v1"
- RR – two-digit pixel resolution in meters; e.g. "60"
- VVV – three-digit product version number; e.g. "001"
- YYYYDDDHHMMSS – production date with a four-digit year, three digit day of the year, and two-digit hour (24-hour clock), minutes, and seconds; e.g. "2014075120101"
Table 2. Ancillary data names and descriptions
| Name | Description |
|---|---|
| drain | Drainage classes derived from slope, elevation, and flow accumulation. |
| prevDist | Year of previous disturbance (pre-2000) from the Alaskan large fire database. |
| bu | Burned/unburned separation using standard MTBS dNBR-based classes (2001-2010) * |
| dob | Date of burning modeled from active fire detections within fire perimeters (2001-2010) |
| fuels | Fuel categories relevant to the boreal forests of Interior Alaska. |
* Monitoring Trends in Burn Severity (MTBS); differenced Normalized Burn Ratio (dNBR)
Drainage classes (ABoVE.drain.YYYYJJJ.AhIvJ.BhKvL.RR.VVV.YYYYDDDHHMMSS.tif)
| Code | Description | |
|---|---|---|
| 1 | flat poorly drained | slope < 2° and flow > 0 |
| 2 | flat drained | slope < 2° and flow = 0 |
| 3 | moderately drained | slope >= 2 ° and flow > 0 |
| 4 | well-drained | slope >= 2° and flow = 0 |
Year of previous disturbance (ABoVE.prevDist.YYYYJJJ.AhIvJ.BhKvL.RR.VVV.YYYYDDDHHMMSS.tif)
A single-year dataset based on AK large fire database. Year of previous disturbance (pre-2000) from the Alaskan large fire data base. Value 0 indicates a pixel area that is undisturbed since 1950. Values ranging 1950-2000 indicate the year since 1950 in which a pixel area burned.
Burned-unburned classification (ABoVE.bu.YYYYJJJ.AhIvJ.BhKvL.RR.VVV.YYYYDDDHHMMSS.tif)
Burned-unburned separation using standard MTBS dNBR-based classes:
| Code | Description |
|---|---|
| 0 | unclassified |
| 1 | unburned (MTBS classes: 1 -- "unburned to low severity" and 5 -- "increased greenness") |
| 2 | burned (MTBS classes: 2, 3, 4 -- "low-", "moderate-", and "high-severity", respectively) |
| 3 | missing data (MTBS class: 6 -- "nodata") |
Date of burning modeled from active fire detection within fire perimeters (ABoVE.dob.YYYYJJJ.AhIvJ.BhKvL.RR.VVV.YYYYDDDHHMMSS.tif)
A multi-year dataset (2001-2010) indicating the burn date modeled from active fire detections within fire perimeters. Values range 1-366. Fill value is 0.
Fuel categories relevant to the boreal forests of Interior Alaska (ABoVE.fuels.YYYYJJJ.AhIvJ.BhKvL.RR.VVV.YYYYDDDHHMMSS.tif)
NLCD classes (in parenthesis) were converted into the fuel categories following Kasischke and Hoy 2012:
| Code | Description |
|---|---|
| 0 | water |
| 1 | black spruce (evergreen forest > 200-m from hydro features or above 400-m in elevation) |
| 2 | white spruce (evergreen forest < 200-m from hydro features or below 400-m in elevation) |
| 3 | deciduous (deciduous forest) |
| 4 | mixed (mixed forest) |
| 5 | high shrub (shrub/scrub and woody wetlands) |
| 6 | low shrub (dwarf scrub) |
| 7 | non-woody (all other classes encountered) |
| 129 | fill value |
Application and Derivation
Fire weather products are generally intended for land management agencies for examining wildfire potential and planning of controlled burns. This dataset is part of a NASA-funded effort to establish a Forest Disturbance Carbon Tracking System as a basis for assessing the impacts of disturbance on forest carbon stocks for specific regions of the United States.
Quality Assessment
The authors did not assess the uncertainty of their data products.
Data Acquisition, Materials, and Methods
FWI System
The Canadian Forest Fire Weather Index (FWI) System consists of six components that account for the effects of fuel moisture and wind on fire behavior. The first three components, the fuel moisture codes (FFMC, DMC, DC), are numeric ratings of the moisture content of litter and other fine fuels, the average moisture content of loosely compacted organic layers of moderate depth, and the average moisture content of deep, compact organic layers. The remaining three are fire behavior indices, which represent the rate of fire spread, the fuel available for combustion, and the frontal fire intensity; their values rise as the fire danger increases.
Methods
The diagram in Figure 2 illustrates the components of the FWI system. Calculation of the components is based on consecutive daily observations of temperature, relative humidity, wind speed, and 24-hour rainfall from Remote Automated Weather Stations (RAWS; Zachariassen et al. 2003). The six standard components provide numeric ratings of relative potential for wildland fire. The FWI system components are calculated on a cell-by-cell basis according to equations in Van Wagner and Pickett (1985) to produce the FWI maps.
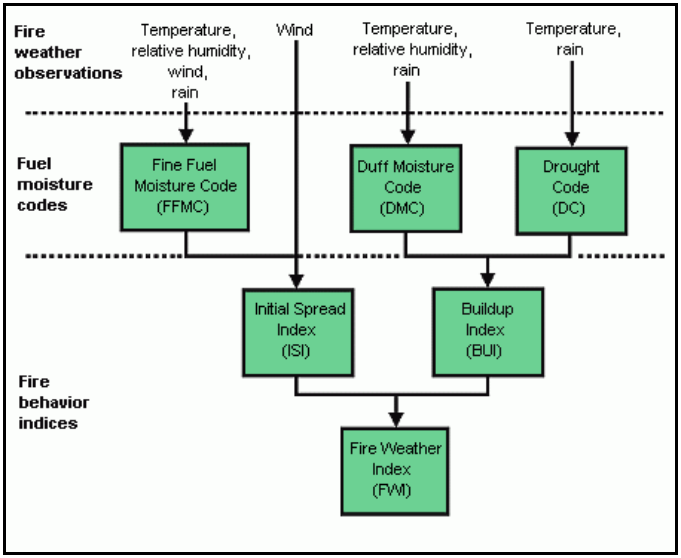
Figure 2. Components of the FWI system.
Inputs to the FWI system include elevation and current daily weather data. The elevation grid is derived from USGS 1-km2 DEM for North America (http://edcdaac.usgs.gov/gtopo30/hydro). Weather data are from stations operated by the National Weather Service. Weather forecast data are provided by the Canadian Meteorological Centre. The procedures described in Turner and Lawson (1978) are used to determine spring start-up dates and starting fuel moisture code values. Daily weather observations (temperature, relative humidity, wind speed, 24-hour precipitation) from surface meteorological stations are gridded using inverse distance weighted interpolation.
Temperature and relative humidity grid values are adjusted for elevation using the elevation grid. For temperature, the adjustment is based on the United States Standard Lapse Rate of -6.5°C/km; that is, for every kilometer gain in elevation, the temperature is assumed to drop by 6.5°C. For relative humidity, the mixing ratio (ratio of water vapor to dry air by weight) is assumed to be constant with elevation. The mixing ratio is calculated for each station and interpolated to each grid cell location. The relative humidity is then calculated on a cell-by-cell basis using the elevation-adjusted temperature grid.
The grids for the fuel moisture codes (FFMC, DMC, and DC) are built using both interpolation and calculation. Because the fuel moisture code calculations require the previous day's values as inputs, values for areas where new stations are starting up are interpolated rather than calculated. In areas where the previous day's values are available, the fuel moisture codes are calculated on a cell-by-cell basis using the previous day's grids, together with the current day's weather grids, as inputs. In the output maps, the non-calculating areas are assigned a null value, as are areas above the Arctic treeline.
The FWI system fire behavior indices are calculated from the fuel moisture codes. These calculations are done on a cell-by-cell basis to produce the ISI, BUI, and FWI grids. FWI is a combination of ISI and BUI.
Additional FWI System Information
The Fine Fuel Moisture Code (FFMC) is a numerical rating of the moisture content of litter and other cured fine fuels (needles, mosses, twigs, less than 1 cm in diameter). The FFMC is representative of the top litter layer less than 1-2 cm deep, and has a typical fuel loading of about 2.2 tons per acre (5 tonnes per hectare). FFMC fuels are affected by temperature, wind speed, relative humidity, and rain. Because fires usually start and spread in fine fuels, the FFHC is used to indicate the ease of ignition. The FFMC scale ranges from 0-99 and is the only component of the FWI system which does not have an open-ended scale. Generally, fires begin to ignite at FFMC values near 70, and the maximum probable value that will ever be achieved is 96.
The Duff Moisture Code (DMC) indicates the moisture content of loosely-compacted organic layers of moderate depth. It is representative of the duff layer that is 5-10 cm deep, and has a fuel loading of about 22 tons per acre (50 t/ha). DMC fuels are affected by rain, temperature, and relative humidity. Because these fuels are below the forest floor surface, wind speed does not affect the fuel moisture content. Although the DMC has an open-ended scale, the highest probable value is in the range of 150.
The Drought Code (DC) is an indicator of moisture content in deep, compact organic layers. This code represents the fuel layer approximately 10-20 cm deep, having a fuel loading of about 200 tons/acre (440 t/ha). Temperature and rain affect the DC, although wind speed and relative humidity do not because of the depth of this fuel layer. The DC is indicative of long-term moisture conditions. The DC scale is open-ended, although the maximum probable value is about 800.
Each fuel moisture code conveys direct information about various aspects of wildland fire potential. For example, fires are not likely to spread in surface litter with an FFMC less than about 74, the duff layer does not contribute to frontal fire intensity until the DMC reaches 20, and ground or subsurface fire activity tends to persist at DC values greater than 400 (Stocks et al. 1989).
The Initial Spread Index (ISI) combines the FFMC and wind speed to indicate the expected rate of fire spread. Generally, a 13 km/h increase in wind speed will double the ISI value. The ISI is accepted as a good indicator of fire spread in open light fuel stands with wind speeds up to 40 km/h.
The Buildup Index (BUI) is a weighted combination of the DMC and DC to indicate the total amount of fuel available for combustion by a moving flame front. The DMC has the most influence on the BUI value. For example, a DMC value of zero always results in a BUI value of zero regardless of what the DC value is. The DC has strongest influence on the BUI at higher DMC values, and the greatest effect that the DC can have is to make the BUI value equal to twice the DMC value. This weighting procedure makes the BUI and upper organic layer moisture monitor with a deep duff indicator built in. The BUI is often used for pre-suppression planning purposes.
The Fire Weather Index (FWI) is a combination of ISI and BUI, and is a numerical rating of the potential frontal fire intensity. It indicates fire intensity by combining the rate of fire spread with the amount of fuel being consumed. Frontal fire intensity is useful for determining fire suppression requirements. The FWI is also used for general public information about fire danger conditions. Values range from 0 to 30, rising as fire danger increases.
Data Access
These data are available through the Oak Ridge National Laboratory (ORNL) Distributed Active Archive Center (DAAC).
CMS: Fire Weather Indices for Interior Alaska, 2001-2010
Contact for Data Center Access Information:
- E-mail: uso@daac.ornl.gov
- Telephone: +1 (865) 241-3952
References
Kasischke, E.S. and E.E. Hoy. 2012. Controls on carbon consumption during Alaskan wildland fires. Global Change Biology 18(2):685-699. https://dx.doi.org/10.1111/j.1365-2486.2011.02573.x
Loboda, T.V., E.E. Hoy, and M.L. Carroll. 2017. ABoVE: Study Domain and Standard Reference Grids, Version 2. ORNL DAAC, Oak Ridge, Tennessee, USA. https://doi.org/10.3334/ORNLDAAC/1527
Stocks, B.J. and J.D. Walker. 1972. Fire behavior and fuel consumption in jack pine slash in Ontario. Environment Canada, Canadian Forestry Service, Great Lakes Forest Research Centre, Sault Ste. Marie, Ontario, Information Report 0-X-169. 19 p.
Stocks, B.J.; Lawson, B.D.; Alexander, M.E.; Van Wagner, C.E.; McAlpine, R.S.; Lynham, T.J.; Dube, D.E. 1989. The Canadian Forest Fire Danger Rating System: an overview. For. Chron. 65:450–457.
Turner, J.A. and B.D. Lawson. 1978. Weather in the Canadian Forest Fire Danger Rating System. A user guide to national standards and practices. Environment Canada, Pacific Forest Research Centre, Victoria, BC. BC-X-177.
Van Wagner, C.E. and T.L. Pickett. 1985. Equations and FORTRAN program for the Canadian Forest Fire Weather Index System. Canadian Forest Service, Ottawa, ON. Forestry Technical Report 33.
Zachariassen, J., K.F. Zeller, N. Nikolov, and T. McClelland. 2003. A review of the Forest Service Remote Automated Weather Station (RAWS) network. Gen. Tech. Rep. RMRS-GTR-119. Fort Collins, CO: U.S. Department of Agriculture, Forest Service, Rocky Mountain Research Station. 153 p + CD.