Documentation Revision Date: 2019-01-16
Data Set Version: 1
Summary
Also included in this dataset are estimates of the spatial relationship between environmental monitoring sites and EFT measures. Spatial functional heterogeneity (i.e., spatial representativeness) of environmental monitoring sites was calculated using the maximum entropy approach (Maxent) to estimate the suitability of the AmeriFLUX and NEON network’s eddy covariance sites to monitor the diversity and interannual variability of ETFs across CONUS.
There are five total data files in GeoTIFF (.tif) format: (1) a file with the EFT for each pixel from 2001 to 2014 across CONUS, (2) a file of EFT interannual variability, which corresponds to the number of different ETFs for each pixel from 2001 to 2014 across CONUS, and three files with assessments of AmeriFlux, NEON, and combined-core network site spatial representativeness for monitoring EFTs across CONUS.
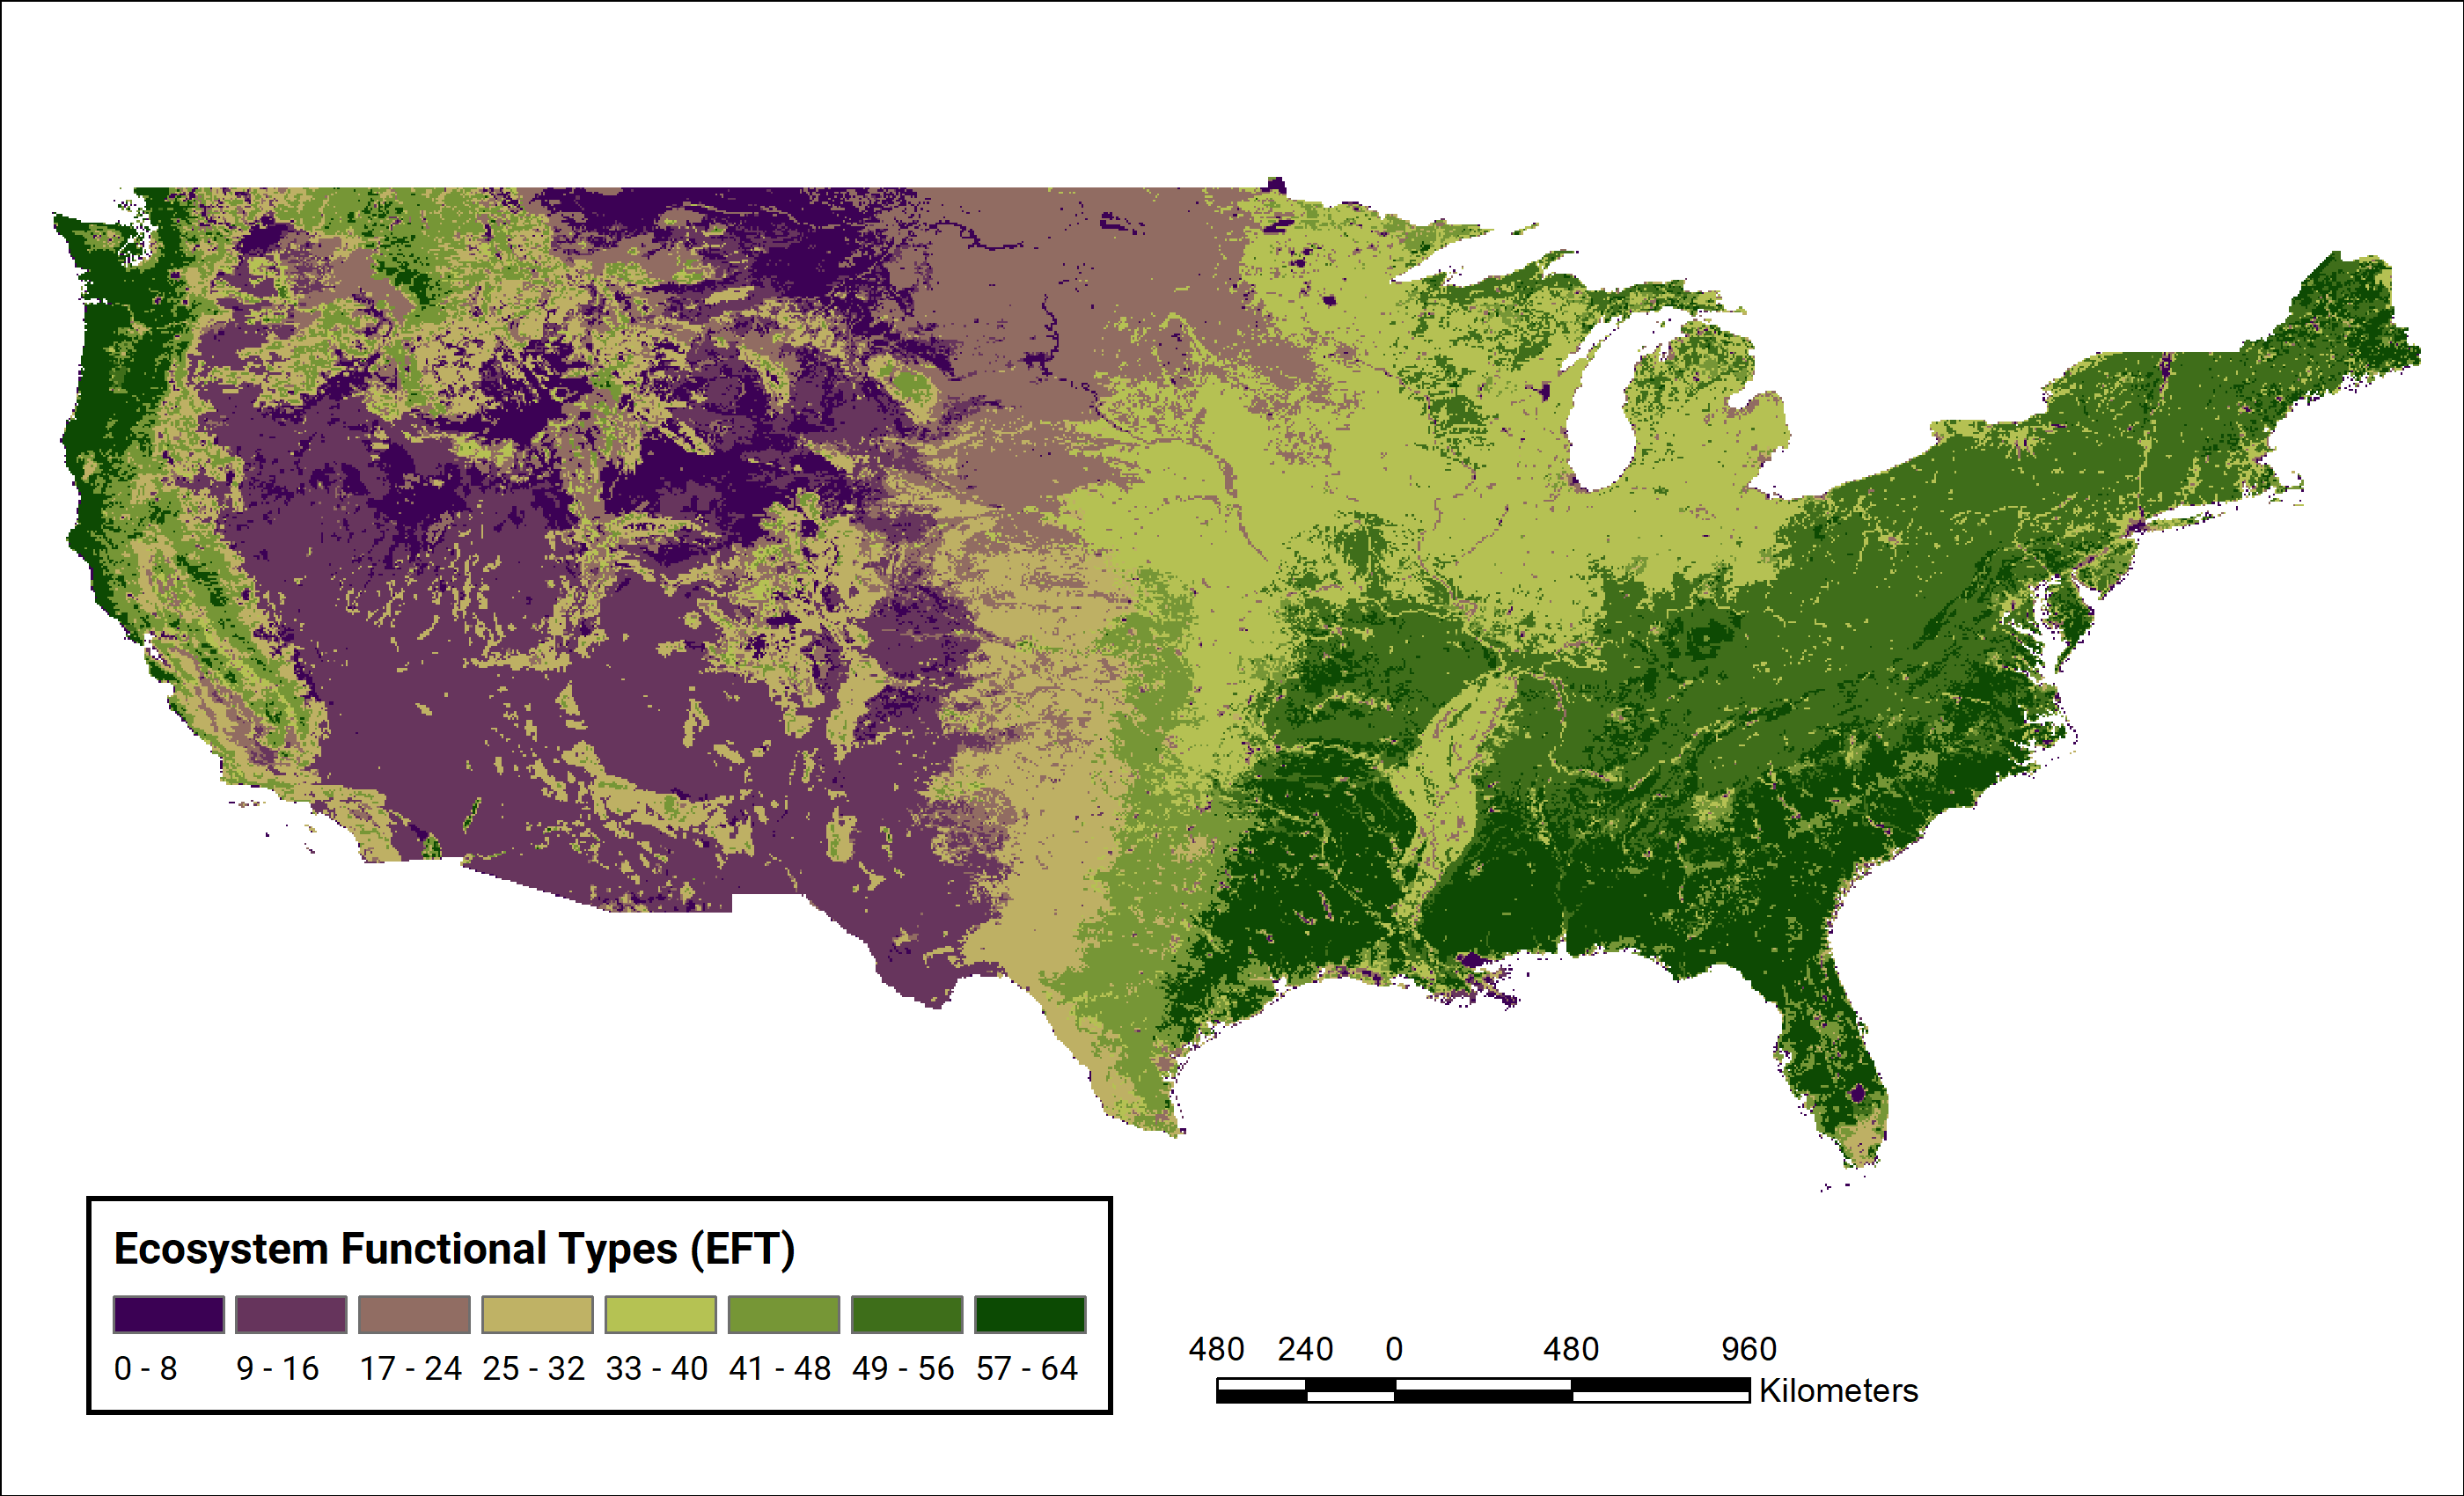
Figure 1. Spatial distribution of 64 ecosystem functional type (EFT) categories across the conterminous United States (CONUS). For each pixel, the dominant EFT is reported. (Source file: ecosystem_functional_types_diversity.tif)
Citation
Villarreal, S., R. Vargas, and D. Alcaraz-segura. 2019. Ecosystem Functional Type Distribution Map for the Conterminous USA, 2001-2014. ORNL DAAC, Oak Ridge, Tennessee, USA. https://doi.org/10.3334/ORNLDAAC/1659
Table of Contents
- Data Set Overview
- Data Characteristics
- Application and Derivation
- Quality Assessment
- Data Acquisition, Materials, and Methods
- Data Access
- References
Data Set Overview
This dataset provides 0.05 degree resolution estimates of ecosystem functional type (EFT) diversity and interannual variability, and spatial representativeness of AmeriFlux and NEON networks in monitoring EFT metrics. Data are distributed across the conterminous United States (CONUS) and span from 2001 to 2014. EFTs are groupings of ecosystems based on their similar ecosystem functioning that are used to represent the spatial patterns and temporal variability of key ecosystem functional traits without prior knowledge of vegetation type or canopy architecture. Sixty-four EFTs were derived from the metrics of a 2001-2014 time-series of satellite images of the Enhanced Vegetation Index (EVI, a surrogate of carbon gain dynamics) from the Moderate Resolution Imaging Spectroradiometer (MODIS) product MOD13C2. EFT diversity was calculated as the modal (most repeated) EFT (Fig. 1) and interannual variability was calculated as the number of unique EFTs for each pixel.
Also included in this dataset are estimates of the spatial relationship between environmental monitoring sites and EFT measures. Spatial functional heterogeneity (i.e., spatial representativeness) of environmental monitoring sites was calculated using the maximum entropy approach (Maxent) to estimate the suitability of the AmeriFLUX and NEON network’s eddy covariance sites to monitor the diversity and interannual variability of ETFs across CONUS.
Project: Carbon Monitoring System
The NASA Carbon Monitoring System (CMS) is designed to make significant contributions in characterizing, quantifying, understanding, and predicting the evolution of global carbon sources and sinks through improved monitoring of carbon stocks and fluxes. The System will use the full range of NASA satellite observations and modeling/analysis capabilities to establish the accuracy, quantitative uncertainties, and utility of products for supporting national and international policy, regulatory, and management activities. CMS will maintain a global emphasis while providing finer scale regional information, utilizing space-based and surface-based data and will rapidly initiate generation and distribution of products both for user evaluation and to inform near-term policy development and planning.
Related Publication:
Villarreal, S., Guevara M., Alcaraz-Segura, D., Vargas, R., (2018). Ecosystem functional diversity and the representativeness of environmental networks across the conterminous United States. Agric For Meteorol, 262:423-33. https://doi.org/10.1016/j.agrformet.2018.07.016
Acknowledgments:
This work was funded by NASA CMS grant 80NSSC18K0173, NASA GEOBON grant 80NSSC18K0446, and ECOPOTENTIAL H2020 grant 641762.
Data Characteristics
Spatial Coverage: Conterminous USA
Spatial Resolution: 0.05 degrees
Temporal Coverage: 2001 - 2014
Temporal Resolution: annual
Study Area: (all latitudes and longitudes given in decimal degrees)
| Site | Westernmost Longitude | Easternmost Longitude | Northernmost Latitude | Southernmost Latitude |
|---|---|---|---|---|
|
Conterminous USA |
-124.763 |
-67.1017 |
49.25417 |
24.55916667 |
Data File Information
There are 5 total data files in GeoTIFF (.tif) format: 2 files for ecosystem_functional_types_measure.tif and 3 files for representativeness_site.tif.
| File Name | Description |
|---|---|
| ecosystem_functional_types_diversity.tif | ecosystem functional type diversity (EFTmode), which corresponds to the mode of EFT categories for each pixel from 2001 to 2014 across CONUS |
| ecosystem_functional_types_interannual_variability.tif | ecosystem functional type interannual variability (EFTint), which corresponds to the number of different categories for each pixel from 2001 to 2014 across CONUS |
| representativeness_ameriflux.tif | spatial representativeness of AmeriFlux network eddy covariance sites to monitor ecosystem functional heterogeneity (EFTmode and EFTvar) across CONUS |
| representativeness_neon.tif | spatial representativeness of NEON network eddy covariance sites to monitor ecosystem functional heterogeneity (EFTmode and EFTvar) across CONUS |
| representativeness_coresites.tif | spatial representativeness of AmeriFlux and NEON network core sites to monitor ecosystem functional heterogeneity (EFTmode and EFTvar) across CONUS |
Data File Details
| File Name | Value Range | Units | Details |
|---|---|---|---|
| ecosystem_functional_types_diversity.tif | 0-64 | category | category of EFT at a pixel (see below) |
| ecosystem_functional_types_interannual_variability.tif | 1-14 | integer | total number of EFT categories at a pixel |
| representativeness_ameriflux.tif | 0-1 | category | if ecosystem functional heterogeneity is likely represented by the Ameriflux network, the pixel value will be 1 |
| representativeness_neon.tif | 0-1 | category | if ecosystem functional heterogeneity is likely represented by the NEON network, the pixel value will be 1 |
| representativeness_coresites.tif | 0-1 | category | if ecosystem functional heterogeneity is likely represented by the AmeriFlux and NEON network core sites, the pixel value will be 1 |
The file ecosystem_functional_types_diversity.tif has 64 categories of EFTs. The EFTs are described as follows:
A-D: primary productivity (ascending order)
a-d: seasonality (descending order)
1-4: phenology (spring, summer, autumn, winter)
Capital letters correspond to the Enhanced Vegetation Index (EVI) annual mean level, ranging from A to D for low to high productivity. Lowercase letters show the seasonal coefficient of variation, ranging from a to d for high to low seasonality for carbon uptake. Numbers indicate the season of maximum EVI: (1) spring, (2) summer, (3) autumn, (4) winter. See the related publication (Villarreal et al. 2018) for more information.
| EFT category | EFT description |
|---|---|
| 1 | Aa1 |
| 2 | Aa2 |
| 3 | Aa3 |
| 4 | Aa4 |
| 5 | Ab1 |
| 6 | Ab2 |
| 7 | Ab3 |
| 8 | Ab4 |
| 9 | Ac1 |
| 10 | Ac2 |
| 11 | Ac3 |
| 12 | Ac4 |
| 13 | Ad1 |
| 14 | Ad2 |
| 15 | Ad3 |
| 16 | Ad4 |
| 17 | Ba1 |
| 18 | Ba2 |
| 19 | Ba3 |
| 20 | Ba4 |
| 21 | Bb1 |
| 22 | Bb2 |
| 23 | Bb3 |
| 24 | Bb4 |
| 25 | Bc1 |
| 26 | Bc2 |
| 27 | Bc3 |
| 28 | Bc4 |
| 29 | Bd1 |
| 30 | Bd2 |
| 31 | Bd3 |
| 32 | Bd4 |
| 33 | Ca1 |
| 34 | Ca2 |
| 35 | Ca3 |
| 36 | Ca4 |
| 37 | Cb1 |
| 38 | Cb2 |
| 39 | Cb3 |
| 40 | Cb4 |
| 41 | Cc1 |
| 42 | Cc2 |
| 43 | Cc3 |
| 44 | Cc4 |
| 45 | Cd1 |
| 46 | Cd2 |
| 47 | Cd3 |
| 48 | Cd4 |
| 49 | Da1 |
| 50 | Da2 |
| 51 | Da3 |
| 52 | Da4 |
| 53 | Db1 |
| 54 | Db2 |
| 55 | Db3 |
| 56 | Db4 |
| 57 | Dc1 |
| 58 | Dc2 |
| 59 | Dc3 |
| 60 | Dc4 |
| 61 | Dd1 |
| 62 | Dd2 |
| 63 | Dd3 |
| 64 | Dd4 |
Data Properties:
For all files, the no data value is -99999.
For all files, the projection is EPSG 4269.
There is one band for each data file.
All files have 1153 columns and 494 rows, except ecosystem_functional_types_interannual_variability.tif, which has 1155 columns and 496 rows.
Application and Derivation
Environmental observatory networks (EONs), like AmeriFLUX and NEON, are organizations that observe environmental factors across multiple study sites. The effectiveness of NEON observations to represent the spatial heterogeneity of environmental factors across study sites must be assessed to inform network design.
The research that produced this dataset offers an alternative approach to evaluate the representativeness of AmeriFLUX and NEON network eddy covariance sites by assessing spatial functional heterogeneity of EFT measures using the maximum entropy approach (Maxent). Accordingly, the AmeriFlux network represents 55% and the NEON network represents 23% of the spatial functional heterogeneity across CONUS. The combined effort of AmeriFlux and NEON core sites represents 46% of the spatial functional heterogeneity across CONUS.
See the related publication (Villarreal et al. 2018) for more information.
Quality Assessment
Data quality was not specifically assessed. The three metrics used to derive the EFTs represented more than 80% of variance in the annual EVI time series.
Data Acquisition, Materials, and Methods
EFT Derivation
Ecosystem functional types (EFTs) are groupings of ecosystems based on their similar ecosystem functioning that are used to represent the spatial patterns and temporal variability of key ecosystem functional traits without prior knowledge of vegetation type or canopy architecture. EFTs were derived from 2001 - 2014 time-series of satellite images of the Enhanced Vegetation Index (EVI, a surrogate of carbon gain dynamics) from NASA's Moderate Resolution Imaging Spectroradiometer (MODIS) product MOD13C2 with a spatial resolution of 0.05°×0.05° across CONUS. Specifically, EFTs were derived from three metrics of the EVI seasonal curve related to the dynamics of terrestrial carbon gains: (1) annual mean as an estimate of primary production; (2) EVI seasonal coefficient of variation as a descriptor of seasonality; and (3) the month of the annual maximum EVI value as an indicator of phenology. The range of values of each EVI metric was divided into four intervals, giving a potential number of 64 EFT categories, and each category is a summary of the information contained in the three EVI metrics for each 0.05°×0.05° grid pixel.
Two EFT measures were derived from the 14 years of EFTs. Ecosystem functional type diversity (EFTmode) was calculated as the modal (most repeated) EFT within each pixel throughout the 14-year period. Ecosystem functional type interannual variability (EFTint) was calculated as the number of unique EFTs occurring within each pixel throughout the 14-year period.
Spatial Functional Heterogeneity Calculation
The AmeriFlux network has 207 total study sites and the NEON network has 56 total study sited across CONUS. AmeriFlux has designated 46 core sites and NEON has 17 core sites across CONUS.
Spatial functional heterogeneity (i.e., spatial representativeness) across CONUS was calculated using the maximum entropy approach (Maxent), and estimates the suitability of the network to represent the spatial heterogeneity of EFTmode and EFTint. A separate Maxent analysis was performed for: (1) the AmeriFlux network; (2) the NEON network; and (3) the combined AmeriFlux and NEON core sites. The final result derived from the Maxent model are expressed using a Kappa index derived from cross-validation, where Kappa index of 1 indicates areas with characteristics that are more likely to be monitored by the network sites.
See the related publication (Villarreal et al. 2018) for more information.
Data Access
These data are available through the Oak Ridge National Laboratory (ORNL) Distributed Active Archive Center (DAAC).
Ecosystem Functional Type Distribution Map for the Conterminous USA, 2001-2014
Contact for Data Center Access Information:
- E-mail: uso@daac.ornl.gov
- Telephone: +1 (865) 241-3952
References
Villarreal, S., Guevara M., Alcaraz-Segura, D., Vargas, R., (2018). Ecosystem functional diversity and the representativeness of environmental networks across the conterminous United States. Agric For Meteorol, 262:423-33. https://doi.org/10.1016/j.agrformet.2018.07.016