Documentation Revision Date: 2019-11-01
Dataset Version: 2
Summary
DARTE is the first nationally consistent inventory of US on-road CO2 emissions built from bottom-up source activity data and establishes a national benchmark for monitoring, reporting, and verification of emissions that are vital for regulating greenhouse gases. The DARTE data provides insights into how urban areas contribute to climate change.
DARTE combined the Federal Highway Administration's (FHWA's) Highway Performance Monitoring System (HPMS) roadway-level vehicle miles traveled with year- and state-specific emissions factors for five vehicle types on six classes of urban and rural roads. Vehicle emissions were estimated directly at the scale of individual road segments without the need to downsize emissions using spatial predictors. This approach helped to refine the uncertainty in the spatial distribution of road vehicle emissions and showed the highly nonlinear relationship between population density and emissions.
Inventories are provided in 38 individual GeoTIFF files with 1-km spatial resolution. Each GeoTIFF file is a separate year of CO2 emission estimates. A GeoDatabase file containing all years of data is also included.
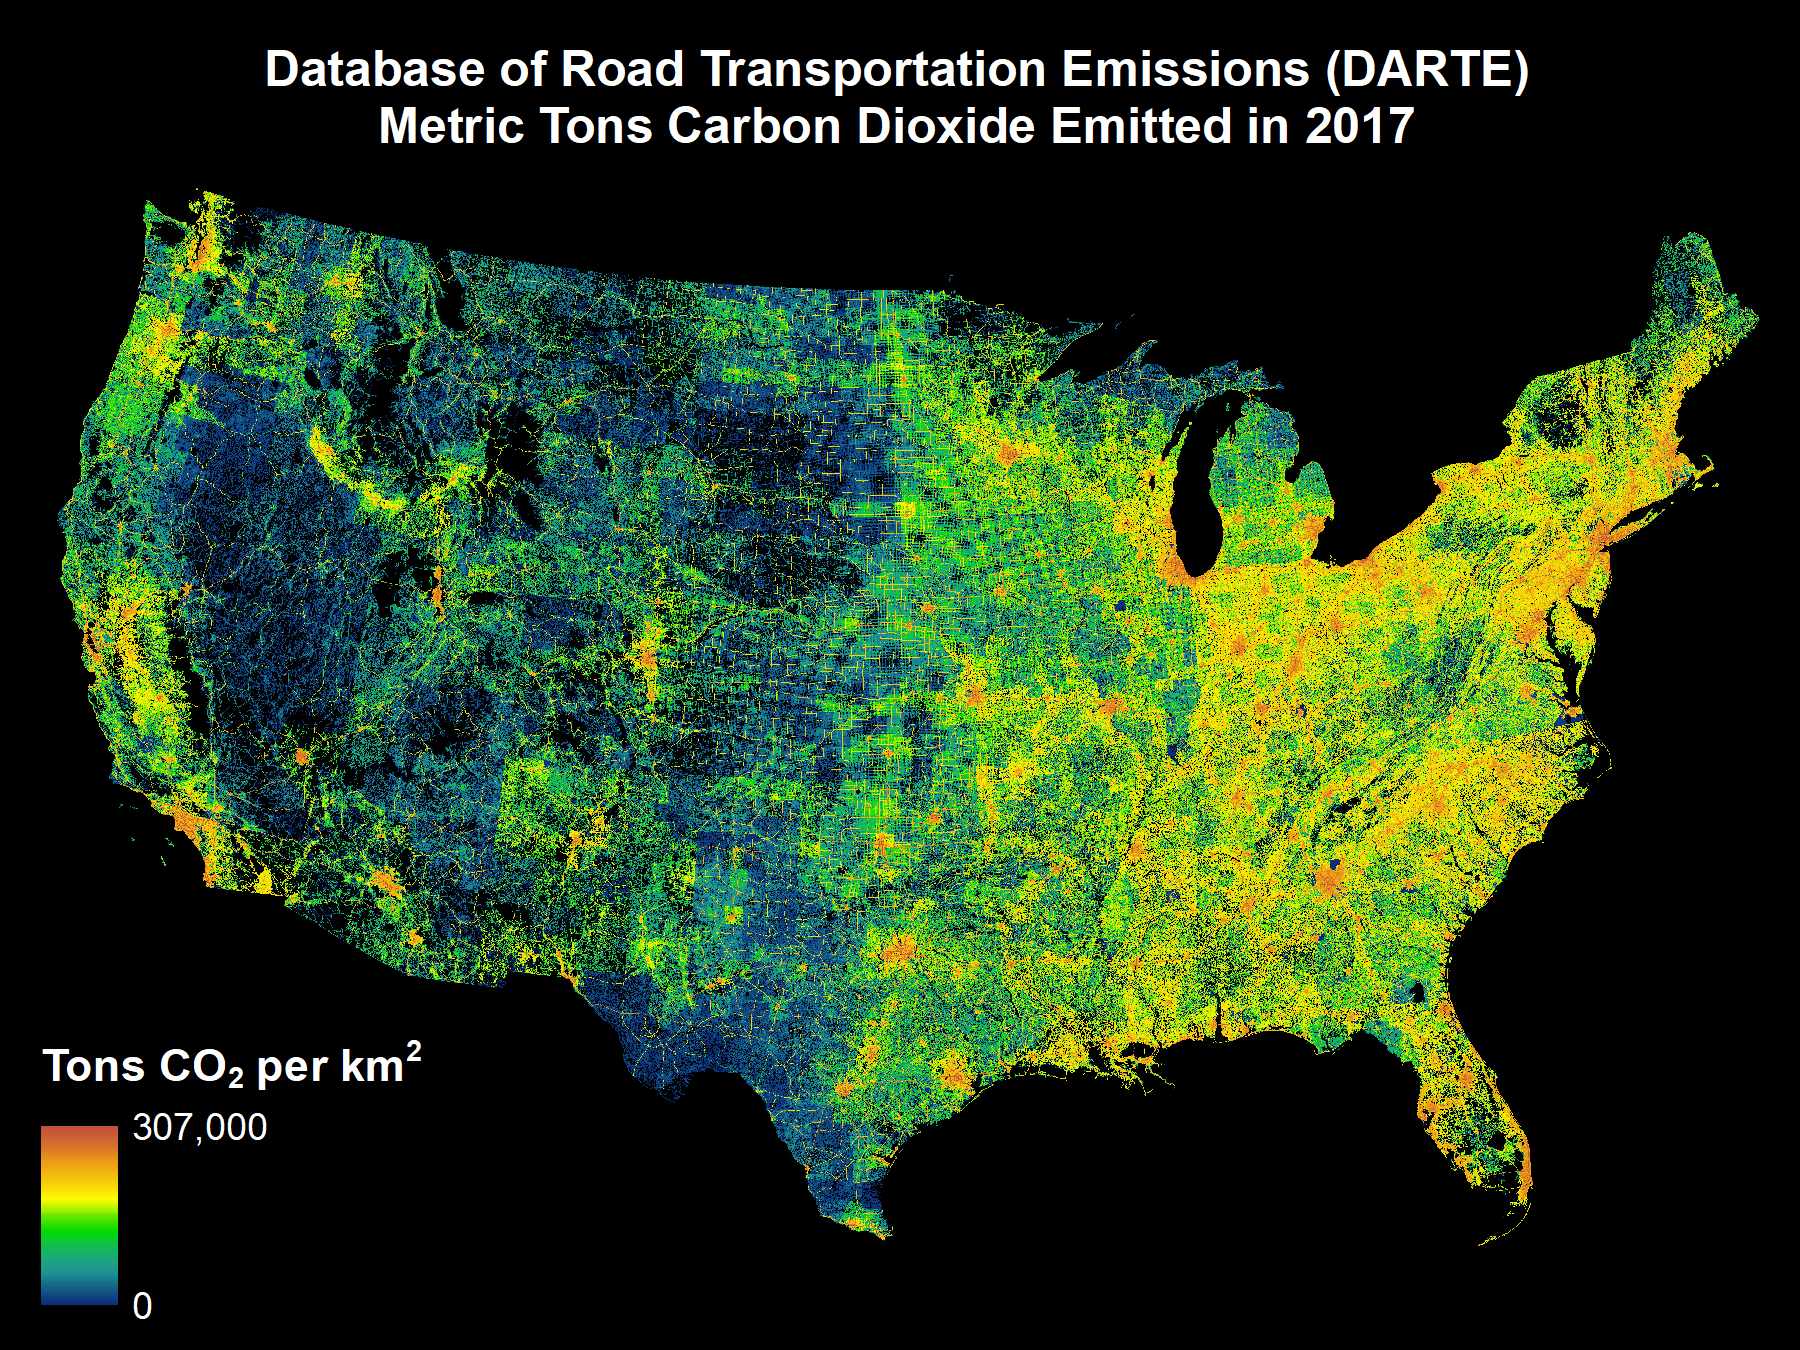
Figure 1. Map of DARTE 2017 on-road CO2 emissions for the conterminous United States.
Citation
Gately, C., L.R. Hutyra, and I.S. Wing. 2019. DARTE Annual On-road CO2 Emissions on a 1-km Grid, Conterminous USA, V2, 1980-2017. ORNL DAAC, Oak Ridge, Tennessee, USA. https://doi.org/10.3334/ORNLDAAC/1735
Table of Contents
- Dataset Overview
- Data Characteristics
- Application and Derivation
- Quality Assessment
- Data Acquisition, Materials, and Methods
- Data Access
- References
- Dataset Revisions
Dataset Overview
This data set provides a 38-year, 1-km resolution inventory of annual on-road CO2 emissions for the conterminous United States based on roadway-level vehicle traffic data and state-specific emissions factors for multiple vehicle types on urban and rural roads as compiled in the Database of Road Transportation Emissions (DARTE). CO2 emissions from the on-road transportation sector are provided annually for 1980-2017 as a continuous surface at a spatial resolution of 1 km.
DARTE is the first nationally consistent inventory of US on-road CO2 emissions built from bottom-up source activity data and establishes a national benchmark for monitoring, reporting, and verification of emissions that are vital for regulating greenhouse gases. The DARTE data provides insights into how urban areas contribute to climate change.
DARTE combined the Federal Highway Administration's (FHWA's) Highway Performance Monitoring System (HPMS) roadway-level vehicle miles traveled with year- and state-specific emissions factors for five vehicle types on six classes of urban and rural roads. Vehicle emissions were estimated directly at the scale of individual road segments without the need to downsize emissions using spatial predictors. This approach helped to refine the uncertainty in the spatial distribution of road vehicle emissions and showed the highly nonlinear relationship between population density and emissions.
Project: Carbon Monitoring System (CMS)
The NASA Carbon Monitoring System (CMS) is designed to make significant contributions in characterizing, quantifying, understanding, and predicting the evolution of global carbon sources and sinks through improved monitoring of carbon stocks and fluxes. The System will use the full range of NASA satellite observations and modeling/analysis capabilities to establish the accuracy, quantitative uncertainties, and utility of products for supporting national and international policy, regulatory, and management activities. CMS will maintain a global emphasis while providing finer scale regional information, utilizing space-based and surface-based data and will rapidly initiate generation and distribution of products both for user evaluation and to inform near-term policy development and planning.
Related Dataset:
Gately, C., and L.R. Hutyra. 2018. CMS: CO2 Emissions from Fossil Fuels Combustion, ACES Inventory for Northeastern USA. ORNL DAAC, Oak Ridge, Tennessee, USA. https://doi.org/10.3334/ORNLDAAC/1501
Acknowledgements:
This project was funded by NASA’s Interdisciplinary Science (IDS) and Carbon Monitoring System (CMS) programs, and NOAA’s Atmospheric Chemistry Carbon Cycle and Climate program under the CO2-Urban Synthesis and Analysis (CO2-USA) project.
Data Characteristics
Spatial Coverage: Conterminous United States
Spatial Resolution: 1-km resolution
Temporal Coverage: The data cover the period 1980-01-01 to 2017-12-31
Temporal Resolution: Annual
Study Area: (All latitudes and longitudes given in decimal degrees)
|
Site |
Westernmost Longitude |
Easternmost Longitude |
Northernmost Latitude |
Southernmost Latitude |
|
Conterminous United States |
-137.257 |
-62.0377 |
53.3863 |
22.0928 |
Data File Information
Inventories are provided in 38 individual GeoTIFF files; each GeoTIFF file is a separate year of CO2 emission estimates. A GeoDatabase file containing all years of data (DARTE_v2.gdb.zip) is also included.
GeoTIFF files
GeoTIFF files are named onroad_YYYY.tif, where YYYY is the year 1980 - 2017, respectively. CO2 emissions are in units of kilograms per square kilometer of CO2 emitted per year.
Spatial Representation Type: Raster
Pixel Depth: 64 bit
Pixel Type: float
Number of Bands: 1
Source Type: continuous
Nodata Value: -9999.0
Scale Factor: none
Offset: none
Endian Type: NA
Number Columns: 5,070
Column Resolution: 1,000 meter
Number Rows: 3,560
Row Resolution: 1,000 meter
Extent in the items coordinate system
North: 1952000
South: -1608000
West: -2736000
East: 2334000
Projection: Lambert_Conformal_Conic
False_Easting: 0.00000000
False_Northing: 0.00000000
Central_Meridian: -97.00000000
Standard_Parallel_1: 33.00000000
Standard_Parallel_2: 45.00000000
Scale_Factor: 1.00000000
Latitude_Of_Origin: 40.00000000
Linear Unit: Meter
Geographic Coordinate System: GCS_WGS_1984
Datum: D_WGS_1984
Prime Meridian: Greenwich
Angular Unit: Degree
Extent in the data file coordinate system:
Top: 1952000 m
Right: 2334000 m
Left: -2736000 m
Bottom: -1608000 m
Geodatabase File:
The DARTEv2 emissions estimates are also available aggregated to U.S. 2010 Census Block Group polygons. These data are provided in the DARTEv2.gdb.zip file, which is a zipped ESRI file geodatabase. This file can be opened using the ESRI ArcGIS software or using open-source software such as QGIS or OGR/GDAL. This file is the source data for the data visualizations and analysis featured here: https://www.nytimes.com/interactive/2019/10/10/climate/driving-emissions-map.html
The DARTEv2.gdb contains the polygon feature class: DARTE_v2_blockgroup_kgco2_1980_2017. The attribute table for the feature class contains a column for each year’s annual emissions, and a unique numeric identifier for each Census Block Group. Units for the data are total emissions in kilograms CO2 per year for each Block Group. The emissions are not normalized by area. The attribute table contains an additional column, “bg_area_m2”, which reports the area of each Block Group polygon in square meters, if users wish to normalize by area. Note that the file contains Block Groups for Alaska, Hawaii, and Puerto Rico. However, emissions are reported as zero for these Block Groups, as these states were not included in the DARTEv2 emissions estimates.
The source for the Block Group spatial geography is the 2016 U.S. Census American Community Survey Block Group Shapefile. That file is available for download at: https://www.census.gov/geographies/mapping-files/time-series/geo/tiger-data.2016.html
or at: https://www2.census.gov/geo/tiger/TIGER_DP/2016ACS/ACS_2016_5YR_BG.gdb.zip
Application and Derivation
Although the United States has 5% of the world's population and 30% of the world's automobiles, it emits 45% of global transportation CO2 emissions (1.57 billion metric tons in 2012). These emissions account for 28% of US fossil fuel CO2 emissions. Despite the large contributions of on-road emissions, the spatial distribution of emissions are highly uncertain and poorly quantified especially at substate and urban scales. Reducing the uncertainty of on-road CO2 emissions at finer spatial scales is central to understanding the determinants of motor vehicle emissions, constraining carbon budgets, and supporting greenhouse gas emission monitoring and abatement, particularly at the scale of cities. DARTE can provide valuable information to local and regional climate change mitigation initiatives by providing detailed city-scale greenhouse gas emissions estimates and a tool to assess response to policy. DARTE's bottom-up approach differs markedly from other emissions estimates that rely on population as a linear predictor of vehicle activity. DARTE was used to quantify the spatiotemporal varying effects of population density, income, employment and transit use on on-road CO2 emissions across the United States. DARTE is derived from HPMS roadway-level vehicle miles traveled (VMT) combined with year- and state-specific emissions factors for five vehicle types to calculate CO2 emissions from motor gasoline and diesel fuel consumption on six classes of urban and rural roads.
Quality Assessment
Within the HPMS database, the annual vehicle miles traveled (VMT) information was inspected by county and functional class to identify potential outliers or structural breaks in the dataset. A filtering algorithm flagged any observation in an individual county/functional class time series if the magnitude of the year-on-year difference between an observation and adjacent years was greater than two standard deviations from the mean year-on-year difference of that time series. Of the 761,759 observations in the dataset, roughly 10% were flagged and replaced by the filtering procedure.
Direct quantification of the uncertainty in US on-road emissions is made impossible by the absence of independent data sources against which to compare government estimates. Further external validation of emission inventories is hampered by the lack of independent measurements of source activity, but it is informative to compare the effects of different model methodologies and proxy performance on the consistency of emissions estimates. Because DARTE estimates were not calculated using population or road density, we were able to evaluate the performance of these variables as spatial predictors by comparing DARTE with other well-known inventories. We aggregated DARTE’s roadway-scale emissions so that we could compare directly to the native resolutions of EDGAR and the Vulcan Project. Comparing DARTE with these existing downscaled inventories, biases of 100% or more were found in the spatial distribution of urban and rural emissions. These biases were mainly the result of mismatches between inventory downscaling proxies and the actual spatial patterns of vehicle activity at urban scales. The DARTE 1-km grid cells nest exactly within the Vulcan Product’s 10-km grid cells for ease of comparison and combination.
Data Acquisition, Materials, and Methods
DARTE Version 1 development steps:
A full description of the procedure and analyses of results are provided in Gately et al. (2015).
The Highway Performance Monitoring System (HPMS) is a traffic monitoring program overseen by the Federal Highway Administration. All U.S. states and the District of Columbia are required to submit annual estimates for a wide variety of traffic and highway condition data to HPMS in compliance with federal statute. This data has been archived in a digital tabular format since 1980. The HPMS dataset used to generate the 1980-2012 emissions estimates in DARTE is well described in the archived versions of the HPMS Field Manual. The core data features of the HPMS are individual road segments that are defined by the state transportation departments. For each road segment HPMS reports the center-line length in miles, annual average daily traffic (AADT), functional class, urban/rural context, and county. AADT is a measure of the number of vehicles that traverse the road segment on an average day, adjusted for seasonal and day-of-week variation. For 2013-2017, HPMS became available in shapefile format from FHWA. Data for each road in the national shapefile was aggregated by functional class, county, and urban area to remain consistent with the 1980-2009 data.
Annual vehicle miles travelled (VMT) on each road segment was calculated by multiplying AADT by the length of the road segment and then by 365 days (or 366 days for leap years). Road-segment VMT were aggregated to the lowest common level of geography including 12 roadway functional classes included in HPMS, six for urban roads and six for rural roads. HPMS data were aggregated to counties by using the reported functional classes and a geocoded road network for the U.S. that is also partitioned by these functional classes. State-level VMT data for rural local roads were integrated into the county-level database by allocating state totals by functional class to each county.
For each year, county, and functional class, annual VMT from HPMS were partitioned into the five vehicle types used by the Highway Statistics Series Table VM-4: Passenger cars, passenger trucks (SUV, pickups, minivans), buses, single-unit trucks, and combination trucks. VMT was then used to calculate fuel use and associated CO2 emissions. A calibrated fuel economy and VMT by vehicle type was used to calculate gallons of motor gasoline and diesel fuel consumption, for each year, county, and road functional class. For each road in the database, the annual time series of fuel consumption was then smoothed using a loess (locally-estimated scatterplot smoothing) algorithm to reduce inter-annual noise arising from data gaps and periodic road reclassification. For each state, annual fuel consumption for each road was then scaled such that the sum of all roads’ fuel consumption was equal to the published state totals in FHWA Highway Statistics Series Table MF-21. The motor gasoline and diesel fuel consumption were then converted to CO2 emissions using emission factors from EIA. Emissions were assigned to a geographic information system (GIS) layer of the US road network obtained from the 2016 Census TIGER/Line geodatabase. This road network layer was then aggregated to a 1 x 1 km spatial grid.
Updates for Version 2:
This new update to the DARTE dataset extends the time series of annual emissions up through the year 2017. The data sources and methodology are largely unchanged, although a few modifications were necessary to improve accuracy while also maintaining consistency with the first DARTE release. First, the base road network was changed to the 2016 TIGER road shapefile for the U.S. All emissions estimates from the first release (1980-2012) as well as the second release (2013-2017) were assigned to this single road shapefile.
For the years 2013-2017, data on vehicle miles travelled (VMT) were obtained from the GIS shapefiles that are now available from the FHWA HPMS division. These road-level data were then aggregated by county and functional class, to maintain consistency with the VMT data aggregation in the first DARTE release. However, the VMT totals in the 2013-2017 shapefiles do not sum to the statewide totals reported by the FHWA in the Highway Statistics Series, which was used as a control total in the first release of DARTE. We therefore calculated the difference in VMT between the shapefile totals and the state totals for each functional class, and assigned these amounts uniformly across that class of roads in each county, based on that county's share of state total VMT for that functional class. This method is the same as was used in the first release of DARTE to assign VMT from the HPMS local road summary files. For further details, see the Supporting Information in Gately et al. (2015).
The final major difference in methodology for this new release was that we have now adjusted the total consumption of motor gasoline and diesel fuel estimated by DARTE for each state and year to match exactly the reported state totals in the Highway Statistics Series Table MF-21. In the first release, this adjustment was made using a complex procedure that optimized vehicle fuel economies and fleet characteristics such that each year's DARTE estimates were within 5% of the MF-21 totals. In this release, we simplified the approach by making initial estimates of fuel consumption using the vehicle fuel economies and vehicle fleet characteristics as reported in Highway Statistics Series Tables VM-1 and VM-4, respectively. These estimates are then adjusted to match the MF-21 state totals exactly by scaling the individual estimates for each county, road functional class, and fuel type by vehicle as shown below:
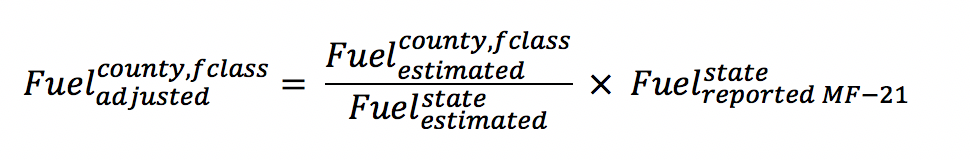
This adjustment was done for all years in the dataset (1980-2017), and thus the totals for the years 1980-2012 have now changed slightly and will not match the older release. All data files in the current release available here use the new method.
DARTE V2 Census Block Group Geography:
The DARTEv2 emissions estimates are also available aggregated to U.S. Census Block Group polygons. These data are provided in the DARTEv2.gdb.zip file. To aggregate the DARTE V2 data to Census Blocks, the authors used a similar method to that used to aggregate to the 1 x 1 km grid. Roadway-scale emissions of kilograms CO2 per meter of road segment comprise the base level estimates in the DARTEv2 database. These data are represented as a large spatial polyline feature. This polyline was intersected with the Census Block Group polygons. For each Census Block Group, the per-meter emissions for each road segment were then multiplied by the length of the road segment that falls within the Block Group. Total emissions for each road segment were then summed across all road segments in the Block Group to obtain the total emissions for each Block Group for each year.
Data Access
These data are available through the Oak Ridge National Laboratory (ORNL) Distributed Active Archive Center (DAAC).
DARTE Annual On-road CO2 Emissions on a 1-km Grid, Conterminous USA, V2, 1980-2017
Contact for Data Center Access Information:
- E-mail: uso@daac.ornl.gov
- Telephone: +1 (865) 241-3952
References
Gately, C.K. et al., PNAS, 2015. Cities, traffic, and CO2: A multidecadal assessment of trends, drivers and scaling relationships. vol. 112 no. 16:4999-5004. https://doi.org/10.1073/pnas.1421723112
Gurney KR, et al. (2009) High resolution fossil fuel combustion CO2 emission fluxes for the United States. Environ Sci Technol 43:5535–5541. https://doi.org/10.1021/es900806c
Highway Performance Monitoring System Field Manual. Office of Highway Policy Information, Federal Highway Administration, Washington DC, 2019. URL: https://www.fhwa.dot.gov/policyinformation/hpms/fieldmanual/
Highway Statistics Series, Table MF-21; 1980−2017; Federal Highway Administration: Washington, DC. http://www.fhwa.dot.gov/policyinformation/statistics. Accessed July 1, 2019.
Highway Statistics Series, Table VM-4; 1980−2017; Federal Highway Administration: Washington, DC. http://www.fhwa.dot.gov/policyinformation/statistics. Accessed July 1, 2019.
JRC/PBL (2011) Emission Database for Global Atmospheric Research (EDGAR) (European Comission, Joint Research Centre/Netherlands Environmental Assessment Agency, Ispra, Italy), Version 4.2 Available at edgar.jrc.ec.europa.eu. Accessed May 1, 2014.
US Census Bureau (2016) TIGER/Line Shapefiles (US Census Bureau, Washington DC). Available at https://www.census.gov/geographies/mapping-files/time-series/geo/tiger-geodatabase-file.2016.html Accessed July 1, 2019.
US Environmental Protection Agency, Emissions Factor Hub. https://www.epa.gov/climateleadership/center-corporate-climate-leadership-ghg-emission-factors-hub Accessed July 1, 2019
US Energy Information Administration, Carbon Dioxide Emissions Factors. https://www.eia.gov/tools/faqs/faq.php?id=307&t=1
Dataset Revisions
|
DARTE Version |
Release Date | Description of Changes |
|---|---|---|
| Version 2 | 2019-09-27 | Released revised data for years 1980 - 2012 and added data for years 2013-2017. |
| Version 1 | 2015-09-24 | ORNL DAAC released annual gridded data for years 1980 - 2012. |