Documentation Revision Date: 2021-12-21
Dataset Version: 1
Summary
NASA SRTM Version 3 data of global surface elevation at 1 arcsec (~30 m) resolution were used to calculate both the average and the standard deviation of elevation at 100 m resolution. Annual growing season (May–October) average surface reflectance data in the red, near-infrared, and shortwave infrared bands were used from Landsat 5 and Landsat 8. The filtering and calibration were performed on Google Earth Engine. Percent tree cover was derived from very high resolution (1 m) NAIP data across the entire CONUS.
There are 30 data files in GeoTIFF (*.tif) format included in this dataset.
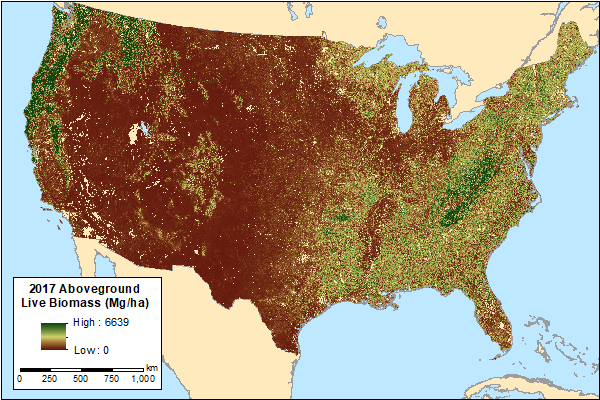
Figure 1. Aboveground live biomass across CONUS for the year 2017 derived from the MaxEnt model.
Citation
Yu, Y., S.S. Saatchi, B.F. Walters, S. Ganguly, S. Li, S. Hagen, L. Melendy, R.R. Nemani, G.M. Domke, and C.W. Woodall. 2021. Carbon Pools across CONUS using the MaxEnt Model, 2005, 2010, 2015, 2016, and 2017. ORNL DAAC, Oak Ridge, Tennessee, USA. https://doi.org/10.3334/ORNLDAAC/1752
Table of Contents
- Dataset Overview
- Data Characteristics
- Application and Derivation
- Quality Assessment
- Data Acquisition, Materials, and Methods
- Data Access
- References
Dataset Overview
This dataset provides annual estimates of six carbon pools, including forest aboveground live biomass, belowground biomass, aboveground dead biomass, belowground dead biomass, litter, and soil organic matter, across the conterminous United States (CONUS) for 2005, 2010, 2015, 2016, and 2017. Carbon stocks were estimated using a modified MaxEnt model. Measurements of pixel-specific site conditions from remote sensing data were combined with field inventory data from the U.S. Forest Service Forest Inventory and Analysis (FIA). Remote sensing data inputs included Thematic Mapper on Landsat 5, Operational Land Imager on Landsat 8, Moderate Resolution Imaging Spectroradiometer (MODIS) on Aqua, microwave radar measurements from Phased Array type L-band Synthetic Aperture Radar (PALSAR) on Advanced Land Observation Satellite (ALOS) and PALSAR-2 ALOS-2, airborne imagery from National Agriculture Imagery Program (NAIP), and the digital elevation model from the Shuttle Radar Topography Mission (SRTM). Data from satellite and airborne sources were co-registered on a common 100 m (1 ha) grid.
NASA SRTM Version 3 data of global surface elevation at 1 arcsec (~30 m) resolution were used to calculate both the average and the standard deviation of elevation at 100 m resolution. Annual growing season (May–October) average surface reflectance data in the red, near-infrared, and shortwave infrared bands were used from Landsat 5 and Landsat 8. The filtering and calibration were performed on Google Earth Engine. Percent tree cover was derived from very high resolution (1 m) NAIP data across the entire CONUS.
Project: Carbon Monitoring System
The NASA Carbon Monitoring System (CMS) is designed to make significant contributions in characterizing, quantifying, understanding, and predicting the evolution of global carbon sources and sinks through improved monitoring of carbon stocks and fluxes. The System will use the full range of NASA satellite observations and modeling/analysis capabilities to establish the accuracy, quantitative uncertainties, and utility of products for supporting national and international policy, regulatory, and management activities. CMS will maintain a global emphasis while providing finer scale regional information, utilizing space-based and surface-based data, and will rapidly initiate generation and distribution of products both for user evaluation and to inform near-term policy development and planning.
Related Publication
Yu, Y., S. Saatchi, G.M. Domke, B. Walters, C. Woodall, S. Ganguly, S. Li, S. Kalia, T. Park, R. Nemani, S.C. Hagen, and L. Melendy. 2021. Making the US National Forest Inventory Spatially Contiguous and Temporally Consistent. In progress.
Related Dataset
Hagen, S., N. Harris, S.S. Saatchi, T. Pearson, C.W. Woodall, S. Ganguly, G.M. Domke, B.H. Braswell, B.F. Walters, J.C. Jenkins, S. Brown, W.A. Salas, A. Fore, Y. Yu, R.R. Nemani, C. Ipsan, and K.R. Brown. 2016. CMS: Forest Carbon Stocks, Emissions, and Net Flux for the Conterminous US: 2005-2010. ORNL DAAC, Oak Ridge, Tennessee, USA. https://doi.org/10.3334/ORNLDAAC/1313
Acknowledgements
This work was supported by the NASA Carbon Monitoring System program.
Data Characteristics
Spatial Coverage: Conterminous United States
Spatial Resolution: 100 m
Temporal Resolution: Annual
Temporal Coverage: 2005-01-01 to 2017-12-31
Site Boundaries: Latitude and longitude are given in decimal degrees.
| Site | Westernmost Longitude | Easternmost Longitude | Northernmost Latitude | Southernmost Latitude |
|---|---|---|---|---|
| CONUS | -130.233 | -64.128 | 52.857 | 21.587 |
Data File Information
There are 30 data files in GeoTIFF (*.tif) format included in this dataset that provide the annual means for each of six carbon pools for the nominal years 2005, 2010, 2015, 2016, and 2017.
The files are named CONUS_CP_YYYY_v1.tif (e.g., CONUS_deadbgb_2017_v1.tif), where CP is the abbreviation for the measured carbon pool (see Table 1) and YYYY is the nominal year of the data (i.e., 2005, 2010, 2015, 2016, or 2017).
Table 1. File names and provided carbon pools.
| File Name | Carbon Pool |
|---|---|
| CONUS_agb_YYYY_v1.tif | Living aboveground biomass |
| CONUS_bgb_YYYY_v1.tif | Living belowground biomass |
| CONUS_carbonlitter_YYYY_v1.tif | Litter |
| CONUS_carbonsoilorg_YYYY_v1.tif | Soil organic matter |
| CONUS_deadagb_YYYY_v1.tif | Dead aboveground biomass |
| CONUS_deadbgb_YYYY_v1.tif | Dead belowground biomass |
Data File Details
Missing values are represented by -999. Each file contains 31,500 rows and 48,000 columns. The Coordinate Reference System is “NAD83_Conus_Albers” (EPSG:42303). Measurements are provided in units of Mg C ha-1.
Application and Derivation
These data could be useful for studies of carbon cycling and climate change.
Quality Assessment
The techniques used to produce aboveground biomass (AGB) estimates and uncertainty are described in Section 5 and here.
The expected value of AGB at pixel i,j is represented by Bi,j. Uncertainty for pixel i,j is given by
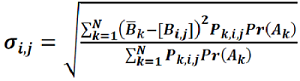
where Pk,i,j is the MaxEnt generated probability of prediction derived from Bayesian estimator for kth bin for the pixel i,j. Separate models were trained for each year of prediction using plot measurements from that year only. This approach was chosen as opposed to using one model across multiple years of prediction to minimize the effect of any cross-calibration errors between remote sensing layers of different years. This approach also allows the use of adjacent-year measurements for independent validation.
Data Acquisition, Materials, and Methods
This study combined data from remote sensing, both spaceborne and airborne sensors, with field surveys to estimate carbon stocks across the conterminous United States (CONUS). Spatially explicit measurements of pixel-scale site conditions were derived from satellite and airborne imagery. Then, carbon pools were estimated, using a modified MaxEnt model, by combining the remotely sensed metrics with field data from the U.S. Forest Service Forest Inventory and Analysis (FIA). Estimates were produced for the nominal years of 2005, 2010, 2015, 2016, and 2017.
Percent tree cover was derived from high resolution (1 m) aerial imagery from National Agriculture Imagery Program (NAIP) combined with surface reflectance data from satellite sensors to map tree cover at 100-m resolution for each nominal year. This step involved an automated probabilistic approach from Basu et al. (2015). Training data was obtained from the high-resolution NAIP layer sampled across CONUS and rescaled to match Landsat data: Thematic Mapper on Landsat 5, Operational Land Imager on Landsat 8, and Moderate Resolution Imaging Spectroradiometer (MODIS) on Aqua.
The methods below describe the technique for estimating aboveground biomass (AGB). The same technique was used to generate estimates of the other carbon pools by linking remotely sensed data to relevant field measurements at FIA plots. Additional carbon pools included belowground biomass, aboveground dead biomass, belowground dead biomass, litter, and soil organic matter.
AGB was estimated using a non-parametric approach based on Maximum Entropy (MaxEnt; Phillips et al., 2006). MaxEnt was originally developed to model species distributions (Phillips and Dudík, 2008), but a modified MaxEnt model has been used to estimate AGB (Saatchi et al., 2011; Harris et al., 2016; Xu et al., 2017). The modified MaxEnt generates a probability distribution of the amount of AGB in a given pixel based on the site conditions in that pixel.
To estimate model parameters, training data were developed from pixels having FIA field measurements of AGB. For each nominal year, FIA plots measured during that year were used as training data, and remote sensing layers representative of the growing season of that year served as measures of site conditions. Separate models were trained for each nominal year using plot measurements from that year only. This approach was chosen as opposed to using one model across multiple years of prediction to minimize the effect of any cross-calibration errors between remote sensing layers of different years. This also allows the use of adjacent-year measurements for independent validation.
Site conditions at 100 m scale were provided by microwave radar measurements from Phased Array type L-band Synthetic Aperture Radar (PALSAR) on Advanced Land Observation Satellite (ALOS) and PALSAR-2 ALOS-2, spectral reflectance from Landsat, percent tree cover, and the digital elevation model from the Shuttle Radar Topography Mission (SRTM). ALOS imagery at HH and HV polarizations (Shimada and Ohtaki, 2010) were aggregated from 25 m resolution to 100 m mosaics of the entire CONUS for the period of 2007–2010 and 2015–2017. Missing pixels due to radar layover and shadowing in high topography regions were corrected by a gap-filling approach based on the prediction of radar backscatter from neighboring pixels using other image layers including Normalized Difference Vegetation Index (NDVI) from Landsat and elevation and slope from SRTM data.
The FIA-observed values of AGB were separated into k bins. Average site conditions, measured from remotely sensed data for the training pixels, were compiled for each bin, and the MaxEnt model was trained separately for each bin.
The probability of a pixel having a given amount of ABG, that is, of being in a given bin is
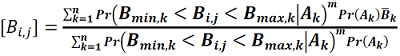
where (Bi,j) represents the expected value of AGB at pixel i,j. The probability of a pixel being in the kth bin given condition of Ak, Pr(Bmin,k < Bi,j < Bmax,k | Ak), is calculated by the MaxEnt model. Ak is the site condition of that pixel and is the average AGB value of kth bin. The value of m=2 was found to be optimal for model prediction.
A Bayesian approach was employed for parameter estimation. A priori probabilities were obtained by aggregating data from FIA plots measured during the nominal year. Intensification plots (Hoover et al., 2020) that are only available for some states were removed to ensure balanced sampling for a priori probability distributions. The Bayesian approach also provides uncertainty. Uncertainty for pixel i,j is given by
where Pk,i,j is the MaxEnt generated probability of prediction derived from Bayseian estimator for kth bin for the pixel i,j. The MaxEnt estimated probabilities for all the bins were then combined with a priori probabilities to produce the final estimate of AGB for each pixel across the CONUS for each nominal year.
To reduce pixel-level uncertainty, data from FIA plots with repeated visits were used to compile statistics on natural rates of tree growth and forest disturbance for 28 forest type groups (Eyre, 1980). These statistics were used to filter out abnormally large changes in pixel values to reduce pixel-level uncertainty.
Refer to Yu et al. (2021) for details.
Table 2. Data products and sources.
| Product | Source | Spatial Coverage | Temporal Coverage | URL |
|---|---|---|---|---|
| Forest Inventory and Analysis (FIA) | USDA Forest Service | CONUS | 1997-2017 | http://www.fia.fs.fed.us/ |
| Surface Reflectance | Landsat 5 | CONUS | 2005-2010 | https://www.usgs.gov/core-science-systems/nli/landsat/ |
| Surface Reflectance | Landsat 8 | CONUS | 2015-2017 | https://www.usgs.gov/core-science-systems/nli/landsat/ |
| Surface Reflectance | MODIS (Aqua) | CONUS | 2005-2017 | https://modis.gsfc.nasa.gov/data/dataprod/mod09.php |
| L-band radar | ALOS/ALOS2 | 2007-2010, 2015-2017 | https://www.eorc.jaxa.jp/ALOS/en/dataset/dataset_index.htm | |
| Elevation | SRTM | CONUS | 2000 | https://www2.jpl.nasa.gov/srtm/ |
| Imagery | NAIP | CONUS | Various by location | https://www.usgs.gov/centers/eros/science/usgs-eros-archive-aerial-photography-national-agriculture-imagery-program-naip |
Data Access
These data are available through the Oak Ridge National Laboratory (ORNL) Distributed Active Archive Center (DAAC).
Carbon Pools across CONUS using the MaxEnt Model, 2005, 2010, 2015, 2016, and 2017
Contact for Data Center Access Information:
- E-mail: uso@daac.ornl.gov
- Telephone: +1 (865) 241-3952
References
Basu, S., S. Ganguly, R.R. Nemani, S. Mukhopadhyay, Gong Zhang, C. Milesi, A. Michaelis, P. Votava, R. Dubayah, L. Duncanson, B. Cook, Yifan Yu, S. Saatchi, R. DiBiano, M. Karki, E. Boyda, U. Kumar, and Shuang Li. 2015. A semiautomated probabilistic framework for tree-cover delineation From 1-m NAIP imagery using a high-performance computing architecture. IEEE Transactions on Geoscience and Remote Sensing 53:5690–5708. https://doi.org/10.1109/TGRS.2015.2428197
Eyre, F.H., 1980. Forest Cover Types of the United States and Canada. Society of American Foresters; Bethesda, Maryland, USA.
Harris, N.L., S.C. Hagen, S.S. Saatchi, T.R. H. Pearson, C.W. Woodall, G.M. Domke, B.H. Braswell, B.F. Walters, S. Brown, W. Salas, A. Fore, and Y. Yu. 2016. Attribution of net carbon change by disturbance type across forest lands of the conterminous United States. Carbon Balance and Management 11. https://doi.org/10.1186/s13021-016-0066-5
Hoover, C.M., R. Bush, M. Palmer, and E. Treasure. 2020. Using Forest Inventory and Analysis Data to Support National Forest Management: Regional Case Studies. Journal of Forestry 118:313–323. https://doi.org/10.1093/jofore/fvz073
Phillips, S.J., and M. Dudík. 2008. Modeling of species distributions with Maxent: new extensions and a comprehensive evaluation. Ecography 31:161–175. https://doi.org/10.1111/j.0906-7590.2008.5203.x
Phillips, S.J., R.P. Anderson, and R.E. Schapire. 2006. Maximum entropy modeling of species geographic distributions. Ecological Modelling 190:231–259. https://doi.org/10.1016/j.ecolmodel.2005.03.026
Saatchi, S.S., N.L. Harris, S. Brown, M. Lefsky, E.T. A. Mitchard, W. Salas, B.R. Zutta, W. Buermann, S.L. Lewis, S. Hagen, S. Petrova, L. White, M. Silman, and A. Morel. 2011. Benchmark map of forest carbon stocks in tropical regions across three continents. Proceedings of the National Academy of Sciences 108:9899–9904. https://doi.org/10.1073/pnas.1019576108
Shimada, M., and T. Ohtaki. 2010. Generating large-scale high-quality SAR mosaic datasets: application to PALSAR data for global monitoring. IEEE Journal of Selected Topics in Applied Earth Observations and Remote Sensing 3:637–656. https://doi.org/10.1109/JSTARS.2010.2077619
Yu, Y., S. Saatchi, G.M. Domke, B. Walters, C. Woodall, S. Ganguly, S. Li, S. Kalia, T. Park, R. Nemani, S.C. Hagen, and L. Melendy. 2021. Making the US National Forest Inventory spatially contiguous and temporally consistent. In progress.
Xu, L., S.S. Saatchi, A. Shapiro, V. Meyer, A. Ferraz, Y. Yang, J.-F. Bastin, N. Banks, P. Boeckx, H. Verbeeck, S.L. Lewis, E.T. Muanza, E. Bongwele, F. Kayembe, D. Mbenza, L. Kalau, F. Mukendi, F. Ilunga, and D. Ebuta. 2017. Spatial distribution of carbon stored in forests of the Democratic Republic of Congo. Scientific Reports 7. https://doi.org/10.1038/s41598-017-15050-z