Documentation Revision Date: 2020-05-15
Dataset Version: 1
Summary
There are a total of 34 total data files in GeoTIFF (.tif) format: 17 files for mean aboveground biomass estimated across 500 Random Forest trees and 17 files for the standard deviation of estimated aboveground biomass.
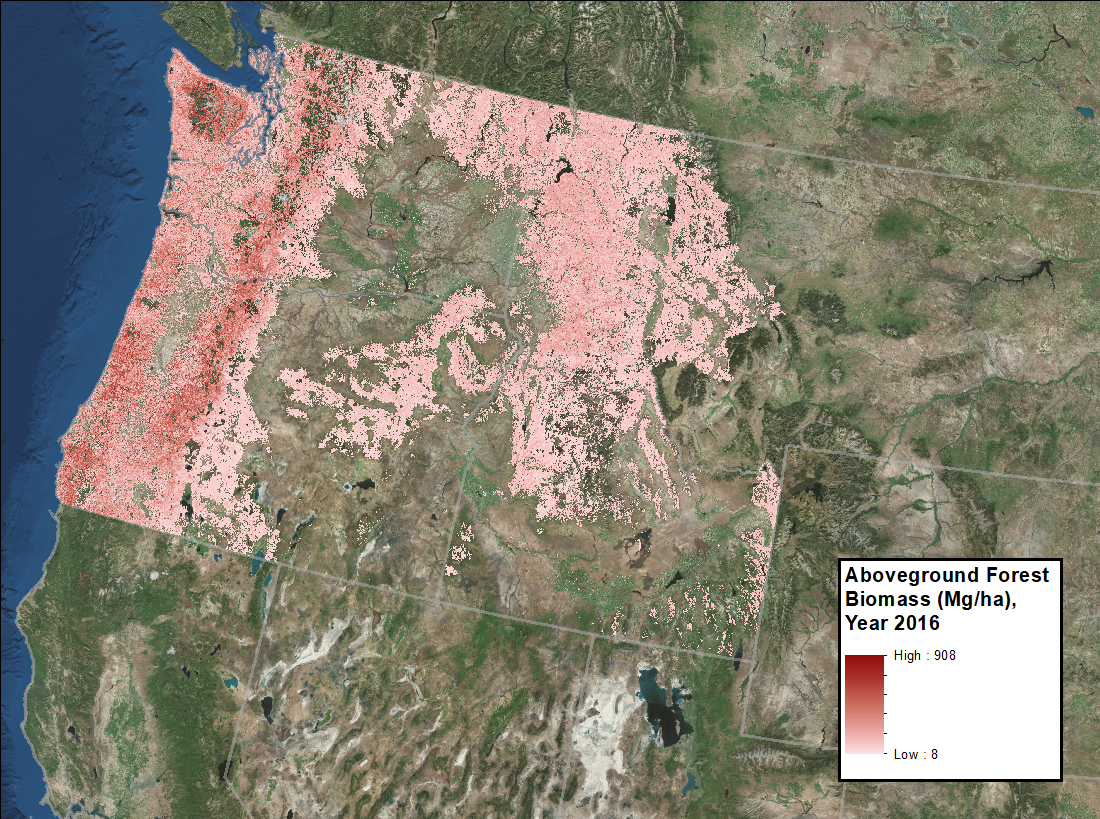
Figure 1. Forest aboveground biomass in megagrams per hectare for the year 2016. Source: AGB_Forest_NW_USA_2016.tif
Citation
Fekety, P.A., and A.T. Hudak. 2019. Annual Aboveground Biomass Maps for Forests in the Northwestern USA, 2000-2016. ORNL DAAC, Oak Ridge, Tennessee, USA. https://doi.org/10.3334/ORNLDAAC/1719
Table of Contents
- Dataset Overview
- Data Characteristics
- Application and Derivation
- Quality Assessment
- Data Acquisition, Materials, and Methods
- Data Access
- References
Dataset Overview
This dataset provides annual maps of aboveground biomass (AGB, Mg/ha) for forests in Washington, Oregon, Idaho, and western Montana, USA, for the years 2000-2016, at a spatial resolution of 30 meters. Tree measurements were summarized with the Fire and Fuels Extension of the Forest Vegetation Simulator (FFE-FVS) to estimate AGB in field plots contributed by stakeholders, then lidar was used to predict plot-level AGB using the Random Forests machine learning algorithm. The machine learning outputs were used to predict AGB from Landsat time series imagery processed through LandTrendr, climate metrics generated from 30-year climate normals, and topographic metrics generated from a 30-m Shuttle Radar Topography Mission (SRTM) digital elevation model (DEM). The non-forested pixels were masked using the PALSAR 2009 forest/nonforest mask.
Project: Carbon Monitoring System (CMS)
The NASA Carbon Monitoring System (CMS) is designed to make significant contributions in characterizing, quantifying, understanding, and predicting the evolution of global carbon sources and sinks through improved monitoring of carbon stocks and fluxes. The System will use the full range of NASA satellite observations and modeling/analysis capabilities to establish the accuracy, quantitative uncertainties, and utility of products for supporting national and international policy, regulatory, and management activities. CMS will maintain a global emphasis while providing finer scale regional information, utilizing space-based and surface-based data and will rapidly initiate generation and distribution of products both for user evaluation and to inform near-term policy development and planning.
Related Publication
Hudak, A.T., P.A. Fekety, V.R. Kane, R.E. Kennedy, S.K. Filippelli, M.J. Falkowski, W.T. Tinkham, A.M.S. Smith, N.L. Crookston, G. Domke, M.V. Corrao, B.C. Bright, D.J. Churchill, P.J. Gould, Jonathan T. Kane, R.J. McGaughey and J. Dong. (Accepted) A carbon monitoring system for mapping regional, annual aboveground biomass across the northwestern USA. Special Issue on “Carbon Monitoring Systems Research and Applications”. Environmental Research Letters (CMS Special Issue).
Related Datasets:
Filippelli, S.K., M.J. Falkowski, A.T. Hudak, and P.A. Fekety. 2020. CMS: Pinyon-Juniper Forest Live Aboveground Biomass, Great Basin, USA, 2000-2016. ORNL DAAC, Oak Ridge, Tennessee, USA. https://doi.org/10.3334/ORNLDAAC/1755
Fekety, P.A., and A.T. Hudak. 2020. LiDAR Derived Forest Aboveground Biomass Maps, Northwestern USA, 2002-2016. ORNL DAAC, Oak Ridge, Tennessee, USA. https://doi.org/10.3334/ORNLDAAC/1766
Acknowledgments:
This work was funded by NASA CMS grant NNH15AZ06I.
Data Characteristics
Spatial Coverage: Northwestern USA, including Washington, Oregon, Idaho, and western Montana (counties west of the Continental Divide)
Spatial Resolution: 30 m
Temporal Coverage: 2000-01-01 to 2016-12-31
Temporal Resolution: annual
Study Area: (all latitudes and longitudes given in decimal degrees)
| Site | Westernmost Longitude | Easternmost Longitude | Northernmost Latitude | Southernmost Latitude |
|---|---|---|---|---|
| Northwestern USA | -127.52394 | -110.31239 | 50.792114 | 39.81159 |
Data File Information
There are 34 total data files in GeoTIFF (.tif) format:
17 files for mean aboveground biomass estimated across 500 Random Forest trees, named as AGB_Forest_NW_USA_YYYY.tif
17 files for the standard deviation of estimated aboveground biomass, named as AGB_StdDev_Forest_ NW_USA_YYYY.tif
where YYYY is the year of the estimate (2000 to 2016).
For all files:
Map values are reported in dry biomass units (Mg/ha).
The no data value is -32768.
The projection is EPSG 5070.
There is one band.
There are 38369 columns and 32587 rows.
Application and Derivation
See Hudak et al. (in review) for details.
Quality Assessment
Precision
Maps representing the standard deviation of the terminal nodes from the Random Forest predictions are included to provide a measure of pixel-level model precision.
Accuracy
Complete Forest Inventory and Analysis (FIA) National Program field measurements for the four states were available for the period 2004-2016. Aboveground biomass (AGB) was calculated from tree lists at the FIA plots using the default equations in the Fire and Fuels Extension of the Forest Vegetation Simulator. Mapped AGB estimates at FIA plot locations were extracted from the annual map products for the year the plots were measured. Annual bias correction factors were calculated as the ratio of the mean plot-level FIA AGB estimates to the mean of the mapped AGB estimates. The relationship between the year and the annual bias correction factor was calculated using linear regression. This line of best fit was used to calculate the bias correction factors for the period 2000-2016:
bias correction factor = 0.005466 * [year] - 10.264663
The annual map values were then multiplied by the calculated bias correction factor for each year for the period 2000-2016.
Data Acquisition, Materials, and Methods
Tree measurements (from living trees and standing dead trees) were obtained from the Fire and Fuels Extension of the Forest Vegetation Simulator (FFE-FVS) for the period 2004-2016 and used to estimate aboveground biomass (AGB). Plot-level lidar data were collected in association with projects that were conducted by stakeholders. For each plot, the AGB estimates were predicted from lidar height and density metrics generated from the lidar returns within the fixed-radius field plot footprints using the Random Forests machine learning algorithm. AGB was then mapped from the same lidar metrics that were gridded across the extent of the lidar collections at 30 m resolution. From these maps, a stratified random sample of AGB pixels was used to train another Random Forests model to predict AGB from Landsat time series imagery processed through LandTrendr (which matched the lidar collection year to the corresponding year of the LandTrendr time series) and climate metrics generated from 30-year climate normals. Non-forested land was masked using the PALSAR 2009 forest/nonforest mask.
Data Access
These data are available through the Oak Ridge National Laboratory (ORNL) Distributed Active Archive Center (DAAC).
Annual Aboveground Biomass Maps for Forests in the Northwestern USA, 2000-2016
Contact for Data Center Access Information:
- E-mail: uso@daac.ornl.gov
- Telephone: +1 (865) 241-3952
References
Hudak et al. (in review) A carbon monitoring system for mapping regional, annual aboveground biomass across the northwestern USA. Special Issue on Carbon Monitoring Systems Research and Applications. Environmental Research Letters.