Documentation Revision Date: 2019-02-15
Dataset Version: 1
Summary
The goal of the study was to develop a wall-to-wall map of aboveground biomass (AGB) density in 1-ha grid cells for the forests in the Kalimantan region of Indonesia (on the island of Borneo). Land cover classes focused on intact lowland and montane forests, secondary and degraded forests, and peat swamp forest as well as estimates of other forest cover types present in the study domain. Airborne lidar sampling included 29 flight lines sampling approximately 1000 ha randomly located across the forest regions, with an additional 28 flight lines with different coverage areas designed to collect lidar data over 104 ground inventory plots. The plot data were used to develop models for converting lidar measurements on forest structure into AGB, and to assess the uncertainty of the AGB map. The lidar-derived mean top canopy height was used to develop the lidar-AGB models.
There are eight data files provided with this dataset: seven files in GeoTIFF (.tif) format and one file in comma-separated (.csv) format. A companion file is also provided with supplementary information.
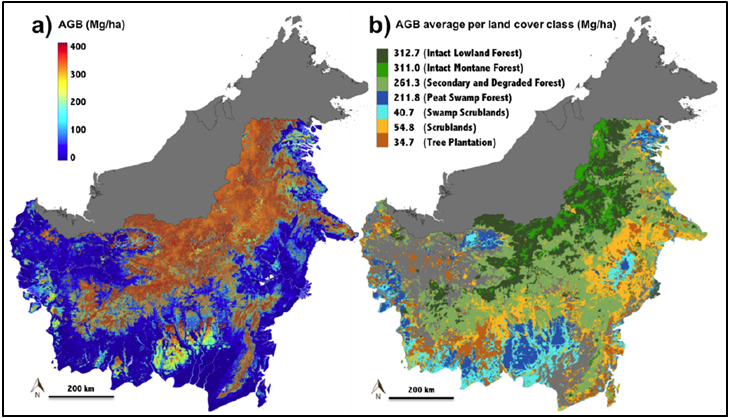
Figure 1. Aboveground biomass (AGB) density map of Kalimantan forests at 1-ha resolution (a) and mean AGB aggregated by land cover class (b) Land cover derived from the Indonesia Ministry of Forests map for the Indonesian portion of the Island of Borneo (Ferraz et al., 2018).
Citation
Ferraz, A., S.S. Saatchi, L. Xu, S. Hagen, J. Chave, Y. Yu, V. Meyer, M. Garcia, C. Silva, O. Roswintiarti, A. Samboko, P. Sist, S.M. Walker, T. Pearson, A. Wijaya, F.B. Sullivan, E. Rutishauser, D. Hoekman, and S. Ganguly. 2019. Aboveground Biomass, Landcover, and Degradation, Kalimantan Forests, Indonesia, 2014. ORNL DAAC, Oak Ridge, Tennessee, USA. https://doi.org/10.3334/ORNLDAAC/1645
Table of Contents
- Dataset Overview
- Data Characteristics
- Application and Derivation
- Quality Assessment
- Data Acquisition, Materials, and Methods
- Data Access
- References
Dataset Overview
This dataset provides estimates of aboveground biomass, percent canopy cover, mean canopy height, landcover, and forest degradation index products for forests in Kalimantan, Indonesia (Island of Borneo) representative of conditions in late 2014. Data were combined from several sources including field sampling, airborne lidar, satellite measurements, a forest-type land cover map, and integrated into a random forest algorithm to produce these estimates.
The goal of the study was to develop a wall-to-wall map of aboveground biomass (AGB) density in 1-ha grid cells for the forests in the Kalimantan region of Indonesia (on the island of Borneo). Land cover classes focused on intact lowland and montane forests, secondary and degraded forests, and peat swamp forest as well as estimates of other forest cover types present in the study domain. Airborne lidar sampling included 29 flight lines sampling approximately 1000 ha randomly located across the forest regions, with an additional 28 flight lines with different coverage areas designed to collect lidar data over 104 ground inventory plots. The plot data were used to develop models for converting lidar measurements on forest structure into AGB, and to assess the uncertainty of the AGB map. The lidar-derived mean top canopy height was used to develop the lidar-AGB models.
Project: Carbon Monitoring System
The NASA Carbon Monitoring System (CMS) is designed to make significant contributions in characterizing, quantifying, understanding, and predicting the evolution of global carbon sources and sinks through improved monitoring of carbon stocks and fluxes. The System will use the full range of NASA satellite observations and modeling/analysis capabilities to establish the accuracy, quantitative uncertainties, and utility of products for supporting national and international policy, regulatory, and management activities. CMS will maintain a global emphasis while providing finer scale regional information, utilizing space-based and surface-based data and will rapidly initiate generation and distribution of products both for user evaluation and to inform near-term policy development and planning.
Related Publication:
Ferraz, A., S. Saatchi, L. Xu, S. Hagen, J. Chave, Y. Yu, V. Meyer, M. Garcia, C. Silva, O. Roswintiart, A. Samboko, P. Sist, S. Walker, T.R.H. Pearson, A. Wijaya, F. Sullivan, E. Rutishauser, D. Hoekman, and S. Ganguly. 2018. Carbon Storage Potential in Degraded Forests of Kalimantan, Indonesia. Environ. Res. Lett.13, (2018) 095001. https://doi.org/10.1088/1748-9326/aad782
Related Datasets:
LiDAR data from this study:
Melendy, L., S. Hagen, F.B. Sullivan, T. Pearson, S.M. Walker, P. Ellis, Kustiyo, K.A. Sambodo, O. Roswintiarti, M. Hanson, A.W. Klassen, M.W. Palace, B.H. Braswell, G.M. Delgado, S.S. Saatchi, and A. Ferraz. 2017. CMS: LiDAR Data for Forested Sites on Borneo Island, Kalimantan, Indonesia, 2014. ORNL DAAC, Oak Ridge, Tennessee, USA. https://doi.org/10.3334/ORNLDAAC/1518
High-resolution (1-m) canopy height estimates from this study. These data were averaged to a 1-ha grid to create the current dataset.
Melendy, L., S. Hagen, F.B. Sullivan, T. Pearson, S.M. Walker, P. Ellis, Kustiyo, K.A. Sambodo, O. Roswintiarti, M. Hanson, A.W. Klassen, M.W. Palace, B.H. Braswell, G.M. Delgado, S.S. Saatchi, and A. Ferraz. 2017. CMS: LiDAR-derived Canopy Height, Elevation for Sites in Kalimantan, Indonesia, 2014. ORNL DAAC, Oak Ridge, Tennessee, USA. https://doi.org/10.3334/ORNLDAAC/1540
Acknowledgements
This research was funded under the NASA CMS project grant number NNX13AP88G
Data Characteristics
Spatial Coverage: Kalimantan region, Indonesia
Spatial Resolution: One-hectare grid cells
Temporal Coverage: Sampling was done from 2014-10-18 to 2014-11-30
Temporal Resolution: One time
Study Area (All latitudes and longitudes are given in decimal degrees)
| Site | Westernmost Longitude | Easternmost Longitude | Northernmost Latitude | Southernmost Latitude |
|---|---|---|---|---|
| Kalimantan, Indonesia | 108 | 120 | 8 | -5 |
Data File Information
There are seven data files containing maps of forest characteristics in GeoTIFF (.tif ) format with this dataset and one .csv file containing forest inventory plot data. There is also a companion file in .pdf format provided with supplementary information.
Table 1. File names and descriptions
| File name | Description |
|---|---|
| Kalimantan_Indonesia_field_inventory.csv | Data from field inventory plots used to calibrate the lidar-AGB model and independent plots for validation purposes |
| Kalimantan_canopy_height.tif | Lidar-derived mean top canopy height (m). The cells of the 1 ha grid are calculated by averaging the original 1 m canopy height model (CHM) |
| Kalimantan_aboveground_biomass.tif | Lidar-based AGB estimates from random and non-random samples, includes about 45.6 Mha out of the 54 Mha of the Kalimantan landscape, the remainder being crops/agriculture and urban/settlements |
| Kalimantan_percent_cover.tif | Estimated percent canopy cover computed by calculating the percentage of pixels of the original CHM that are higher than 5 meters within each 1-ha cell. |
| Kalimantan_large_crown_area.tif | Estimated percent large crown area: the area covered by large trees within each 1 ha grid cell. This area is estimated by applying the LCA (Large Crown Area) algorithm to the 1 m CHM |
| Kalimantan_degradation_index.tif | Forest degradation index (FDI), where lower values indicate more degraded forests. FDI calculated as mean crown height + large crown ratio + percent canopy cover. |
| Kalimantan_land_cover.tif | Land cover classification for the Kalimantan region |
| Kalimantan_aboveground_biomass_uncertainty.tif | The uncertainty associated with the estimation of the average AGB in each 1-ha cell |
| Companion file | |
| Kalimantan_Indonesia_supplementary.pdf | Supplementary research information in .pdf format (Ferraz et al., 2018). |
Table 2. Variables in the file Kalimantan_Indonesia_field_inventory.csv
Field inventory plots used to calibrate the lidar-AGB model and independent plots for validation purposes (study sites in the file denoted by *). These data were not collected during this study. They were from different sources and therefore the plots varied in size, shape and design. The data were captured from Table S11 (Ferraz et al., 2018) in the companion file Kalimantan_Indonesia_supplementary.pdf
| Variable | Units/format | Description |
|---|---|---|
| study_site | The location of individual plots within each field inventory site as defined by the studies from which they were acquired. Study sites with * in name are independent plots for validation purposes. | |
| plot_name | Plot name of individual plots within each field inventory site as defined by the studies from which they were acquired | |
| land_cover | D or W | Land cover of individual plots within each field inventory site. D and W = drylands and wetlands |
| size | ha | Plot size of individual plots within each field inventory site as defined by the studies from which they were acquired |
| shape | S, C, or R | Plot shape: S (squared), C (circular), and R (rectangular) corresponding to the shape of individual plots |
| sampling | Rand or Sys | AGB sampling method: Rand and Sys stand for random and systematic, respectively, and correspond to the strategy that was used to define the spatial distribution of the plots within the forest inventory site |
| scaling_factor | Yes or no | Used to estimate AGB |
| AGB | Mg/ha | AGB calculated normalizing the total AGB by the area of the plots. Two strategies were used |
| MCH_lidar | meters | MCH corresponds to the top of Mean Canopy Height that was derived from the lidar dataset |
GeoTIFF Files
Table 3. Attributes of the GeoTIFF files: Number of bands=1, Scaling=1, Projection: EPSG code = 4326, Resolution: 1 ha x 1 ha
| File name | Attribute | Units | Min-max values | No data value |
|---|---|---|---|---|
| Kalimantan_aboveground_biomass_uncertainty.tif | biomass uncertainty | Mg biomass/ha | 0-411.6 | -9999 |
| Kalimantan_aboveground_biomass.tif | biomass | Mg biomass/ha | 0-1098.2 | -9999 |
| Kalimantan_canopy_height.tif | mean canopy height/ha | meters | 0-55.626 | -9999 |
| Kalimantan_percent_cover.tif | % canopy >5 meters/ha | % | 0-100 | -9999 |
| Kalimantan_degradation_index.tif | FDI | unitless | 0-300 | -9999 |
| Kalimantan_land_cover.tif | Land cover class | Classes defined below | 1-11 | 255 |
| Kalimantan_large_crown_area.tif | % large crown area/ha | % | 0-100 | -9999 |
| Land Cover Classes for Kalimantan_land_cover.tif |
|---|
|
1 = Intact Lowland Forest 2 = Intact Montane Forest 3 = Secondary and Degraded Forest 4 = Peat Swamp Forest 5 = Mangrove Forest 6 = Swamp Scrublands 7 = Crops/Agriculture 8 = Tree Plantations 9 = Urban/Settlement 10 = Scrublands 11 = Inland Water |
Application and Derivation
The Kalimantan forests have been experiencing heavy logging and land-use conversion. This research was useful in quantifying the spatial extent and the carbon storage potential of the forests for conservation groups interested in achieving the national Sustainable Development Goals (SDGs) through carbon sequestration and government agencies making decisions regarding greenhouse gas mitigation.
Quality Assessment
The uncertainty associated with the estimation of the average AGB for a given region of interest (e.g. a forest type or administrative region) was estimated by propagating local- and pixel-level errors to the entire region taking into account the RF prediction errors and the spatial autocorrelation of errors (Chen et al., 2015). The uncertainty of the lidar-AGB model and the RF predictions were evaluated using a cross-validation bootstrapping approach by randomly selecting 70% of samples for modelling and 30% for validation.
The overall average pixel-level uncertainty is of 23.6 +/- 20.5 Mgha-1 and it varies within a narrow range (26.6-30.0 Mgha-1) depending on the target land cover class. The exception is the intact montane forest whose uncertainty is significantly higher (73.4 +/- 32.3 Mgha-1,) and it is the only forest type that has uncertainty higher than 25% for the mean AGB. See Ferraz et al., (2018) for more details.
Table 4. Average uncertainty of the AGB density map by land cover class derived from the IMF land cover map (SNI, 2016) ± standard deviation of the distribution.
| Land Cover | Uncertainty ± S.D. (Mgha-1) |
|---|---|
| Intact Lowland Forest | 30.0 ± 14.4 |
| Intact Montane Forest | 73.4 ± 32.3 |
| Secondary and Degraded Forest | 26.6 ± 12.5 |
| Peat Swamp Forest | 26.9 ± 21.1 |
| Swamp Scrublands | 9.12± 8.9 |
| Tree Plantations | 6.2 ± 4.6 |
| Scrublands | 12.2 ± 10.1 |
| Total | 23.6 ± 20.5 |
The uncertainty associated with the estimation of the average AGB was assessed for a given region of interest (ROI) such as a forest type or administrative region by propagating local- and pixel-level errors to the entire ROI taking into account spatial autocorrelation and covariance of errors.
Data Acquisition, Materials, and Methods
Site description
The study area was the forests of Kalimantan where extensive land use activities are on-going including logging, palm oil plantations, and peatland fires. The forests occur over diverse landscapes across edaphic and nutrient gradients extending from the old-growth drylands, hill and montane dipterocarp forests to fresh water and peat swamp forests including Alang-Alang, heath forests (Kerangas), mangroves, and Nypa palm dominated forests along the coastal regions (MacKinnon, 1997). The remaining forests of Kalimantan are divided into intact forests, mainly found on higher elevation and outside the reach of logging companies, a large extent of logged forests (with different intensities), and fragmented landscapes extending to wetlands, with agroforestry plantations, scrublands, and croplands.
Methods
Field inventory data, airborne lidar sampling, satellite measurements and a forest type land cover map were integrated into a random forest (RF) machine-learning algorithm to produce a wall-to-wall AGB density map over 1-ha grid cells. A probabilistic airborne lidar sampling approach was designed to capture the variation in forest structure in all remaining forests of Kalimantan. See Ferraz et al. (2018) for more details.
The samples included 29 flight lines of approximately 1000 ha (0.5 km X 20 km) randomly located across the forest regions. An additional 28 flight lines with different coverage areas were designed to collect lidar data over ground inventory plots and to extend the survey of forest structure between the samples. The total airborne lidar data collected for this study covered about 111,000 ha with 66,439 ha over drylands and 44,250 ha over wetlands. All satellite and airborne data were resampled to a spatial grid of 1-ha spatial resolution.
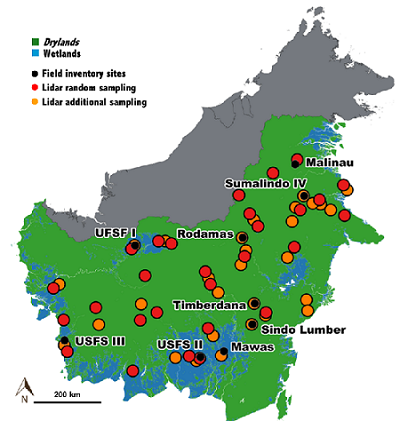
Figure 2. Boundary of Kalimantan within the Island of Borneo showing the vegetation types of drylands and wetlands with the location of field inventory and ALS transects. From Ferraz et al., (2018).
Field inventory
The field inventory was comprised of 104 plots from various sources (82 in drylands and 22 in wetlands). The location of the field inventory sites were defined by the different sources and do not follow any probabilistic design, with sizes varying from 0.1-ha to 0.25-ha. Plot data were used to develop models for converting lidar measurements into AGB, and to assess the uncertainty of the AGB map. The plots cover a range of biomass from about 100 Mg/ha in severely degraded forest to about 960 Mg/ha in intact drylands. In general, drylands forests have a higher spatial variability than peat swamp forest and are sampled using larger plots compared with wetlands.
Two different strategies were used to calculate plot-level AGB. Over the inventory plots where the bole diameter was measured for all trees (d>10 cm), the AGB was estimated at the tree level and the resulting values were summed up to the plot level. Otherwise, the plot-level AGB was estimated using a sub-sampling of all trees within the plots and the total AGB was extrapolated to the plot level using a scaling factor.
Land cover map
The Indonesian Ministry of Forestry (IMF) land cover map was calculated by the ministry of forestry using visual interpretation of Landsat images (SNI 2016). The original 26 land cover classes from IMF were aggregated into nine classes. The non-forest classes (ie crops/agriculture and urban/settlement) were not considered in this work for AGB estimation purposes. Intact montane forest refers to intact forest above 1000 meters asl (above sea level). The IMF map was used as a predictor layer within the RF algorithm, to compute the drylands/wetlands mask which allowed for the defining of the lidar-AGB models specific oriented to the vegetation type and was also used to analyze the results, allowing the aggregation of the wall-to-wall AGB map results by land cover class.
Aboveground biomass
This study was focused on the land cover classes of intact lowland and montane forests, secondary and degraded forests, and peat swamp forest over which there was reliable field and lidar inventory data to calibrate the models. Estimates of other forest cover types present in the study domain were also included such as swamp scrublands, scrublands, and tree plantations. The AGB reporting, therefore, includes about 45.6 Mha out of the 54 Mha of the Kalimantan landscape, the remainder being crops/agriculture and urban/settlements. The lidar-derived mean top canopy height (MCH), calculated by averaging the canopy height model (CHM) pixels located within a given forest plot, was used to develop the lidar-AGB models:
AGB = the scaling factor . MCHthe power-law exponent + the uncertainty in measurements.
Two distinct lidar-AGB models for drylands and wetlands forests were developed to account for clear distinctions in tree density and structure between the two ecosystems. All lidar-based AGB estimates from both random and nonrandom samples were used to train the RF algorithm. The RF algorithm used satellite imagery including surface reflectance from Landsat-8, ALOS PALSAR (L-band Radar) and Sentinel-1 (C-band Radar), terrain characteristics from SRTM data and a land cover map.
Mean top canopy height, canopy cover, and large crown area
For MCH the cells of the 1-ha grid were calculated by averaging the original 1-m CHM. The percent canopy cover (PC) was computed by calculating the percentage of pixels of the original CHM that were higher than five meters within each 1-ha cell. The large crown area (LCA) is the area covered by large trees within each 1-ha grid cell. This area was estimated by applying the LCA algorithm to the 1-m CHM. Briefly, the LCA sets a threshold of 27 m on the 1-m CHM to derive a binary image representing the areas covered by high vegetation. Then, it applies a connected component segmentation (with an 8-neighborhood pixel connectivity) to compute clusters of pixels by gathering together all the neighbor’s pixels. Finally, the clusters composed of less than 100 pixels (i.e. 100 m2) are removed. Therefore, the LCA technique provides a binary image at 1-m resolution that is resampled to a 1-ha grid representing the percentage of area covered by large trees.
Forest Degradation Index (FDI)
Kalimantan has been impacted by wood extraction activities that include illegal logging, selective logging, and harvesting. A wall-to-wall map of a forest degradation index (1-ha resolution) was developed that allows spatially-explicit information to be derived on the intensity of logging activities and their impact on AGB density across Kalimantan landscape. To do this, the Forest Degradation Index (FDI) was defined as
FDI = top of mean canopy height + large crown trees percentage + percentage cover
The top of mean canopy height has been normalized between 0-100 so that the FDI ranges between 0-300.
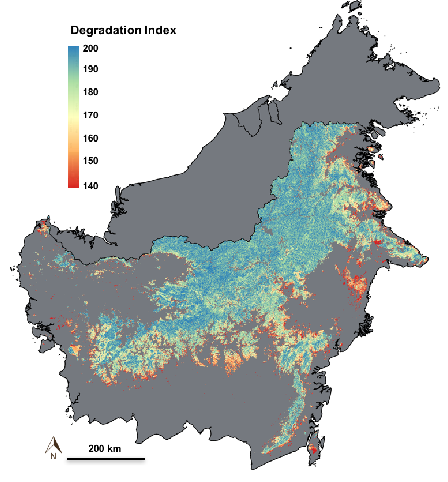
Figure 3. Forest Degradation Index (FDI) map.
The Kalimantan_degradation_index.tif is an index of degradation severity than can be used to define some user-defined classes such as: intact forest (FDI>255), light degraded forest (235<FDI<=255), moderate degraded forest (210<FDI<=235), high degraded forest (150<DI<=210) and severe degraded forest (FDI<=150) (Ferraz et al., 2018).
Data Access
These data are available through the Oak Ridge National Laboratory (ORNL) Distributed Active Archive Center (DAAC).
Aboveground Biomass, Landcover, and Degradation, Kalimantan Forests, Indonesia, 2014
Contact for Data Center Access Information:
- E-mail: uso@daac.ornl.gov
- Telephone: +1 (865) 241-3952
References
Chen, Q., G.V. Laurin, and R. Valentini, 2015. Uncertainty of remotely sensed aboveground biomass over an African tropical forest: Propagating errors from trees to plots to pixels. Remote Sens. Environ. 160, 134–143. https://doi.org/10.1016/j.rse.2015.01.009
Ferraz, A., S. Saatchi, L. Xu, S. Hagen, J. Chave, Y. Yu, V. Meyer, M. Garcia, C. Silva, O. Roswintiart, A. Samboko, P. Sist, S. Walker, T.R.H. Pearson, A. Wijaya, F. Sullivan, E. Rutishauser, D. Hoekman, and S. Ganguly. 2018. Carbon Storage Potential in Degraded Forests of Kalimantan, Indonesia. Environ. Res. Lett.13, (2018) 095001. https://doi.org/10.1088/1748-9326/aad782
MacKinnon K, Hatta G, Halim H and Mangalik A. 1997. The Ecology of Kalimantan (Singapore: Oxford University Press) ISBN: 9780945971733
SNI 2016 Klasifikasi Penutup Lahan (Land Cover Classification) http://www.big.go.id/assets/download/sni/SNI/15.%20SNI%207645-2010%20Klasifikasi%20penutup%20lahan.pdf