Documentation Revision Date: 2019-11-11
Dataset Version: 1
Summary
For each of the 612 reported flight lines, there are two data files in GeoTIFF format: First, the quantified CH4 enhancement above background (plumes) given in units of parts per million meters (ppm x m); and Second, a 3-band GeoTIFF with radiance values for red, green, and blue visible wavelengths in microwatts per nanometer per steradian per centimeter squared (uW nm-1 sr-1 cm-2). The same data are also provided as 612 ENVI binary rasters (4 bands: R, G, B, CH4), stored in zipped tarfiles with a required header file, for use in the ENVI image processing software suite. There are a total of 1,224 GeoTIFF files (two per flight line) and 612 ENVI binary rasters (one per flight line).
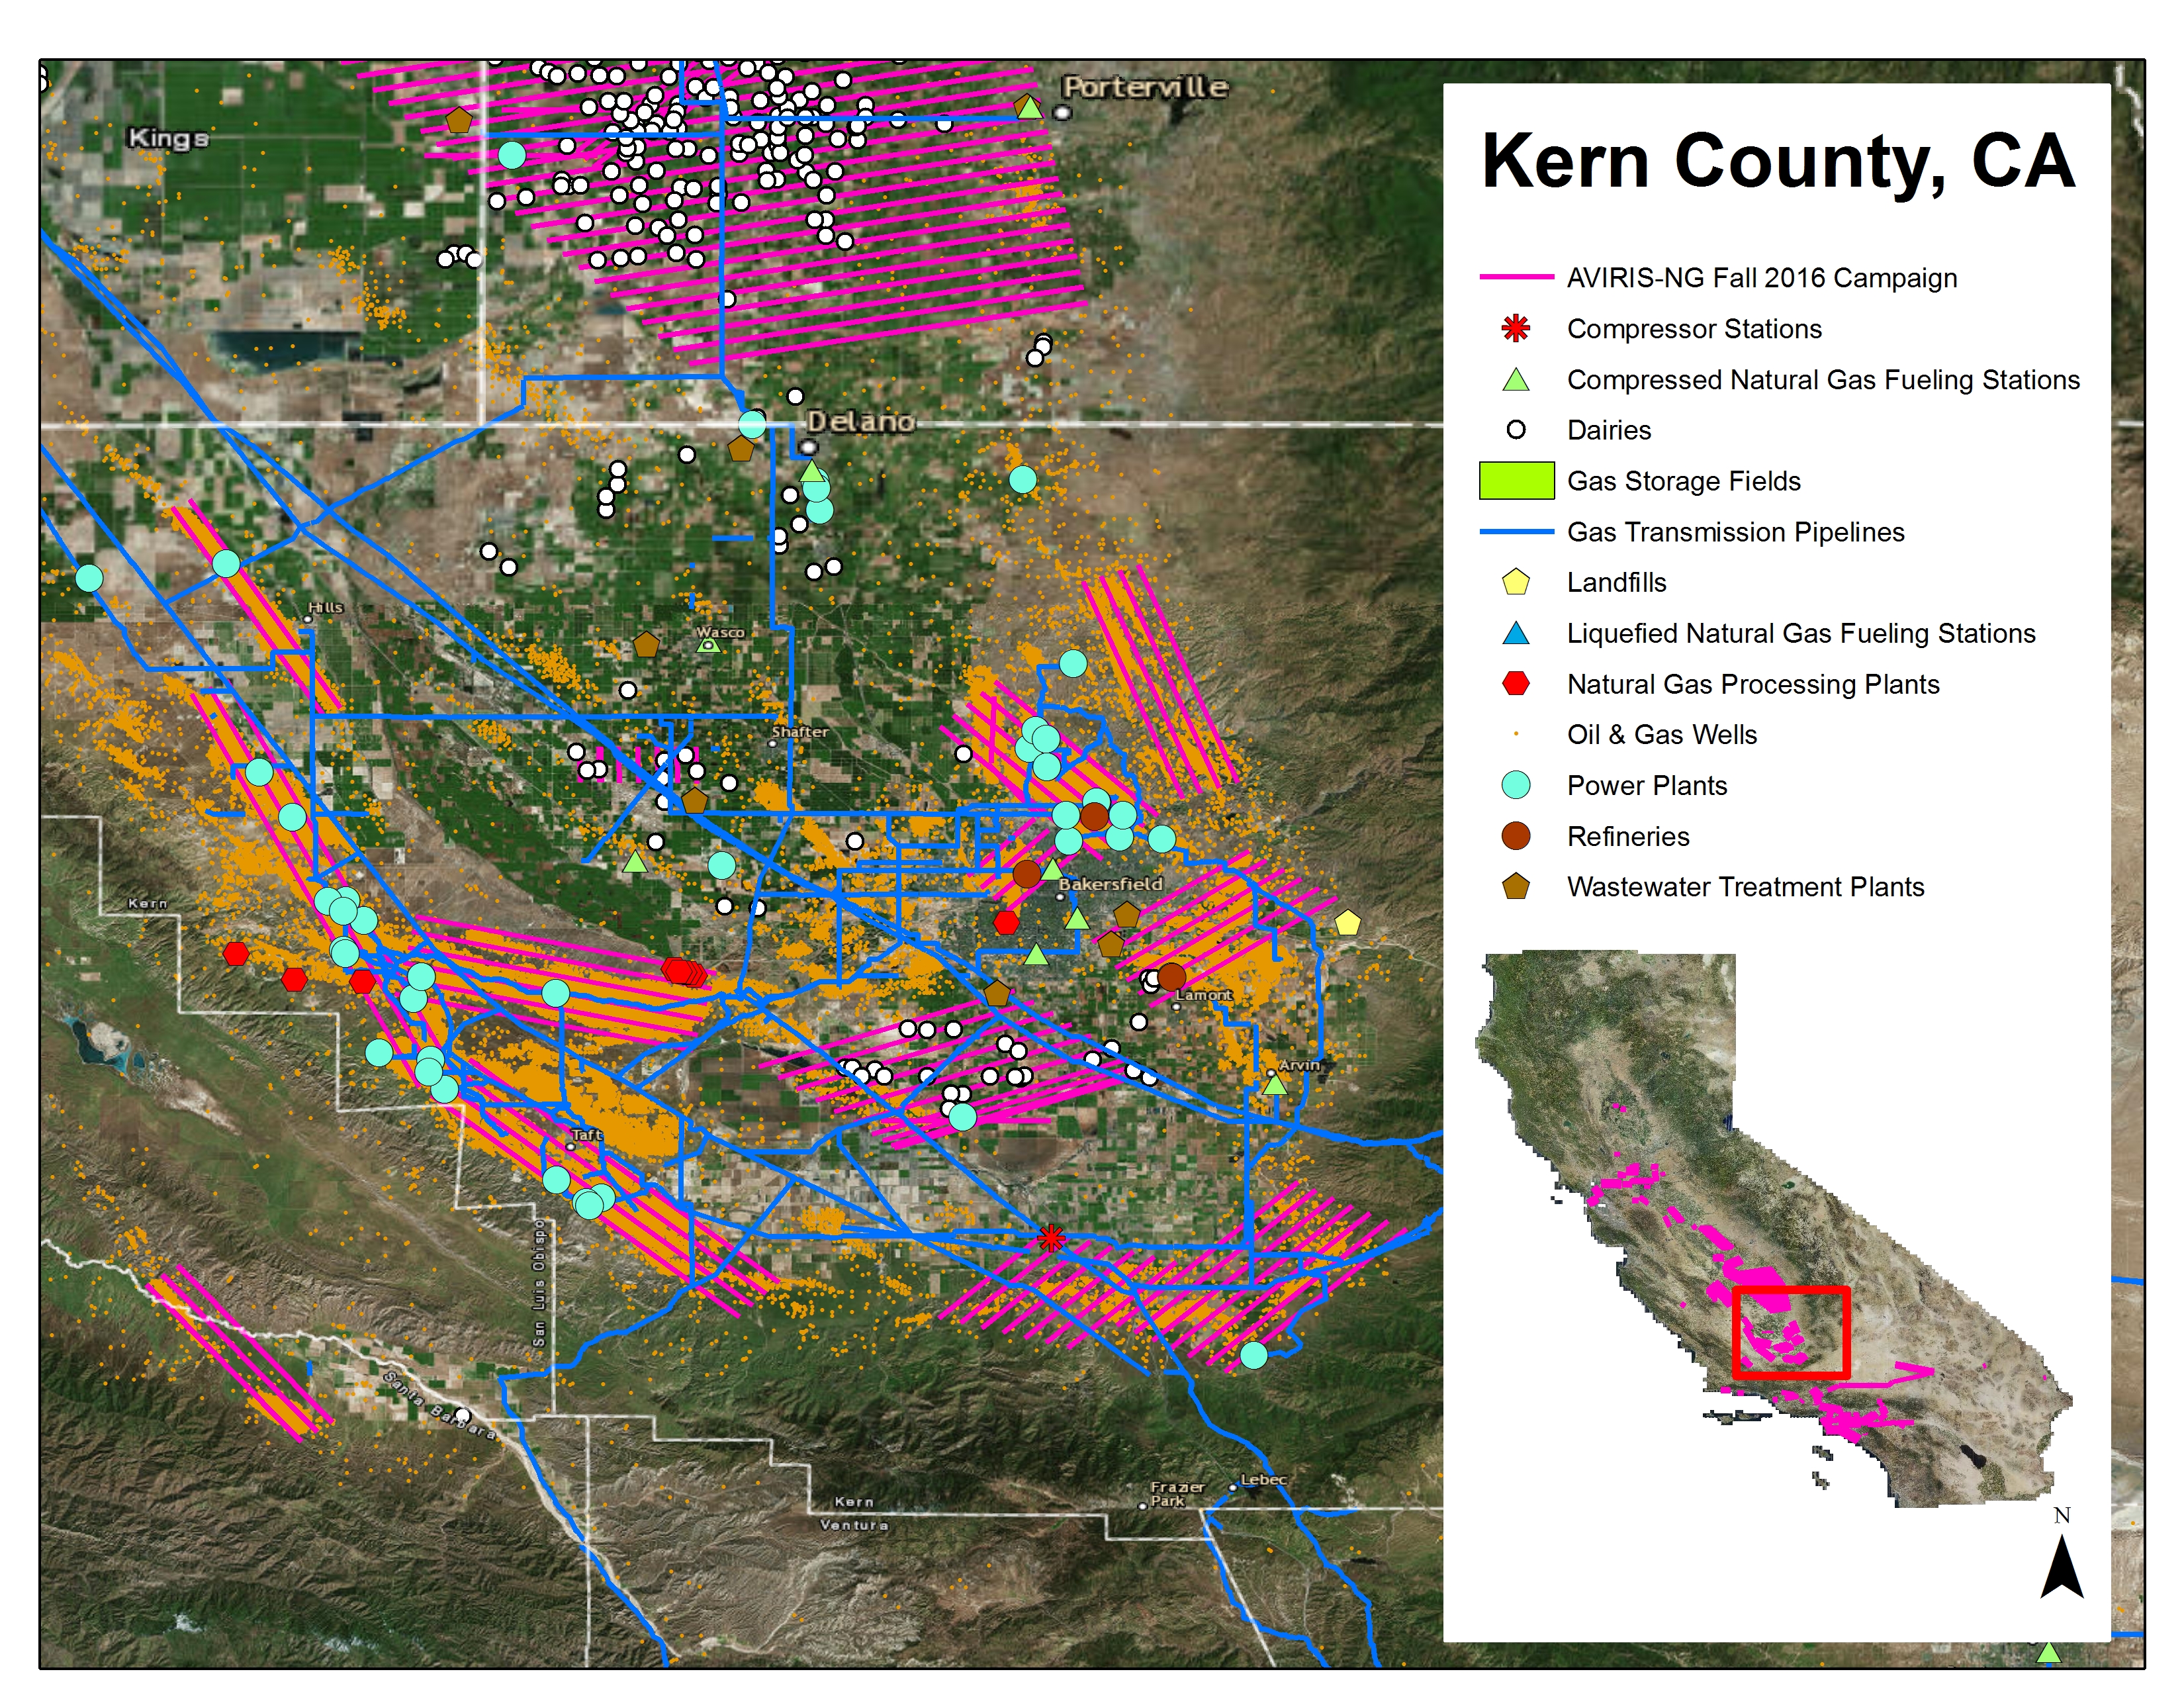
Figure 1. Example of AVIRIS-NG flight lines over the southern San Joaquin Valley, Kern County, CA, in Fall 2016 and displaying the Vista-CA potential methane emitting facilities and infrastructure for the three primary sectors (energy, agriculture, and waste). Source: Duren et al. (2019)
Citation
Thorpe, A.K., B.D. Bue, D.R. Thompson, and R.M. Duren. 2019. Methane Plumes Derived from AVIRIS-NG over Point Sources across California, 2016-2017. ORNL DAAC, Oak Ridge, Tennessee, USA. https://doi.org/10.3334/ORNLDAAC/1727
Table of Contents
- Dataset Overview
- Data Characteristics
- Application and Derivation
- Quality Assessment
- Data Acquisition, Materials, and Methods
- Data Access
- References
Dataset Overview
This dataset provides maps of methane (CH4) plumes along flight lines over identified methane point-source emitting infrastructure across the State of California, USA collected during 2016 and 2017. Methane plume locations were derived from Next-Generation Airborne Visible Infrared Imaging Spectrometer (AVIRIS-NG) overflights during the California Methane Survey. The survey was designed to cover at least 60% of the methane point source infrastructure in California guided by the Vista-CA dataset of identified locations of potential methane emitting facilities and infrastructure in three primary sectors (energy, agriculture, and waste). The purpose of the survey was to detect, quantify, and attribute point source emissions to specific infrastructure elements to improve the scientific understanding of regional methane budgets and to inform policy and planning activities that reduce methane emissions.
Project: Carbon Monitoring System (CMS)
The NASA Carbon Monitoring System (CMS) is designed to make significant contributions in characterizing, quantifying, understanding, and predicting the evolution of global carbon sources and sinks through improved monitoring of carbon stocks and fluxes. The System will use the full range of NASA satellite observations and modeling/analysis capabilities to establish the accuracy, quantitative uncertainties, and utility of products for supporting national and international policy, regulatory, and management activities. CMS will maintain a global emphasis while providing finer scale regional information, utilizing space-based and surface-based data and will rapidly initiate generation and distribution of products both for user evaluation and to inform near-term policy development and planning.
Related Publication:
Duren, R. M., Thorpe, A. K., Foster, K.T., Rafiq, T. , Hopkins, F. M. Yadav, V., Bue, B. D., Thompson, D. R., Conley, S., Colombi, N.K., Frankenberg, C., McCubbin, I. B., Eastwood, M. L., Falk, M., Herner, J. D., Croes, B. E., Green, R. O., Miller, C. E. 2019. California’s Methane Super-Emitters. Nature 575, 180–184 (2019) https://doi.org/10.1038/s41586-019-1720-3
Related Dataset:
Hopkins, F.M., T. Rafiq, and R.M. Duren. 2019. Sources of Methane Emissions (Vista-CA), State of California, USA. ORNL DAAC, Oak Ridge, Tennessee, USA. https://doi.org/10.3334/ORNLDAAC/1726
Acknowledgements:
This dataset was compiled with support of the NASA Carbon Monitoring System Grant: NNN12AA01C
Data Characteristics
Spatial Coverage: California, USA
Spatial Resolution: Flight lines were typically not on a formal grid pattern but focused on point-source features. Along a flight line, on average, AVIRIS-NG has a 1.8 km field of view and 3 m pixel resolution at typical survey altitudes of 3 km.
Temporal Coverage: 20160910 to 20171113
Temporal Resolution: One time overflight of each area.
Study Area (All latitude and longitude given in decimal degrees)
|
Site |
Westernmost Longitude |
Easternmost Longitude |
Northernmost Latitude |
Southernmost Latitude |
|---|---|---|---|---|
|
California |
-125.77148 |
-113.73047 |
42.51058 |
32.34980 |
Data File Information:
There are 1,224 GeoTIFF files (two per flightline) and 612 ENVI binary rasters (one per flightline, compressed as *.tar.gz files) included in this dataset. The same data are provided in each file format.
GeoTIFF Files:
The GeoTIFF files include two data files for each of the 612 reported flight lines.
- 'ch4' files provide the quantified CH4 enhancement above background (plumes), given in units of parts per million meters (ppm x m)
- 'rgb' files provide radiance values for red, green, and blue visible wavelengths in microwatts per nanometer per steradian per centimeter squared (uW nm-1 sr-1 cm-2). These files have three bands, one for red, green, and blue.
Spatial Reference: EPSG: 32610 or 32611 (UTM N10 or N11)
Naming Convention:
File name syntax: angYYYYMMDDtHHMMSS_cmf_pub_datatype.tif
Where:
ang = standard AVIRIS-NG file prefix
YYYMMDDtHHMMSS = date and UTC time of the beginning of a flight line
cmf_pub = references used internally by project investigators
datatype = ch4 (CH4 enhancement relative to background) or rgb (red, green, and blue radiance)
Example GeoTIFF file names for the flight on 20160910 at 18:57:02
ang20160910t185702_cmf_pub_ch4.tif (CH4 plumes)
ang20160910t185702_cmf_pub_rgb.tif (RGB reflectance)
ENVI Format Files:
The same data are also provided as 612 ENVI binary rasters (containing 4 bands: R, G, B, CH4) for use in the ENVI image processing software suite. These data are distributed as zipped tarfiles (*.tar.gz) organized by flight line.
ENVI files spatial reference: EPSG: 32610 or 32611 (UTM N10 or N11)
Naming Convention:
File name syntax: angYYYYMMDDtHHMMSS_cmf_pub_img.tar.gz
Where:
ang = standard AVIRIS-NG file prefix
YYYMMDDtHHMMSS = date and UTC time of the beginning of a flight line
cmf_pub = references used internally by project investigators
Example ENVI file names:
ang20171113t215730_cmf_pub_img.tar.gz (flight line on 20171113 at 21:57:30)
ang20160910t191651_cmf_pub_img.tar.gz (flight line on 20160910 at 19:16:51)
Inside each tar.gz file, there are two files:
- Imaging spectrometer data with a filename suffix *_img. These are binary files representing the methane image data, with four channels:
- Radiance in visible red wavelengths, given in units of microwatts per nanometer per steradian per centimeter squared (uW nm-1 sr-1 cm-2).
- Radiance in visible green wavelengths
- Radiance in visible blue wavelengths
- Estimated CH4 enhancement above background, given in units of parts per million meters (ppm x m)
- A header file that provides metadata, with a filename suffix *_img.hdr. This file provides an ASCII human-readable header in ENVI format describing the specific dimensioning and layout of the flight line, and embedded geographic projection information. Please consult the table at the following link for descriptions of the metadata given in the ENVI header files: http://www.harrisgeospatial.com/docs/ENVIHeaderFiles.html
Data Center Processing:
Data were received as 612 binary raster (no extension) + header (.hdr) pairs in ENVI format that correspond to 612 AVIRIS-NG flight lines. Each raster had four bands: bands 1-3 = red/green/blue radiance (uW nm-1 sr-1 cm-2; microwatts per nanometer per steradian per centimeter squared - standard units for radiance in remote sensing), and band 4 = estimated CH4 enhancement relative to background in parts per million meters (ppm x m). The ORNL DAAC separated each flight line into two GeoTIFFs: a) 3-band red/green/blue radiance, and b) 1-band CH4 enhancement.
Application and Derivation
The purpose of the survey was to detect, quantify, and attribute point source emissions to specific infrastructure elements to improve the scientific understanding of regional methane budgets and to inform policy and planning activities that reduce methane emissions. See Duren et al. (2019) for details.
Quality Assessment
Uncertainties are not provided within the dataset. However uncertainty has been incorporated into the analysis presented in the associated paper. See Duren et al. (2019) for details. Below is an excerpt describing the the validation of methane emissions.
Methane mixing ratio length retrievals are based on AVIRIS-NG absorption spectroscopy between 2,100 and 2,500 nm. For each retrieved methane plume an integrated methane enhancement (IME) and plume length are estimated and combined with reanalysis wind fields to calculate emission fluxes and uncertainties. Our emission estimation method was validated by simultaneous overflights of 12 representative facilities with a second aircraft employing independent, in-situ measurements and a mass balance estimation method that quantifies facility-level methane emissions. The results indicate good agreement between these methods. The mass balance method is able to measure the net emissions from each sampled area including the combined contributions of area sources and point sources whereas the AVIRIS-NG method is only sensitive to point sources. This likely explains the general tendency of lower emissions observed using the AVIRIS-NG method, particularly for large distributed facilities such as landfills.
Data Acquisition, Materials, and Methods
Survey design and infrastructure data
The California Methane Survey was conducted with the Next Generation Airborne Visible/Infrared Imaging Spectrometer (AVIRIS-NG). AVIRIS-NG measures ground-reflected solar radiation from 380 to 2,510 nm with 5 nm spectral sampling and has a 1.8 km field of view and 3 m pixel resolution at typical survey altitudes of 3 km. The methane retrieval is based on absorption spectroscopy and can reliably detect and quantify methane point sources with emissions typically as small as 2-10 kg CH4 h-1 for typical surface winds <= 5 m s-1, depending on surface brightness and aircraft altitude and ground speed.
AVIRIS-NG flights reported in this dataset were conducted during five campaigns: August – November 2016, March 2017, June 2017, and August-November 2017. The survey was designed to cover at least 60% of methane point source infrastructure in California guided by the Vista-CA that maps of over 450,000 potential methane emitting infrastructure elements across the State of California. Vista-CA follows the frameworks used by the State of California’s Greenhouse Gas Inventory and the Intergovernmental Panel on Climate Change (IPCC) Guidelines for greenhouse gas reporting.
Analysis workflow
The analysis for this study (Figure 2) consists of a) standard processing including calibration and orthorectification of the AVIRIS-NG image cube data, b) retrieval of CH4 column mixing ratio-lengths and generation of CH4 plume maps, c) quality control and filtering of plumes, d) geolocation and attribution of CH4 plumes to Vista-CA spatial layers, e) calculation of integrated methane enhancement (IME) and length for each plume, f) acquisition and processing of High Resolution Rapid Refresh (HRRR) reanalysis wind fields, g) emission flux estimation and uncertainty quantification for individual methane plumes, h) filtering and removal of plumes with sub-optimal shapes, are redundant/overlapping with others plumes or have excessive errors in IME and/or wind speed estimates, i) validating emission estimates with independent methods, j) averaging and scaling plume emission estimates with observed persistence to derive an annual net emission for each source, k) applying Vista-CA spatial layers to calculate net emission estimates for facilities and key sectors statewide, l) apply bootstrap analysis to determine confidence intervals for each sector and total population.
Only the steps for methane retrieval and plume detection are briefly described to provide context for the provided data products. Please refer to Duren et al. (2019) for complete details.
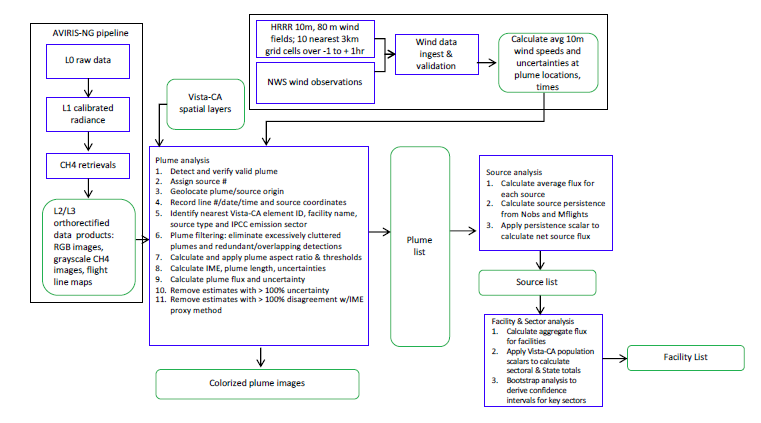
Figure 2. Analysis workflow for this study from Duren et al. (2019).
Standard image processing and methane retrievals
The AVIRIS-NG standard data system acquires “level 0” raw image data cubes from the instrument and delivers calibrated and orthorectified radiances to be analyzed for atmospheric methane. The CH4 retrieval is based on absorption spectroscopy between 2,100 and 2,500 nm and uses a linearized matched filter to estimate ‘alpha’, a mixing ratio length that represents a methane enhancement in parts per million per meter (ppm-m). The retrieved quantity is equivalent to an excess methane concentration (or mixing ratio) in ppm if the layer is one meter thick (i.e. directly equivalent to ppb km). At a scale height of about 8 km, the total column averaged excess mixing ratio would be about 0.000125 times the excess in ppm-m. For example, 1000 ppm-m is equivalent to a column enhancement of 125 ppb.
Plume detection, location and attribution
The AVIRIS-NG data products provided include the as-flown nadir flight-line tracks as well as the native Red, Green, Blue (RGB) images of surface features and grayscale images of retrieved methane along each flight line. Human analysts analyze the grayscale methane images to detect and geolocate plumes. An experimental machine learning system – a convolutional neural network- was also trained on a subset of plumes from this and other field studies and then used to assess potential false positives and false negatives in the manual plume list. The origin of each plume – i.e., the emission source - is estimated based on plume shape and enhancement values.
Quality control analysis is performed on every observed plume, including visual inspection to evaluate plume shape, presence of noisy retrieval results, instrument artifacts, correlation of plume direction with surface wind direction (for single and multiple detections), and plume proximity to known surface infrastructure (attribution). For the latter step, we apply the instrument RGB imagery and higher resolution satellite imagery as well as our Vista-CA inventory. Confidence in the source location and attribution to infrastructure increases in cases where plumes are repeatedly detected over multiple flights.
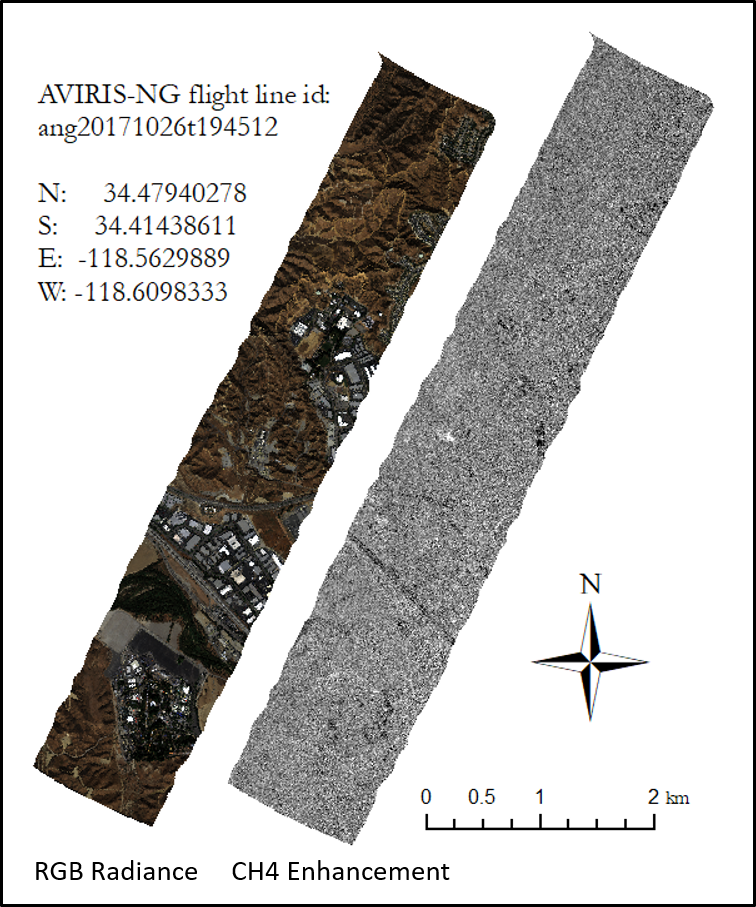
Figure 3. Red, green, and blue composite AVIRIS-NG images showing surface features for this overflight and the corresponding CH4 Enhancement image. Small white area near center is a detected plume. Sources: ang20171026t194512 _cmf_pub_rgb.tif and ang20171026t194512 _cmf_pub_ch4.tif
Data Access
These data are available through the Oak Ridge National Laboratory (ORNL) Distributed Active Archive Center (DAAC).
Methane Plumes Derived from AVIRIS-NG over Point Sources across California, 2016-2017
Contact for Data Center Access Information:
- E-mail: uso@daac.ornl.gov
- Telephone: +1 (865) 241-3952
References
Duren, R. M., Thorpe, A. K., Foster, K.T., Rafiq, T. , Hopkins, F. M. Yadav, V., Bue, B. D., Thompson, D. R., Conley, S., Colombi, N.K., Frankenberg, C., McCubbin, I. B., Eastwood, M. L., Falk, M., Herner, J. D., Croes, B. E., Green, R. O., Miller, C. E. 2019. California’s Methane Super-Emitters. Nature 575, 180–184 (2019) https://doi.org/10.1038/s41586-019-1720-3