Documentation Revision Date: 2022-09-22
Dataset Version: 1
Summary
There are two data files in shapefile (.shp) format with this dataset.
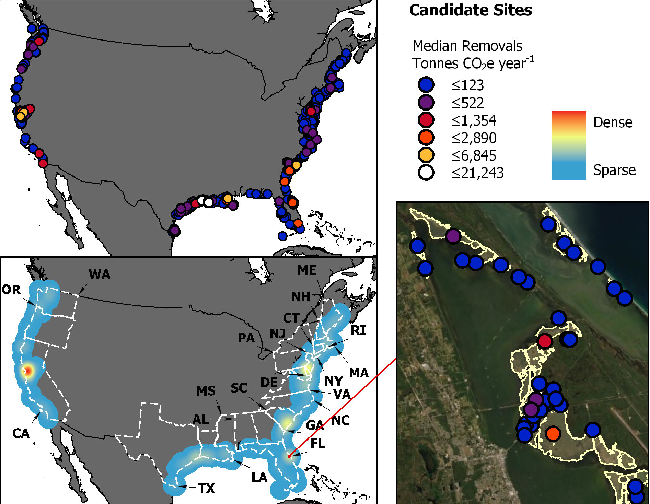
Figure 1. Top: map of the contiguous United States showing the locations of high-value restoration sites- large, continuous, and dominated by highly-likely net-cooling current and reference land cover types. It also shows that smaller potential restoration sites are widespread and well distributed across all three U.S. coasts. Bottom map shows hot spots of restoration activity in the San Francisco Bay Area of California, Texas and Louisiana, the Florida Atlantic Coast, South Carolina and the Delaware Bay region including New Jersey and Delaware. Lower right panel shows a zoom in on the Florida Atlantic Coasts with boundaries of restorable parcels shown in bright yellow.
Citation
Holmquist, J.R., M. Eagle, R.L. Molinari, S. Nick, L.C. Stachowicz, and K. Kroeger. 2022. Blue Carbon-based Natural Climate Solutions, Priority Maps for the U.S., 2006-2011. ORNL DAAC, Oak Ridge, Tennessee, USA. https://doi.org/10.3334/ORNLDAAC/2091
Table of Contents
- Dataset Overview
- Data Characteristics
- Application and Derivation
- Quality Assessment
- Data Acquisition, Materials, and Methods
- Data Access
- References
Dataset Overview
This dataset contains shapefiles showing location of tidal wetland parcels with the potential for net greenhouse gas removal if restored from current mapped condition to unimpeded tidal wetlands. These maps focus on managed lands in the contiguous United States along the ocean coasts and show impounded wetlands where reconnecting tidal flow could diminish methane production. The maps include current dominant wetland type, restoration category (Table 2), potential removal of atmospheric greenhouse gases in units of mass carbon dioxide with estimates of uncertainty.
Project: Carbon Monitoring System (CMS)
The NASA Carbon Monitoring System (CMS) program is designed to make significant contributions in characterizing, quantifying, understanding, and predicting the evolution of global carbon sources and sinks through improved monitoring of carbon stocks and fluxes. The System uses NASA satellite observations and modeling/analysis capabilities to establish the accuracy, quantitative uncertainties, and utility of products for supporting national and international policy, regulatory, and management activities. CMS data products are designed to inform near-term policy development and planning.
Related Publication
Holmquist, J.R., M. Eagle, R.L. Molinari, S. Nick, L.C. Stachowicz, and K.D. Kroeger. 2022. Mapping blue carbon-based natural climate solutions for the United States. In process, 2022.
Related dataset
Holmquist, J.R., and L. Windham-Myers. 2021. Relative Tidal Marsh Elevation Maps with Uncertainty for Conterminous USA, 2010. ORNL DAAC, Oak Ridge, Tennessee, USA. https://doi.org/10.3334/ORNLDAAC/1844
- This dataset served as input data for the analysis.
Acknowledgement
This dataset was funded by NASA's Carbon Monitoring System program, grant 80NSSC20K0084.
Data Characteristics
Study area: Coastal areas of the contiguous United States
Spatial resolution: 30 m
Temporal Coverage: 2006-01-01 to 2011-12-31
Temporal Resolution: one-time estimate
Study Area: All latitudes and longitudes given in decimal degrees.
| Site | Westernmost Longitude | Easternmost Longitude | Northernmost Latitude | Southernmost Latitude |
|---|---|---|---|---|
| contiguous U.S. | -127.601 | -65.727 | 51.307 | 22.937 |
Data File Information
There are two data files in shapefile (.shp) format with this dataset included as compressed ZIP archives.
Coastal_Blue_Carbon_Candidate_Restoration_Sites.shp - A shapefile of 1,795 parcels across coastal regions of the contiguous United States.
Coastal_Blue_Carbon_Candidate_Restoration_Points.shp - A shapefile, same as above, but with polygon centroids rather than polygon boundaries.
Table 1. Attributes in the shapefiles.
| Attribute | Units | Description |
|---|---|---|
| FID | integer | Field identifier. A unique integer for each site. |
| State | State. A two- character abbreviation indicating which United States state or states the restoration candidate parcel intersects. | |
| Locl_nm | Local name. The local name of the management entity the restoration candidate parcel intersects according to the U.S. Geological Survey's Protected Areas Database. | |
| Lcl_mng | Local manager. The local name of the manager of the restoration candidate parcel intersects according to the U.S. Geological Survey's Protected Areas Database. | |
| Mngr_nm | Manager name. The federal-level name of the manager of the restoration candidate parcel intersects according to the U.S. Geological Survey's Protected Areas Database. | |
| Mngr_ty | Manager type. The type of manager of the restoration candidate parcel according to the U.S. Geological Survey's Protected Areas Database: Types: "Federal", "State", "Local Government", "Non-governmental Organization", "Regional Agency Special District", "Private", or a combination of these types. |
|
| Lat_dd | degrees north | Latitude in decimal degrees. |
| Lon_dd | degrees east | Longitude in decimal degrees. |
| Dom_Rest | Dominant restoration category. The dominant type of restoration category for the parcel according to current status and wetland salinity. Types: "impounded estuarine to estuarine", "impounded palustrine to palustrine", "impounded open water to palustrine", "impounded open water to estuarine", "impounded palustrine to estuarine", "drained agricultural to estuarine", "drained bare to estuarine", "drained grass to estuarine", "drained forest to estuarine". |
|
| Area_ha | ha | Area of the restoration parcel in hectares. |
| M_TCO2e | 103 kg | Median removal of greenhouse gases in metric tons of carbon dioxide equivalent. |
| L_TCO2e | 103 kg | Lower bound of 95% credible interval for estimated removal of greenhouse gases in metric tons of carbon dioxide equivalent. |
| H_TCO2e | 103 kg | Upper bound of 95% credible interval for estimated removal of greenhouse gases in metric tons of carbon dioxide equivalent. |
Application and Derivation
These data could be useful in climate change studies, development of climate change policies, and local decisions for management of coastal ecosystems.
Quality Assessment
Uncertainty in total emissions and greenhouse gas removal by parcel was estimated using Monte Carlo analysis. Values presented herein are estimates of mean net greenhouse gas removals resulting from a successful restoration weighted by the probability that restoration is successful. Weighted emissions factors were applied at the pixel level along with the upper and lower 95% confidence intervals.
Covariance between adjacent pixels was not estimated and assumed to be high. Errors were treated as additive when aggregating from pixels to parcels. The accuracy of identifying impoundments from the National Wetlands Inventory was conducted separately. While these data may underestimate the prevalence of impoundments by 50%, the included impoundments are mapped with high accuracy (88.4%).
See Holmquist et al. (2022) for more information.
Data Acquisition, Materials, and Methods
Coastal wetland restoration has the potential to draw carbon dioxide (CO2) out of the atmosphere as well as avoid methane (CH4) emissions. Various types of 'Blue carbon' strategies are part of a larger effort to use natural and working lands to mitigate climate change while at the same time improving ecosystem functioning and quality. Coastal states in the U.S. have expressed interest in using Blue Carbon Natural Climate Solutions (NCSs), as a part of their greenhouse gas emission reduction planning. However, no map currently exists that shows potential restorations or ranks them based on their likelihood to act as a net-sink of greenhouse gasses.
This project sought to identify potentially restorable wetland features, such as impoundments and low-elevation drained land, already occurring on protected areas and to estimate their potential for net removal of greenhouse gases. Restoration would involve converting features having high rates of methane emissions to intertidal wetlands having lower rates of emissions and higher rates of carbon capture. High priority areas are those with potential for an annual net removal of 1 metric ton of CO2-equivalent of greenhouse gases.
Identifying Potential Restoration Sites
The first step involved building a map of impounded wetlands, water bodies, and terrestrial land cover types restorable to tidal wetland conditions. Three data sources were used: National Wetlands Inventory (NWI) (USFWS, 2014), the Coastal Change Analysis Program (C-CAP) (NOAA, 2014), and a probabilistic coastal lands map (Holmquist and Windham-Myers, 2021). All NWI polygons classified as intertidal or tidal impoundments were included. Polygons classified as freshwater emergent or freshwater scrub/shrub were included if they intersected the probabilistic coastal lands map. Freshwater lakes and ponds adjacent to intertidal areas and/or located within 90 m of the previously identified features were included. This algorithm identified a few features that were too far inland, and those polygons were manually edited. Any C-CAP-mapped wetland or water overlying an NWI-mapped impoundment as impounded.
The final Blue Carbon NCS map was created by combining three geospatial layers of information: impoundment status derived from NWI, land cover classes (derived from C-CAP), and probabilistic coastal lands map. The accuracy of this final map was assessed by generating 436 points and requesting review by local experts. Experts were also surveyed about salinity status of these locations and whether the natural hydrology of tidal exchange could be restored if impoundments were removed.
Estimating Greenhouse Gas Removal Rates
Net greenhouse gas removal was estimated based on emissions factors related to management activities data for various land cover types. A reduction in methane emissions coupled with an increase in carbon sequestration in biomass and sediments results in a net removal of greenhouse gases. This analysis focused largely on reduction of methane emissions gained by restoring intertidal connectivity by removing barriers created by impoundments.
Methane emissions were derived from Poffenbarger et al. (2011), updated for the Second State of the Carbon Cycle (SOCCR-2) report (Cavallaro et al., 2018). Mean and standard error were used for five salinity classes: fresh (0-0.5 ppt), oligohaline (0.5-5 ppt), mesohaline (5-18 ppt), polyhaline (18-30 ppt), saline (30-50 ppt). Similarly, mean and SE were used for two salinity subclasses represented in C-CAP: estuarine (>5 ppt) and palustrine (<5 ppt). To propagate uncertainty in the underlying methane emissions data, a skew-normal distribution was fit to annualized methane emissions data by salinity class (Fig. 1). Median and standard error were derived using a bootstrapping approach by taking 1,000 random draws from the skew normal probability distribution with a dataset equal to the size used to calibrate it.
Results from the survey of experts revealed that restoration to intertidal conditions was not possible for all coastal impoundments. Therefore, a “weighted emissions factor” was calculated for each polygon parcel based on the amount of methane reduction based on the type of restoration conversion (e.g., palustrine to estuarine) and proportional change in saline types. Uncertainty was estimated using a Monte Carlo approach by taking a random draw from the mean and SE of methane reduction based on the weighted emissions factors.
All CH4 emissions and emission reductions were converted from gCH4 m2 y-1 to gCO2 m2 y-1 using a sustained global warming potential of 45x (Neubauer et al., 2015). For each polygon, total emissions or removals were estimated as the sum total of the emissions factors multiplied by their respective activities data (estimated areas), for each potential restoration type (Table 2). The mean, as well as the 95% credible intervals, are reported using the output of the Monte Carlo Analysis.
See Holmquist et al. (2022) for details of this analysis.
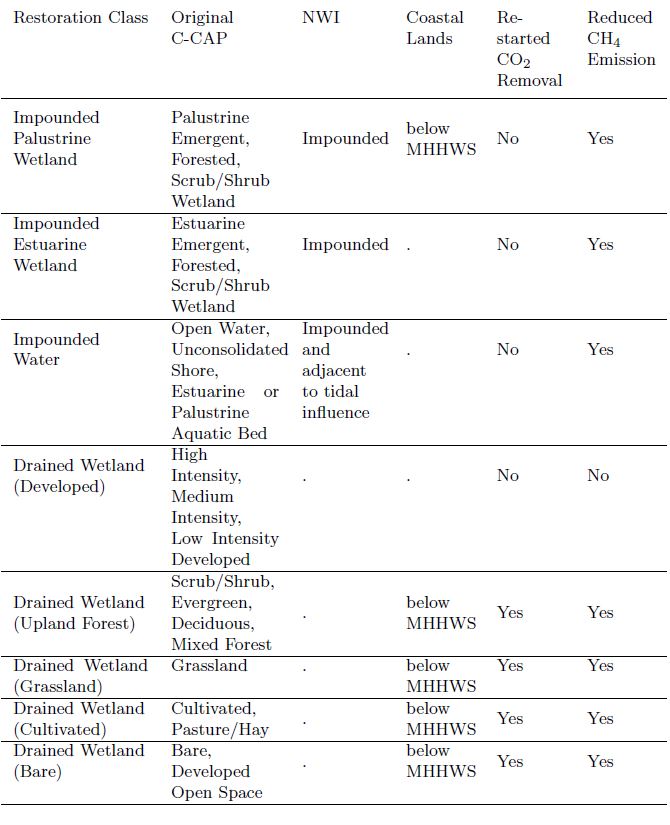
Table 2. Summary of how land-cover classes from three products were combined to classify potentially restorable types. These include the Coastal Change Analysis Program (C-CAP), National Wetlands Inventory (NWI) and the probabilistic coastal lands map. Restarted carbon burial or potentially reduced methane emissions were considered in conversions back to natural intertidal wetlands. MMHWS refers to “mean higher high tide water line for spring tides” in Holmquist and Windham-Myers (2021). Source: Holmquist et al. (2022).
Data Access
These data are available through the Oak Ridge National Laboratory (ORNL) Distributed Active Archive Center (DAAC).
Blue Carbon-based Natural Climate Solutions, Priority Maps for the U.S., 2006-2011
Contact for Data Center Access Information:
- E-mail: uso@daac.ornl.gov
- Telephone: +1 (865) 241-3952
References
Cavallaro, N., G. Shrestha, R. Birdsey, M.A. Mayes, R.G. Najjar, S.C. Reed, P. Romero-Lankao, and Z. Zhu, editors. 2018. Second State of the Carbon Cycle Report. https://doi.org/10.7930/soccr2.2018
Holmquist, J.R., M. Eagle, R.L. Molinari, S. Nick, L.C. Stachowicz, and K.D. Kroeger. 2022. Mapping blue carbon-based natural climate solutions for the United States. In process, 2022.
Holmquist, J.R., and L. Windham-Myers. 2021. Relative Tidal Marsh Elevation Maps with Uncertainty for Conterminous USA, 2010. ORNL DAAC, Oak Ridge, Tennessee, USA. https://doi.org/10.3334/ORNLDAAC/1844
Neubauer, S.C., and J.P. Megonigal. 2015. Moving beyond global warming potentials to quantify the climatic role of ecosystems. Ecosystems 18:1000–1013. https://doi.org/10.1007/s10021-015-9879-4
NOAA. 2014. Coastal Change Analysis Program (2006-2010). Accessed 29 July 2014. https://www.coast.noaa.gov/digitalcoast/data/ccapregional.html
Poffenbarger, H.J., B.A. Needelman, and J.P. Megonigal. 2011. Salinity influence on methane emissions from tidal marshes. Wetlands 31:831–842. https://doi.org/10.1007/s13157-011-0197-0
USFWS. 2014. U.S. Fish and Wildlife Service: National Wetlands Inventory. Accessed 1 October 2014. https://fws.gov/wetlands/Data/Data-Download.html